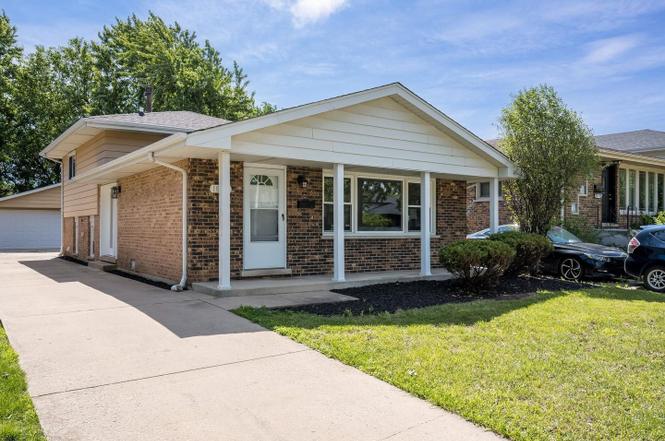
18011 Greenview Ter · Country Club Hills, IL
Flood risk 5/10 · Moderate
- FEMA flood zone
- X (unshaded)
- Chance of flooding over 30 yrs
- 0.66%
- Est. flood insurance / yr
- $473 – $860
Fire risk 1/10 · Minimal
- Est. fire insurance / yr
- $804 – $1,492
Heat risk 3/10 · Minor
- Hot days now (above 101°F)
- 7 days/yr
- Hot days in 30 yrs
- 15 days/yr
Wind risk 2/10 · Minimal
- Chance of severe wind over 30 yrs
- —
Air-quality risk 3/10 · Minor
- Unhealthy air days now
- 4 days/yr
- Unhealthy air days in 30 yrs
- 4 days/yr
Risk factors via First Street. Map © Google.
Why this score? — see what drove the F grade
The composite is a weighted blend of 9 inputs, each scored 0–100. Each bar is that input's sub-score; the figure is the points it added to the 100-point composite (weight × sub-score).
- Cash flow +6.9/30.0
- 1% rule +4.5/10.0
- Livability +3.8/5.0
- Rent growth +2.5/5.0
- Condition / age +2.5/5.0
- Schools +1.5/10.0
- DSCR +1.2/10.0
- ARV discount +0.0/15.0
- Appreciation +0.0/10.0
$249,900
🖨 Deal sheet 📄 Offer letter ✓ Due diligence
Listing remarks MLS
Beautifully updated split-level home Country Club hills! This stunning property has undergone a complete makeover in 2017, featuring updates on kitchen and bathrooms, as well as flooring and appliances. With a spacious family room perfect for hosting guests, you'll love the entertaining possibilities. The large backyard, along with the huge 2.5 car detached garage, offers ample space for your needs. There are so many incredible features that it's impossible to list them all - you must see it for yourself! Don't wait too long, schedule a tour today and discover why this home should be yours.
Key facts
- Large backyard
- Spacious family room
- Detached garage
Tags
Property features AI
Finance
- Other: Parcel number 28344030040000
- HOA & community: No master association fee required
Exterior
- Parking: Detached garage with two garage spaces; Side driveway; Garage door opener; Garage is owned
- Utilities: Public water; Public sewer
- Home design: Detached single-family home; Split-level design; Fee simple ownership; Rehab completed in 2026
- Construction: Brick construction; Asphalt roof; Estimated building age: 41–50 years
- Exterior features: Lot dimensions approximately 40 x 142; Lot smaller than 0.25 acre; Curbs, sidewalks, street lights and paved streets in the neighborhood; Directions: Pulaski to Soleri Dr, west to Greenview, north to address
Interior
- Kitchen: Eating area / table space kitchen; Range; Microwave; Dishwasher; Refrigerator
- Bedrooms: Three bedrooms (master and two additional bedrooms on second level)
- Bathrooms: One full bath; One half bath; Basement has a bathroom
- Heating & cooling: Natural gas forced air heating; Central air conditioning
- Interior features: Seven total rooms; Finished full basement
- Laundry & utility: Basement laundry room; Washer; Dryer
Neighborhood map
What this means for you Summary
Snapshot
- This is a 3-bed/1.5-bath single-family listed at $250k.
Deal economics
- At list price, monthly cash flow is $-373 ($-4k/yr) — negative.
- To cash-flow at today's rent, offer at most $199k (20.3% below list).
- To meet the 1% rule (rent ≥ 1% of price), the offer needs to be $237k (5.2% below list).
- Recommended offer: $199k (20.3% below list) — sets the bar for cash-flow.
- Cap rate 4.5% vs local median 7.4% in Country Club Hills — below-typical yield; the buyer is paying a premium for something (appreciation thesis, condition, location) that the cap rate doesn't capture.
Location & tenants
- Location reads 75/100 on livability (#212 in IL, #3,963 nationally) — a middle-class / working-renter tenant base. Strengths: commute A+, cost of living A+, housing A+; Watch: crime D+, health & safety D+, schools F.
- Bremen Chsd 228 (suburban): math 15% / reading 17% proficiency, ranked #468 of 620 in IL (top 76%) — low school quality limits family demand, transient renter base, plan for 1-2y turnover.
- Market conditions: 94 active listings in the ZIP; 8 comparable units currently listed for rent nearby; rentals leasing fast (median 2d on market — plan ~1-2 weeks tenant-placement turnaround); 6,272 units permitted in Cook County in 2024 (4,658 in 5+ unit buildings).
Forward outlook
- Local home prices are declining (-3.0%/yr); year-one equity from $2k of loan paydown is wiped out by about $7k of value loss. Plan a longer hold.
Negotiation context
- Only 2 days on market — expect competitive offers; lowballing is unlikely to land.
- 6 sale attempts since 19y ago with the ask held roughly flat each time — persistent listings suggest the price (not the market) is what's stuck; bring a comps-based counter.
Risks & watch-outs
- Watch-outs: property tax is 4.0% of price.
- Climate carrying-cost: moderate flood risk — expect insurance premiums to compound above CPI over the hold.
Questions for the listing agent
- What do current leases actually rent for vs. the listed asking? Can we see a recent rent roll and the last 12 months of T-12 income?
- Property tax is high relative to price — has the assessment been appealed recently, and will the sale trigger a re-assessment?
- Is there a deadline driving the sale (1031 exchange, divorce, estate, relocation)? That informs how much negotiation room exists.
- Schools are F-rated, which usually means shorter tenancies and higher turnover. Who's the typical renter profile here, and what's been the actual vacancy rate?
- Crime grade is D in this area — have there been break-ins, vandalism, or insurance claims at this property in the last 3 years? What carrier currently insures it and at what premium?
- The area grade is low — what's the realistic commute time and amenity access for the typical tenant pool here? Any planned neighborhood developments (good or bad) we should know about?
- What's the average days-on-market for RENTAL listings here right now (not sales)? A rising rental-DOM trend means longer vacancies and softer asking-rent achievability than the comps imply.
- What's the recent tenant-quality profile in this submarket — average credit score on applications, eviction rate, late-payment / NSF rate, and stable-employment percentage? A property-management company in the area should have these aggregated.
- How much new for-sale + rental construction is in the pipeline within 1–3 miles? Heavy new supply typically softens prices + rents 12–24 months out; constrained supply supports both.
Investment metrics
- 1% rule
- 0.95% ✗
- Cap rate
- 4.50%
- Cash-on-cash
- -6.40%
- DSCR
- 0.72
- GRM
- 8.8
CMA / ARV
- ARV (on-the-fly)
- $208,177
- Comps found
- 12
Show comp detail 12 sales within ~0.75 mi
| Address | Dist | Beds/Ba | Sqft | Sold | Price | $/sf | Match |
|---|---|---|---|---|---|---|---|
| 18008 Edwards Ave | 0.09mi | 3/1.5 | 1,136 (-2%) | 0mo | $273,600 | $241 | 91 |
| 18040 Springfield Ave | 0.23mi | 3/1.0 | 1,139 (-2%) | 2mo | $180,000 | $158 | 82 |
| 18115 Idlewild Dr | 0.23mi | 3/2.0 | 1,200 (+3%) | 6mo | $100,000 | $83 | 78 |
| 18207 Ravisloe Ter | 0.32mi | 3/1.5 | 1,057 (-9%) | 3mo | $250,000 | $237 | 68 |
| 4320 177th St | 0.51mi | 3/1.5 | 1,136 (-2%) | 6mo | $178,000 | $157 | 68 |
| 4340 Mayfair Ct | 0.37mi | 3/2.0 | 1,243 (+7%) | 3mo | $163,400 | $131 | 67 |
| 17555 Cypress Ave | 0.53mi | 3/2.0 | 1,239 (+6%) | 0mo | $163,000 | $132 | 62 |
| 17620 Winston Dr | 0.51mi | 3/1.0 | 1,091 (-6%) | 3mo | $195,000 | $179 | 61 |
| 4411 177th Pl | 0.53mi | 4/1.5 (+1) | 1,212 (+4%) | 3mo | $126,653 | $104 | 60 |
| 18109 Idlewild Dr | 0.22mi | 4/2.0 (+1) | 1,000 (-14%) | 6mo | $195,000 | $195 | 55 |
| 3761 Kirk Ct | 0.45mi | 4/2.0 (+1) | 1,296 (+11%) | 7mo | $275,000 | $212 | 47 |
| 17861 Harvard Ln | 0.70mi | 4/2.0 (+1) | 1,333 (+15%) | 7mo | $280,000 | $210 | 30 |
Match score weights: distance 35% · size 25% · config 20% · recency 20%. Top-matched comps best support the ARV.
Projected returns pro-forma
-3.0% appreciation · 3.0% rent growth · sell at horizon
- IRR
- -27.1%
- Equity multiple
- 0.09×
- Total profit
- $-63,910
- Equity at exit
- $37,261
- IRR
- -24.3%
- Equity multiple
- -0.21×
- Total profit
- $-84,820
- Equity at exit
- $21,607
Cash invested: $69,972 (down + closing). Projections, not guarantees.
Landlord ↔ Tenant lean methodology
- Overall (STATE)
- 43 Moderately Tenant-Leaning
- State Illinois
- 43 Moderately Tenant-Leaning · D+7
- County
- — inherits STATE
- City
- — inherits STATE
ZIP-level market 60478
- Home prices YoY
- -27.3%
- Active inventory
- 94
- Price-to-rent
- 8.8×
Monthly cashflow live
- Estimated rent
- $2,369 high interval (Pro) →
- Mortgage (P&I)
- −$1,311
- Tax from tax record
- −$830 /mo · $9,962/yr
- Insurance
- −$104
- HOA
- −$0
- Vacancy / Maint / Mgmt
- −$498
- Net cashflow
- $-373
Break-even live
UW: 25.0% down · 7.5% · 30yr · 1.5% tax · 5.0% vac · 8.0% maint · 8.0% mgmt
Financing live
Cash to close
- Down payment
- $62,475
- Closing costs
- $7,497
- Reserves months
- —
- Total cash needed
- —
Loan-product check · same deal, 3 products live
Conventional
25% down · 7.5% · 30yr
- Down + closing
- —
- Monthly P&I
- —
- Monthly cashflow
- —
- DSCR
- —
- Eligible?
- —
Personal DTI + credit; lowest rate.
DSCR
20% down · 8.5% · 30yr
- Down + closing
- —
- Monthly P&I
- —
- Monthly cashflow
- —
- DSCR
- —
- Eligible?
- —
No personal income docs; deal must DSCR.
Hard money
10% down · 12.0% · 12mo
- Down + closing
- —
- Monthly P&I
- —
- Monthly cashflow
- —
- DSCR
- —
- Eligible?
- —
Short-term bridge; refi at stabilization.
Rent comps 8 comps
| Address | Beds | Baths | Sqft | Rent | $/sqft | DOM | Units | Dist |
|---|---|---|---|---|---|---|---|---|
| 17984 Amherst Ct Country Club Hills, IL | 2.0 | 1.0 | 1000 | $1,900 | $1.90 | 1d | 1 | 0.09mi |
| 18019 Ravisloe Ter Country Club Hills, IL | 3.0 | 1.5 | 1150 | $2,800 | $2.43 | 1d | 1 | 0.12mi |
| 1153 Williamsburg Rd Country Club Hills, IL | 2.0 | 1.5 | 1216 | $1,900 | $1.56 | 1d | 1 | 0.56mi |
| 2256 Windsor Ln Country Club Hills, IL | 3.0 | 1.0 | 1212 | $2,250 | $1.86 | 1d | 1 | 0.57mi |
| 4453 Provincetown Dr Country Club Hills, IL | 3.0 | 2.5 | 1300 | $2,500 | $1.92 | 1d | 1 | 0.67mi |
| 3515 Bordeaux Ct Hazel Crest, IL | 4.0 | 2.0 | 1486 | $2,900 | $1.95 | 1d | 1 | 0.76mi |
| 3501 177th St Country Club Hills, IL | 2.0 | 2.0 | 839 | $2,850 | $3.40 | 1d | 1 | 0.84mi |
| 17306 Peach Grove Ln Hazel Crest, IL | 4.0 | 1.0 | 1034 | $2,700 | $2.61 | 1d | 1 | 0.88mi |
Listing history 3 events
-
2026-06-18days on market $249,900 Active 2 DOM
-
2026-06-17remarks 653-char remark
-
2026-06-17$249,900 Active 1 DOM
ⓘ Source: listings_history table (triggers on properties + properties_extension) + one-shot
backfill from property_details.listing_events for pre-trigger history.
Tax reassessment forecast IL · Partial reset (capped growth)
- Current annual tax
- $9,962 · $830/mo
- Projected year-2 tax
- $9,962 · $830/mo
- Expected delta
- $0/yr ($0/mo · 0.0%)
ⓘ Screening estimate from a state-policy table — verify with the county assessor before closing.
Climate risk First Street
- Flood 5/10 Major FEMA zone X (unshaded) · 66% chance over 30 yrs
- Wildfire 1/10 Low
- Heat 3/10 Moderate 7 d/yr ≥101°F today · 15 d/yr by 30 yrs out
- Wind 2/10 Low
- Air quality 3/10 Moderate 4 unhealthy d/yr today · 4 by 30 yrs out
Nearby sold comps map
Loading sold comps map…
Walkable amenities ~0.75 mi
Loading nearby amenities…
Taxation est. · year 1
- Rental income
- $28,429
- − Mortgage interest
- −$13,998
- − Property taxes
- −$9,962
- − Insurance
- −$1,250
- − Repairs & maintenance
- −$2,274
- − Management
- −$2,274
- − Depreciation
- −$7,270
- Taxable loss
- −$8,599
- Est. tax savings @ 24.0%
- +$2,064
- After-tax cash flow
- $-2,415/yr
For passive investors: Depreciation is non-cash, so a rental often shows a tax loss while cash-flowing — sheltering income. Rental losses are passive: they offset passive income freely, and up to $25,000/yr can offset ordinary (W-2) income if you actively participate and your MAGI is under $100k (phasing out to $0 by $150k); unused losses carry forward. On sale, claimed depreciation is recaptured at up to 25%, and gains may owe capital-gains tax (a 1031 exchange can defer both). Figures are a year-1 estimate at your 24.0% rate — not tax advice; consult a CPA.
Schools (NCES district)
- District
- Bremen Chsd 228
- NCES district ID
- 1707050
- Math proficiency
- 15% ▼ -4.00%
- Reading proficiency
- 17% ▼ -5.00%
- Median HH income
- $57,625
- Composite
- 15.32/100
- National rank
- #9327
- State rank
- #468 of 620 in IL
Livability — Country Club Hills
- Score
- 75/100
- State rank
- #212
- US rank
- #3963
Category grades
Schools grade is shown separately in the Schools card above.
Census & demographics
- Census place
- Country Club Hills, IL
- City population
- 16,549
- Population (ZIP)
- 16,549
Population outlook (Cook County) Hauer SSP2
- Today (2025)
- 5,347,519 people
- By 2030
- 5,357,703 · +0.2%
- By 2040
- 5,324,924 · -0.4%
- By 2050
- 5,230,762 · -2.2%
- By 2075
- 4,785,735 · -10.5%
- By 2100
- 4,188,836 · -21.7%
Race, ethnicity, and origin ACS 2023
- Neighborhood character
- Predominantly Black (87%)
- Race & ethnicity
- Black 87% White 8% Hispanic / Latino 4% Two or more races 3%
- Common ancestry
- Romanian 1%
- Foreign-born
- 4% · Canada
- Languages at home
- 96% English-only · Spanish 2%
Political lean MEDSL · Cook
- 2024 margin
- Solid D (+42.0) · D 70.4% · R 28.4% · Other 1.2%
- 2008→2024 swing
- -11.4pp toward R · 2008: 53.4pp · 2024: 42.0pp
- All cycles
- 2024: D+42.0 2020: D+50.3 2016: D+53.0 2012: D+49.4 2008: D+53.4
Not yet ingested
- Civics
- —
Market trends
- HPI YoY
- ▼ -79.73%
- Current HPI
- 212.3917
- Rent YoY
- —
- Metro
- —
- State GDP YoY
- ▲ 1.59%
- F500 in state
- 60
Industry mix (Fortune 500 HQ in IL)
| Industry | F500 HQs | Revenue |
|---|---|---|
| Insurance | 4 | $201B |
|
||
| Consumer Goods | 4 | $87B |
|
||
| Industrial Machinery | 3 | $64B |
|
||
| Healthcare | 2 | $55B |
|
||
| Retail / Pharmacy | 1 | $148B |
|
||
| Agriculture / Food | 1 | $86B |
|
||
Price history
+287.4% since first listed21 events — show timeline
- 2026-06-15 Listed $249,900 MRED as Distributed by MLS Grid
- 2023-10-18 Sold (Public Records) $220,000 Public Records
- 2023-10-11 Sold (MLS) $220,000 MRED as Distributed by MLS Grid
- 2023-08-31 Contingent — MRED as Distributed by MLS Grid
- 2023-08-12 Relisted — MRED as Distributed by MLS Grid
- 2023-07-11 Contingent — MRED as Distributed by MLS Grid
- 2023-07-03 Relisted — MRED as Distributed by MLS Grid
- 2023-06-29 Contingent — MRED as Distributed by MLS Grid
- 2023-06-26 Listed $219,900 MRED as Distributed by MLS Grid
- 2007-04-06 Sold (Public Records) $183,000 Public Records
- 2007-04-02 Sold (MLS) $183,000 MRED as Distributed by MLS Grid
- 2007-03-12 Listing Removed — MRED as Distributed by MLS Grid
- 2007-03-12 Listed $185,000 MRED as Distributed by MLS Grid
- 2007-03-09 Listing Removed — MRED as Distributed by MLS Grid
- 2007-01-09 Listed — MRED as Distributed by MLS Grid
- 2004-10-07 Sold (Public Records) $170,000 Public Records
- 2003-10-14 Sold (Public Records) $151,000 Public Records
- 1999-09-22 Sold (Public Records) $105,000 Public Records
- 1999-03-09 Sold (Public Records) $130,000 Public Records
- 1994-10-17 Sold (Public Records) $89,000 Public Records
- 1988-11-07 Sold (Public Records) $64,500 Public Records
Property tax history
+3.7%/yrLatest (2023): $9,962 · +21.2% YoY. Source: county tax records.
Cash-flow waterfall
monthlySold comps — $/sqft
last 12 mo · ≤1 miLoading sold comps…