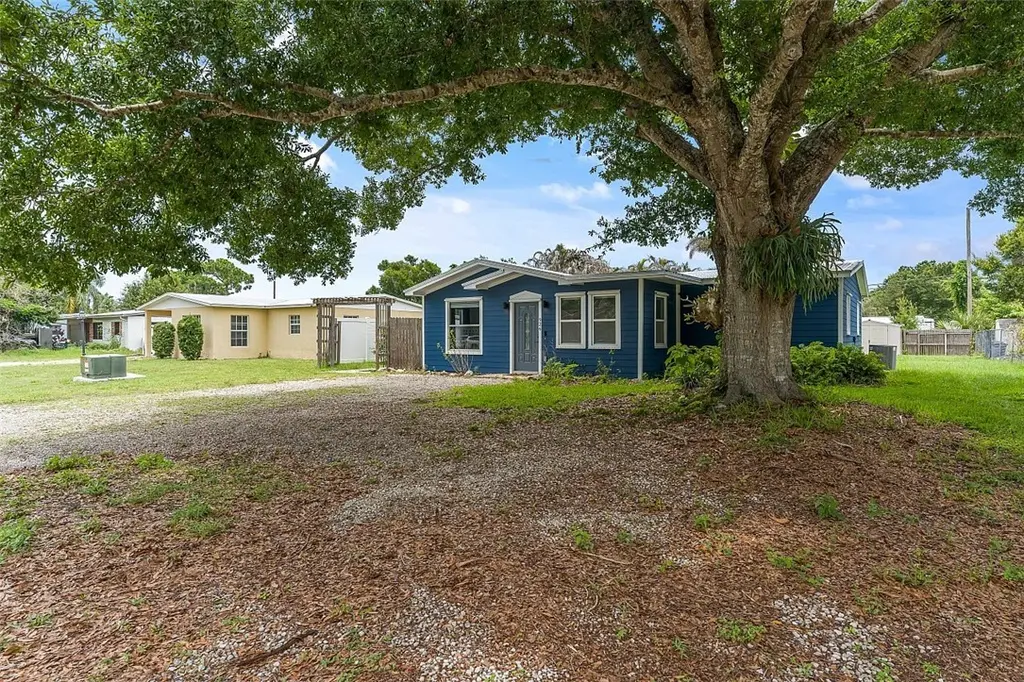
926 37th Ave · Vero Beach South, FL
Flood risk 1/10 · Minimal
- FEMA flood zone
- X (unshaded)
- Chance of flooding over 30 yrs
- 0.0%
- Est. flood insurance / yr
- $507 – $1,088
Fire risk 1/10 · Minimal
- Est. fire insurance / yr
- $947 – $1,759
Heat risk 10/10 · Severe
- Hot days now (above 105°F)
- 7 days/yr
- Hot days in 30 yrs
- 24 days/yr
Wind risk 10/10 · Severe
- Chance of severe wind over 30 yrs
- 99.0%
Air-quality risk 1/10 · Minimal
- Unhealthy air days now
- 0 days/yr
- Unhealthy air days in 30 yrs
- 0 days/yr
Risk factors via First Street. Map © Google.
Why this score? — see what drove the D+ grade
The composite is a weighted blend of 9 inputs, each scored 0–100. Each bar is that input's sub-score; the figure is the points it added to the 100-point composite (weight × sub-score).
- Cash flow +14.1/30.0
- ARV discount +11.2/15.0
- DSCR +4.3/10.0
- Schools +4.2/10.0
- Livability +3.9/5.0
- 1% rule +3.7/10.0
- Condition / age +2.5/5.0
- Rent growth +2.1/5.0
- Appreciation +0.0/10.0
$299,000
🖨 Deal sheet (PDF) 📄 Offer letter ✓ Due diligence
Listing remarks MLS
Very Charming, clean, spacious with split floor plan, sunny bonus room, large kitchen with lots of cabinets, freshly painted, brand new carpet in guest bedrooms, inside laundry. 2021 Metal Roof, WH 2020 and a 220 Volt outlet for a generator. Large back yard with patio and an extra-large brick patio on the side for enjoying the gorgeous outdoors. Two sheds one with power. Great location and so quiet you can listen to the birds singing. sizes are approximate and subject to error.
Key facts
- Large backyard
- Spacious lot
- Outdoor space
Tags
Property features AI
Finance
- Financial info: Pets allowed
- HOA & community: No association
Exterior
- Parking: Driveway
- Utilities: Public water; Septic tank
- Home design: Single-story home; Faces west; Residential property
- Construction: Frame construction; Metal roof
- Exterior features: Fenced yard; Patio; Storage shed(s); Property has a view; Lot approximately 0.22 acres (70 x 140); Less than quarter acre
Interior
- Kitchen: Dishwasher; Range; Microwave; Electric water heater
- Bedrooms: Primary bedroom is downstairs
- Flooring: Tile; Vinyl; Wood
- Bathrooms: 2 full bathrooms
- Heating & cooling: Central heating; Central air conditioning
- Interior features: Unfurnished; Primary bedroom on the ground floor; Split bedroom layout; Tile, vinyl, and wood flooring
- Laundry & utility: Washer and dryer in unit
Neighborhood map
What this means for you Summary
Snapshot
- This is a 3-bed/1.0-bath single-family listed at $299k.
Deal economics
- At list price, monthly cash flow is $46 ($552/yr) — positive.
- The deal already cash-flows at list — no discount required.
- To meet the 1% rule (rent ≥ 1% of price), the offer needs to be $259k (13.3% below list).
- Recommended offer: $259k (13.3% below list) — sets the bar for 1% rule.
- Cap rate 6.5% vs local median 4.3% in Vero Beach South — top-decile yield for the area; either an underpriced asset or a hidden risk that comps aren't pricing in. Stress-test before assuming the spread holds.
Location & tenants
- Location reads 78/100 on livability (#163 in FL, #2,445 nationally) — a middle-class / working-renter tenant base. Strengths: commute A+, housing A+, health & safety A; Watch: amenities F.
- Indian River (other): math 48% / reading 52% proficiency, ranked #35 of 73 in FL (top 48%) — acceptable for families but not a draw, mixed tenant base, ~2y average lease.
- Zoned schools: Glendale Elementary School (math 55% / reading 54%, grade C, #892 of 2,144 statewide, top 44%, 455 students, 73% FRL); Storm Grove Middle School (math 54% / reading 55%, grade B-, #183 of 571 statewide, top 34%, 1,020 students, 50% FRL); Vero Beach High School (math 28% / reading 43%, grade F, #367 of 667 statewide, top 57%, 2,847 students, 50% FRL) — zoned schools at 58% FRL track the district average.
- Market conditions: Rents soft (-1.7%/yr); 208 active listings in the ZIP; 19 comparable units currently listed for rent nearby; rentals at typical pace (median 15d on market — plan ~3-4 weeks tenant-placement turnaround); 564 units permitted in Indian River County in 2024 (281 in 5+ unit buildings).
- At $2,593/mo this rent would consume 57% of the median local household income ($55k/yr) (locally 1166% of renters already pay >50% of income on rent) — very limited rent-growth headroom before tenants either downsize or default.
Forward outlook
- Local home prices are declining (-3.0%/yr); year-one equity from $2k of loan paydown is wiped out by about $9k of value loss. Plan a longer hold.
- Indian River County population projected at +18% by 2050 — long-run rental-demand tailwind backs the buy-and-hold thesis.
Negotiation context
- Only 13 days on market — expect competitive offers; lowballing is unlikely to land.
- 7 sale attempts since 3y ago with the ask held roughly flat each time — persistent listings suggest the price (not the market) is what's stuck; bring a comps-based counter.
Risks & watch-outs
- Climate carrying-cost: severe wind risk, 99% chance of damaging wind over 30y; extreme-heat days projected 7→24/yr by 2055 (HVAC capex compounding) — expect insurance premiums to compound above CPI over the hold.
Questions for the listing agent
- Built in 1964 — when were the roof, HVAC, electrical panel, plumbing, and water heater last replaced?
- Is there a deadline driving the sale (1031 exchange, divorce, estate, relocation)? That informs how much negotiation room exists.
- The area grade is low — what's the realistic commute time and amenity access for the typical tenant pool here? Any planned neighborhood developments (good or bad) we should know about?
- What's the average days-on-market for RENTAL listings here right now (not sales)? A rising rental-DOM trend means longer vacancies and softer asking-rent achievability than the comps imply.
- What's the recent tenant-quality profile in this submarket — average credit score on applications, eviction rate, late-payment / NSF rate, and stable-employment percentage? A property-management company in the area should have these aggregated.
- How much new for-sale + rental construction is in the pipeline within 1–3 miles? Heavy new supply typically softens prices + rents 12–24 months out; constrained supply supports both.
Investment metrics
- 1% rule
- 0.87% ✗
- Cap rate
- 6.48%
- Cash-on-cash
- 0.66%
- DSCR
- 1.03
- GRM
- 9.6
CMA / ARV
- ARV (on-the-fly)
- $325,734
- Comps found
- 12
Show comp detail 12 sales within ~0.75 mi
| Address | Dist | Beds/Ba | Sqft | Sold | Price | $/sf | Match |
|---|---|---|---|---|---|---|---|
| 1235 37th Ave | 0.42mi | 3/2.0 | 1,368 (-2%) | 1mo | $299,900 | $219 | 72 |
| 630 42nd Ct | 0.52mi | 3/2.0 | 1,432 (+2%) | 3mo | $295,000 | $206 | 66 |
| 1316 41st Ave | 0.55mi | 3/2.0 | 1,414 (+1%) | 7mo | $375,000 | $265 | 63 |
| 1375 39th Ave | 0.60mi | 3/2.0 | 1,382 (-1%) | 8mo | $330,000 | $239 | 59 |
| 891 46th Ave | 0.65mi | 3/2.0 | 1,412 (+1%) | 9mo | $355,000 | $251 | 56 |
| 2735 6th St | 0.68mi | 3/2.0 | 1,383 (-1%) | 10mo | $305,000 | $221 | 54 |
| 1360 39th Ave | 0.59mi | 3/2.0 | 1,352 (-3%) | 11mo | $279,000 | $206 | 54 |
| 660 42nd Ave | 0.45mi | 3/2.0 | 1,554 (+11%) | 5mo | $450,000 | $290 | 52 |
| 746 42nd Ave | 0.39mi | 3/2.0 | 1,593 (+14%) | 5mo | $338,000 | $212 | 50 |
| 4285 12th Pl | 0.56mi | 3/2.0 | 1,571 (+12%) | 6mo | $375,000 | $239 | 44 |
| 4116 13th St | 0.56mi | 3/2.0 | 1,604 (+15%) | 2mo | $374,000 | $233 | 44 |
| 2806 13th St | 0.70mi | 3/2.0 | 1,300 (-7%) | 10mo | $290,000 | $223 | 43 |
Match score weights: distance 35% · size 25% · config 20% · recency 20%. Top-matched comps best support the ARV.
Projected returns pro-forma
-3.0% appreciation · 0.0% rent growth · sell at horizon
- IRR
- -18.6%
- Equity multiple
- 0.37×
- Total profit
- $-53,122
- Equity at exit
- $44,582
- IRR
- -18.2%
- Equity multiple
- 0.14×
- Total profit
- $-71,857
- Equity at exit
- $25,852
Cash invested: $83,720 (down + closing). Projections, not guarantees.
Landlord ↔ Tenant lean methodology
- Overall (STATE)
- 87 Strongly Landlord-Friendly
- State Florida
- 87 Strongly Landlord-Friendly · R+3
- County
- — inherits STATE
- City
- — inherits STATE
ZIP-level market 32960
- Home prices YoY
- -25.5%
- Rents YoY
- -1.7%
- Active inventory
- 208
- Price-to-rent
- 9.6×
Monthly cashflow live
- Estimated rent
- $2,593 high interval (Pro) →
- Mortgage (P&I)
- −$1,568
- Tax from tax record
- −$310 /mo · $3,723/yr
- Insurance
- −$125
- HOA
- −$0
- Vacancy / Maint / Mgmt
- −$545
- Net cashflow
- $46
Break-even live
Sensitivity live
| Price | -10% $215 | -5% $131 | +0% $46 | +5% $-39 | +10% $-123 |
|---|---|---|---|---|---|
| Rent | -10% $-159 | -5% $-56 | +0% $46 | +5% $148 | +10% $251 |
| Rate | -1.0pp $197 | -0.5pp $122 | base $46 | +0.5pp $-31 | +1.0pp $-110 |
UW: 25.0% down · 7.5% · 30yr · 1.5% tax · 5.0% vac · 8.0% maint · 8.0% mgmt
Financing live
Cash to close
- Down payment
- $74,750
- Closing costs
- $8,970
- Reserves months
- —
- Total cash needed
- —
Loan-product check · same deal, 3 products live
Conventional
25% down · 7.5% · 30yr
- Down + closing
- —
- Monthly P&I
- —
- Monthly cashflow
- —
- DSCR
- —
- Eligible?
- —
Personal DTI + credit; lowest rate.
DSCR
20% down · 8.5% · 30yr
- Down + closing
- —
- Monthly P&I
- —
- Monthly cashflow
- —
- DSCR
- —
- Eligible?
- —
No personal income docs; deal must DSCR.
Hard money
10% down · 12.0% · 12mo
- Down + closing
- —
- Monthly P&I
- —
- Monthly cashflow
- —
- DSCR
- —
- Eligible?
- —
Short-term bridge; refi at stabilization.
Rent comps 19 comps
| Address | Beds | Baths | Sqft | Rent | $/sqft | DOM | Units | Dist |
|---|---|---|---|---|---|---|---|---|
| 1406 36th Ave Vero Beach, FL | 2.0 | 2.5 | 1284 | $2,150 | $1.67 | 23d | 1 | 0.59mi |
| 1406 36th Ave Vero Beach, FL | 2.0 | 2.5 | 1284 | $2,000 | $1.56 | 15d | 1 | 0.59mi |
| 1408 36th Ave Unit 1408 Vero Beach, FL | 2.0 | 2.5 | 1284 | $2,150 | $1.67 | 23d | 1 | 0.60mi |
| 1330 28th Ave Vero Beach, FL | 3.0 | 2.0 | 1488 | $3,200 | $2.15 | 23d | 1 | 0.72mi |
| 3285 3rd Pl Unit 1018166P Vero Beach, FL | 3.0 | 2.0 | 1420 | $3,708 | $2.61 | 15d | 1 | 0.77mi |
| 4141 16th St #109 Vero Beach, FL | 2.0 | 2.0 | 932 | $1,500 | $1.61 | 15d | 1 | 0.79mi |
| 405 27th Ct Vero Beach, FL | 3.0 | 2.0 | 1100 | $1,850 | $1.68 | 15d | 1 | 0.84mi |
| 725 23rd Ave Vero Beach, FL | 3.0 | 2.0 | 1696 | $3,500 | $2.06 | 23d | 1 | 0.87mi |
| 2616 15th St Vero Beach, FL | 2.0 | 2.0 | 1268 | $2,400 | $1.89 | 15d | 1 | 0.93mi |
| 1715 41st Ave Vero Beach, FL | 3.0 | 2.0 | 1335 | $1,800 | $1.35 | 15d | 1 | 1.03mi |
| 1608 24th Ave Unit NA Vero Beach, FL | 3.0 | 2.0 | 1800 | $2,000 | $1.11 | 23d | 1 | 1.17mi |
| 1616 24th Ave Vero Beach, FL | 3.0 | 2.0 | 1430 | $2,495 | $1.74 | 15d | 1 | 1.18mi |
| 1865 40th Ave #1 Vero Beach, FL | 2.0 | 1.0 | 940 | $1,500 | $1.60 | 23d | 1 | 1.19mi |
| 1816 5th Pl Unit 1018162P Vero Beach, FL | 2.0 | 2.0 | 1323 | $3,841 | $2.90 | 23d | 1 | 1.24mi |
| 1702 7th St Vero Beach, FL | 3.0 | 2.0 | 1230 | $2,100 | $1.71 | 15d | 1 | 1.28mi |
| 2047 38th Ave Vero Beach, FL | 3.0 | 2.0 | 1200 | $2,400 | $2.00 | 23d | 1 | 1.40mi |
| 3673 2nd Pl SW Vero Beach, FL | 3.0 | 2.0 | 1410 | $4,800 | $3.40 | 23d | 1 | 1.41mi |
| 3673 2nd Pl SW Vero Beach, FL | 3.0 | 2.0 | 1410 | $4,800 | $3.40 | 15d | 1 | 1.41mi |
| 1725 20th Ave Vero Beach, FL | 3.0 | 2.0 | 1394 | $3,000 | $2.15 | 15d | 1 | 1.45mi |
Listing history 14 events
-
2026-06-22days on market $299,000 Active 13 DOM
-
2026-06-19days on market $299,000 Active 11 DOM
-
2026-06-18days on market $299,000 Active 10 DOM
-
2026-06-17days on market $299,000 Active 9 DOM
-
2026-06-16days on market $299,000 Active 8 DOM
-
2026-06-15days on market $299,000 Active 7 DOM
-
2026-06-14days on market $299,000 Active 5 DOM
-
2026-06-13remarks 617-char remark
-
2026-06-13days on market $299,000 Active 4 DOM
-
2026-06-10days on market $299,000 Active 2 DOM
-
2026-06-09days on market $299,000 Active 1 DOM
-
2026-06-08days on market $299,000 Active 2 DOM
-
2026-06-07remarks 578-char remark
-
2026-06-07$299,000 Active 1 DOM
ⓘ Source: listings_history table (triggers on properties + properties_extension) + one-shot
backfill from property_details.listing_events for pre-trigger history.
Tax reassessment forecast FL · Resets to sale price
- Current annual tax
- $3,723 · $310/mo
- Projected year-2 tax
- $3,723 · $310/mo
- Expected delta
- $0/yr ($0/mo · 0.0%)
ⓘ Screening estimate from a state-policy table — verify with the county assessor before closing.
Climate risk First Street
- Flood 1/10 Low FEMA zone X (unshaded) · 0% chance over 30 yrs
- Wildfire 1/10 Low
- Heat 10/10 Extreme 7 d/yr ≥105°F today · 24 d/yr by 30 yrs out
- Wind 10/10 Extreme 99% chance of damaging wind over 30 yrs
- Air quality 1/10 Low 0 unhealthy d/yr today · 0 by 30 yrs out
Nearby sold comps map
Loading sold comps map…
Walkable amenities ~0.75 mi
Loading nearby amenities…
Taxation est. · year 1
- Rental income
- $31,122
- − Mortgage interest
- −$16,749
- − Property taxes
- −$3,723
- − Insurance
- −$1,495
- − Repairs & maintenance
- −$2,490
- − Management
- −$2,490
- − Depreciation
- −$8,698
- Taxable loss
- −$4,523
- Est. tax savings @ 24.0%
- +$1,086
- After-tax cash flow
- $1,637/yr
For passive investors: Depreciation is non-cash, so a rental often shows a tax loss while cash-flowing — sheltering income. Rental losses are passive: they offset passive income freely, and up to $25,000/yr can offset ordinary (W-2) income if you actively participate and your MAGI is under $100k (phasing out to $0 by $150k); unused losses carry forward. On sale, claimed depreciation is recaptured at up to 25%, and gains may owe capital-gains tax (a 1031 exchange can defer both). Figures are a year-1 estimate at your 24.0% rate — not tax advice; consult a CPA.
Schools (NCES district)
- District
- Indian River
- NCES district ID
- 1200930
- Math proficiency
- 48% ▼ -9.00%
- Reading proficiency
- 52% ▼ -3.00%
- Median HH income
- $46,597
- Composite
- 42.45/100
- National rank
- #3218
- State rank
- #35 of 73 in FL
Livability — Vero Beach South
- Score
- 78/100
- State rank
- #163
- US rank
- #2445
Category grades
Schools grade is shown separately in the Schools card above.
Census & demographics
- Census place
- Vero Beach South, FL
- County
- Indian River County · 143,738 people
- Metro
- Sebastian-Vero Beach, FL
- Population (ZIP)
- 25,259
- Household income
- $54,682
- Rent vs Own
- Severe rent burden
- 1166.0
Population outlook (Indian River County) Hauer SSP2
- Today (2025)
- 165,104 people
- By 2030
- 172,869 · +4.7%
- By 2040
- 185,640 · +12.4%
- By 2050
- 194,465 · +17.8%
- By 2075
- 211,115 · +27.9%
- By 2100
- 211,781 · +28.3%
Race, ethnicity, and origin ACS 2023
- Neighborhood character
- Majority White (65%)
- Race & ethnicity
- White 65% Hispanic / Latino 16% Two or more races 12% Black 10% Asian 4% Native American 1%
- Hispanic origin (detail)
- Mexican 6% Puerto Rican 3% Cuban 2%
- Common ancestry
- Italian 4% Slovak 3% Romanian 3%
- Foreign-born
- 11% · Canada, Jamaica, Vietnam
- Languages at home
- 82% English-only · Spanish 13% French/Haitian/Cajun 2% Other Asian/Pacific 1%
Political lean MEDSL · Indian River
- 2024 margin
- Strong R (+27.4) · D 36.0% · R 63.4%
- 2008→2024 swing
- -12.5pp toward R · 2008: -14.8pp · 2024: -27.4pp
- All cycles
- 2024: R+27.4 2020: R+21.6 2016: R+24.5 2012: R+22.3 2008: R+14.8
Not yet ingested
- Civics
- —
Market trends
- HPI YoY
- ▼ -103.20%
- Current HPI
- 302.0029
- Rent YoY
- ▼ -1.66%
- Metro
- Sebastian-Vero Beach, FL
- State GDP YoY
- ▲ 3.28%
- F500 in state
- 36
Industry mix (Fortune 500 HQ in FL)
| Industry | F500 HQs | Revenue |
|---|---|---|
| Industrial Technology | 2 | $29B |
|
||
| Insurance | 2 | $17B |
|
||
| Retail | 1 | $60B |
|
||
| Technology Distribution | 1 | $58B |
|
||
| Homebuilding | 1 | $35B |
|
||
| Technology Manufacturing | 1 | $35B |
|
||
Price history
+1658.8% since first listed22 events — show timeline
- 2026-06-05 Listed $299,000 RAIRCMLS
- 2024-05-15 Sold (Public Records) $305,000 Public Records
- 2024-05-10 Sold (MLS) $305,000 RAIRCMLS
- 2024-05-10 Sold (MLS) $305,000 Beaches MLS
- 2024-04-10 Contingent — Beaches MLS
- 2024-04-10 Contingent — RAIRCMLS
- 2024-04-04 Price Changed $305,000 Beaches MLS
- 2024-04-04 Price Changed $305,000 Stellar MLS as Distributed by MLS Grid
- 2024-04-04 Price Changed $305,000 SCMLS
- 2024-04-03 Price Changed $305,000 RAIRCMLS
- 2024-04-02 Listed $335,000 Stellar MLS as Distributed by MLS Grid
- 2023-11-27 Price Changed $335,000 SCMLS
- 2023-11-27 Listing Removed — Beaches MLS
- 2023-11-27 Listed $335,000 Beaches MLS
- 2023-11-24 Relisted — RAIRCMLS
- 2023-11-24 Price Changed $335,000 RAIRCMLS
- 2023-09-17 Contingent — RAIRCMLS
- 2023-08-04 Listed $345,000 Beaches MLS
- 2023-08-04 Listed $345,000 SCMLS
- 2023-07-13 Listed $345,000 RAIRCMLS
- 1982-07-01 Sold (Public Records) $32,000 Public Records
- 1976-11-01 Sold (Public Records) $17,000 Public Records
Property tax history
+23.5%/yrLatest (2025): $3,723 · +93.7% YoY. Source: county tax records.
Cash-flow waterfall
monthlySold comps — $/sqft
last 12 mo · ≤1 miLoading sold comps…