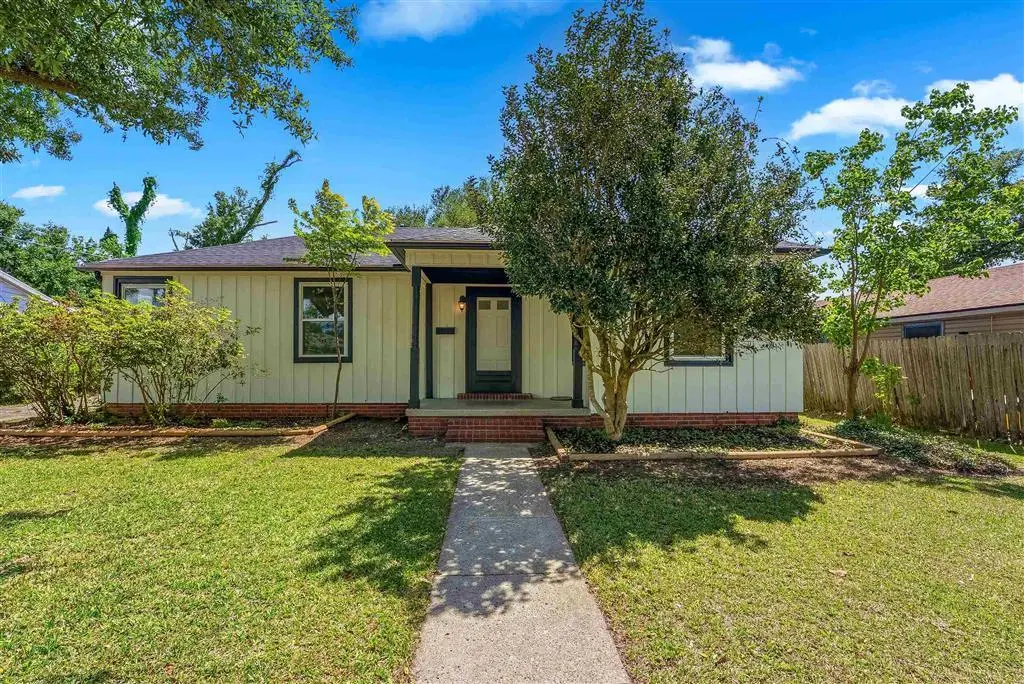
1606 9th St · Lake Charles, LA
Flood risk 6/10 · Moderate
- FEMA flood zone
- A
- Chance of flooding over 30 yrs
- 0.72%
- Est. flood insurance / yr
- $1,009 – $1,996
Fire risk 1/10 · Minimal
- Est. fire insurance / yr
- $1,269 – $2,357
Heat risk 9/10 · Severe
- Hot days now (above 109°F)
- 7 days/yr
- Hot days in 30 yrs
- 20 days/yr
Wind risk 9/10 · Severe
- Chance of severe wind over 30 yrs
- 99.0%
Air-quality risk 2/10 · Minimal
- Unhealthy air days now
- 1 days/yr
- Unhealthy air days in 30 yrs
- 1 days/yr
Risk factors via First Street. Map © Google.
Why this score? — see what drove the C+ grade
The composite is a weighted blend of 9 inputs, each scored 0–100. Each bar is that input's sub-score; the figure is the points it added to the 100-point composite (weight × sub-score).
- Cash flow +26.3/30.0
- ARV discount +10.2/15.0
- DSCR +8.9/10.0
- 1% rule +5.9/10.0
- Rent growth +4.0/5.0
- Livability +3.4/5.0
- Schools +3.1/10.0
- Condition / age +2.5/5.0
- Appreciation +0.0/10.0
$169,000
🖨 Deal sheet 📄 Offer letter ✓ Due diligence
Listing remarks MLS
Welcome to this beautifully remodeled 3-bedroom, 2-bath home in Lake Charles, where modern updates meet timeless character. Thoughtfully renovated from top to bottom, this home offers a fresh, move-in-ready feel while still showcasing original touches that bring warmth and personality. Inside, you’ll find an inviting layout designed for comfortable everyday living, complemented by energy-efficient double-pane windows that fill the home with natural light. Every space has been refreshed with care, creating a seamless blend of style and functionality. Step outside to your own private retreat—a spacious 19' x 15' back patio, perfect for entertaining or unwinding beneath the shade of mature oak trees that add both beauty and tranquility to the setting. Need extra storage? The 9'4" x 10'4" shed, conveniently attached to the carport, provides the perfect solution. Located in a convenient Lake Charles setting, this home delivers the rare combination of modern upgrades, classic charm, and practical features—all in one package. All measurements are more or less.
Key facts
- Mature oak trees
- Private retreat
- Attached shed
Tags
Neighborhood map
What this means for you Summary
Snapshot
- This is a 3-bed/2.0-bath single-family listed at $169k.
Deal economics
- At list price, monthly cash flow is $310 ($4k/yr) — positive.
- The deal already cash-flows at list — no discount required.
- Meets the 1% rule at list price ($2k rent vs $169k).
- Recommended offer: $159k (6.0% below list) — sets the bar for market timing.
- Cap rate 9.4% vs local median 4.3% in Lake Charles — top-decile yield for the area; either an underpriced asset or a hidden risk that comps aren't pricing in. Stress-test before assuming the spread holds.
Location & tenants
- Location reads 68/100 on livability (#95 in LA) — a middle-class / working-renter tenant base. Strengths: commute A+, cost of living A+, housing A+; Watch: crime F, amenities F, employment D-.
- Calcasieu Parish (other): math 30% / reading 44% proficiency, ranked #29 of 98 in LA (top 30%) — families likely to look elsewhere, expect single-tenant / working-renter base with shorter leases.
- Market conditions: Rents rising fast (+6.2%/yr); 363 active listings in the ZIP; 5 comparable units currently listed for rent nearby; rentals lingering (median 44d on market — plan ~5-8 weeks vacancy on turnover, expect pricing pressure); 60% of comp listings sitting > 30 days — soft ceiling on asking rent; 1,298 units permitted in Calcasieu Parish in 2024 (526 in 5+ unit buildings).
- This rent runs 44% of the median local income ($50k/yr) — at the standard rent-burdened threshold; future hikes will face affordability resistance.
Forward outlook
- Local home prices are declining (-3.0%/yr); year-one equity from $1k of loan paydown is wiped out by about $5k of value loss. Plan a longer hold.
- Calcasieu County population projected at +11% by 2050 — modest demand growth; plan on rents tracking national, not racing it.
- At projected returns (-3.0% appreciation + 6.2% rent growth), your $47k cash investment doubles in ~9 years — after that, you're playing with house money.
Negotiation context
- It's been on market 62 days — a 6% lower offer ($159k) is reasonable based on typical stale-listing flexibility.
- Current owner paid $46k; list at $169k implies a 271% gain — meaningful room to come down on a strong offer.
Risks & watch-outs
- Watch-outs: flood insurance adds $125/mo.
- Climate carrying-cost: in FEMA flood zone A (mandatory federal flood insurance); severe wind risk, 99% chance of damaging wind over 30y; extreme-heat days projected 7→20/yr by 2055 (HVAC capex compounding) — expect insurance premiums to compound above CPI over the hold.
Questions for the listing agent
- It's been on market 62 days. Have you received any prior offers? Is the seller open to a 6% concession, seller financing, or rate buy-down credit?
- Built in 1960 — when were the roof, HVAC, electrical panel, plumbing, and water heater last replaced?
- What's the actual annual flood-insurance premium (NFIP or private), and is the property in a SFHA with mandatory coverage?
- Why hasn't it sold? Are there any deal-killer items the seller is aware of (foundation, flood, title, zoning, code violations)?
- Is there a deadline driving the sale (1031 exchange, divorce, estate, relocation)? That informs how much negotiation room exists.
- Schools are B-rated — typically a magnet for longer-tenancy family renters. What's the average tenant stay here, and is there a school-zone premium baked into asking?
- Crime grade is F in this area — have there been break-ins, vandalism, or insurance claims at this property in the last 3 years? What carrier currently insures it and at what premium?
- What's the average days-on-market for RENTAL listings here right now (not sales)? A rising rental-DOM trend means longer vacancies and softer asking-rent achievability than the comps imply.
- What's the recent tenant-quality profile in this submarket — average credit score on applications, eviction rate, late-payment / NSF rate, and stable-employment percentage? A property-management company in the area should have these aggregated.
- How much new for-sale + rental construction is in the pipeline within 1–3 miles? Heavy new supply typically softens prices + rents 12–24 months out; constrained supply supports both.
Investment metrics
- 1% rule
- 1.09% ✓
- Cap rate
- 9.38%
- Cash-on-cash
- 11.04%
- DSCR
- 1.49
- GRM
- 7.6
CMA / ARV
- ARV (median comp)
- $179,774
- List price
- $169,000
- Delta
- -5.99%
- Verdict
- FAIR
- Comps
- 20 within 1.0 mi
Show comp detail 12 sales within ~0.75 mi
| Address | Dist | Beds/Ba | Sqft | Sold | Price | $/sf | Match |
|---|---|---|---|---|---|---|---|
| 1414 12th St St | 0.30mi | 3/2.0 | 1,973 (-5%) | 9mo | $74,000 | $38 | 70 |
| 1721 11th St | 0.21mi | 3/2.0 | 1,856 (-11%) | 11mo | $105,000 | $57 | 63 |
| 1311 11th St | 0.28mi | 3/2.0 | 1,911 (-8%) | 12mo | $216,000 | $113 | 63 |
| 1611 9th St | 0.04mi | 3/2.0 | 1,872 (-10%) | 23mo | $93,000 | $50 | 62 |
| 2016 10th St St | 0.38mi | 4/2.0 (+1) | 1,900 (-9%) | 6mo | $159,900 | $84 | 58 |
| 1102 9th St | 0.43mi | 3/3.0 | 2,248 (+8%) | 11mo | $283,400 | $126 | 53 |
| 903 14th St | 0.71mi | 3/2.0 | 1,850 (-11%) | 1mo | $43,500 | $24 | 47 |
| 824 Cleveland St | 0.73mi | 3/2.0 | 1,789 (-14%) | 1mo | $150,000 | $84 | 42 |
| 1002 Iris St | 0.72mi | 3/3.0 | 2,197 (+5%) | 20mo | $345,000 | $157 | 37 |
| 1208 Louisiana Ave | 0.62mi | 3/2.0 | 1,800 (-14%) | 17mo | $279,900 | $156 | 35 |
| 1405 Kirkman St | 0.73mi | 4/3.5 (+1) | 2,365 (+14%) | 3mo | $290,000 | $123 | 30 |
| 711 7th St | 0.74mi | 3/2.0 | 1,778 (-15%) | 23mo | $209,300 | $118 | 22 |
Match score weights: distance 35% · size 25% · config 20% · recency 20%. Top-matched comps best support the ARV.
Projected returns pro-forma
-3.0% appreciation · 6.18% rent growth · sell at horizon
- IRR
- -0.8%
- Equity multiple
- 0.97×
- Total profit
- $-1,507
- Equity at exit
- $25,198
- IRR
- 11.9%
- Equity multiple
- 2.08×
- Total profit
- $50,929
- Equity at exit
- $14,612
Cash invested: $47,320 (down + closing). Projections, not guarantees.
Landlord ↔ Tenant lean methodology
- Overall (STATE)
- 90 Strongly Landlord-Friendly
- State Louisiana
- 90 Strongly Landlord-Friendly · R+12
- County
- — inherits STATE
- City
- — inherits STATE
ZIP-level market 70601
- Rents YoY
- 6.2%
- Active inventory
- 363
- Price-to-rent
- 7.6×
Monthly cashflow live
- Estimated rent
- $1,848 high interval (Pro) →
- Mortgage (P&I)
- −$886
- Tax from tax record
- −$68 /mo · $815/yr
- Insurance
- −$70
- Flood insurance flood zone
- −$125 /mo · $1,502/yr
- HOA
- −$0
- Vacancy / Maint / Mgmt
- −$388
- Net cashflow
- $310
Break-even live
UW: 25.0% down · 7.5% · 30yr · 1.5% tax · 5.0% vac · 8.0% maint · 8.0% mgmt
Financing live
Cash to close
- Down payment
- $42,250
- Closing costs
- $5,070
- Reserves months
- —
- Total cash needed
- —
Loan-product check · same deal, 3 products live
Conventional
25% down · 7.5% · 30yr
- Down + closing
- —
- Monthly P&I
- —
- Monthly cashflow
- —
- DSCR
- —
- Eligible?
- —
Personal DTI + credit; lowest rate.
DSCR
20% down · 8.5% · 30yr
- Down + closing
- —
- Monthly P&I
- —
- Monthly cashflow
- —
- DSCR
- —
- Eligible?
- —
No personal income docs; deal must DSCR.
Hard money
10% down · 12.0% · 12mo
- Down + closing
- —
- Monthly P&I
- —
- Monthly cashflow
- —
- DSCR
- —
- Eligible?
- —
Short-term bridge; refi at stabilization.
Rent comps 5 comps
| Address | Beds | Baths | Sqft | Rent | $/sqft | DOM | Units | Dist |
|---|---|---|---|---|---|---|---|---|
| 2002 13th St Lake Charles, LA | 4.0 | 2.0 | 1560 | $1,700 | $1.09 | 21d | 1 | 0.55mi |
| 1710 Granger St Lake Charles, LA | 3.0 | 2.5 | 1450 | $1,900 | $1.31 | 43d | 1 | 1.13mi |
| 3206 Louisiana Ave Lake Charles, LA | 4.0 | 2.0 | 1600 | $1,600 | $1.00 | 13d | 1 | 1.29mi |
| 1731 Elms St Lake Charles, LA | 3.0 | 2.0 | 1575 | $2,000 | $1.27 | 43d | 1 | 1.35mi |
| 1812 Ethel St Lake Charles, LA | 3.0 | 2.0 | 1589 | $3,850 | $2.42 | 43d | 1 | 1.48mi |
Listing history 14 events
-
2026-06-15statusdays on market $169,000 Pending 62 DOM
-
2026-06-14days on market $169,000 Active 61 DOM
-
2026-06-13days on market $169,000 Active 60 DOM
-
2026-06-10days on market $169,000 Active 58 DOM
-
2026-06-09days on market $169,000 Active 57 DOM
-
2026-06-08days on market $169,000 Active 56 DOM
-
2026-06-07days on market $169,000 Active 55 DOM
-
2026-06-05days on market $169,000 Active 52 DOM
-
2026-06-02days on market $169,000 Active 50 DOM
-
2026-06-01days on market $169,000 Active 49 DOM
-
2026-05-31days on market $169,000 Active 48 DOM
-
2026-05-30days on market $169,000 Active 47 DOM
-
2026-04-13$169,000 Active 1097-char remark
Show marketing remark (1097 chars)
Welcome to this beautifully remodeled 3-bedroom, 2-bath home in Lake Charles, where modern updates meet timeless character. Thoughtfully renovated from top to bottom, this home offers a fresh, move-in-ready feel while still showcasing original touches that bring warmth and personality. Inside, you’ll find an inviting layout designed for comfortable everyday living, complemented by energy-efficient double-pane windows that fill the home with natural light. Every space has been refreshed with care, creating a seamless blend of style and functionality. Step outside to your own private retreat—a spacious 19' x 15' back patio, perfect for entertaining or unwinding beneath the shade of mature oak trees that add both beauty and tranquility to the setting. Need extra storage? The 9'4" x 10'4" shed, conveniently attached to the carport, provides the perfect solution. Located in a convenient Lake Charles setting, this home delivers the rare combination of modern upgrades, classic charm, and practical features—all in one package. All measurements are more or less.
-
1993-11-22soldstatus $45,500
ⓘ Source: listings_history table (triggers on properties + properties_extension) + one-shot
backfill from property_details.listing_events for pre-trigger history.
Tax reassessment forecast LA · Resets to sale price
- Current annual tax
- $815 · $68/mo
- Projected year-2 tax
- $930 · $77/mo
- Expected delta
- +$114/yr (+$10/mo · 14.0%)
ⓘ Screening estimate from a state-policy table — verify with the county assessor before closing.
Climate risk First Street
- Flood 6/10 Major FEMA zone A · 72% chance over 30 yrs
- Wildfire 1/10 Low
- Heat 9/10 Extreme 7 d/yr ≥109°F today · 20 d/yr by 30 yrs out
- Wind 9/10 Extreme 99% chance of damaging wind over 30 yrs
- Air quality 2/10 Low 1 unhealthy d/yr today · 1 by 30 yrs out
Nearby sold comps map
Loading sold comps map…
Walkable amenities ~0.75 mi
Loading nearby amenities…
Taxation est. · year 1
- Rental income
- $22,178
- − Mortgage interest
- −$9,467
- − Property taxes
- −$815
- − Insurance
- −$2,348
- − Repairs & maintenance
- −$1,774
- − Management
- −$1,774
- − Depreciation
- −$4,916
- Taxable income
- $1,084
- Est. tax owed @ 24.0%
- −$260
- After-tax cash flow
- $3,463/yr
For passive investors: Depreciation is non-cash, so a rental often shows a tax loss while cash-flowing — sheltering income. Rental losses are passive: they offset passive income freely, and up to $25,000/yr can offset ordinary (W-2) income if you actively participate and your MAGI is under $100k (phasing out to $0 by $150k); unused losses carry forward. On sale, claimed depreciation is recaptured at up to 25%, and gains may owe capital-gains tax (a 1031 exchange can defer both). Figures are a year-1 estimate at your 24.0% rate — not tax advice; consult a CPA.
Schools (NCES district)
- District
- Calcasieu Parish
- NCES district ID
- 2200330
- Math proficiency
- 30% ▼ -39.00%
- Reading proficiency
- 44% ▼ -33.00%
- Median HH income
- $44,700
- Composite
- 31.45/100
- National rank
- #5979
- State rank
- #29 of 98 in LA
Livability — Lake Charles
- Score
- 68/100
- State rank
- #95
- US rank
- #9820
Category grades
Schools grade is shown separately in the Schools card above.
Census & demographics
- Census place
- Lake Charles, LA
- County
- Calcasieu Parish · 170,889 people
- City population
- 133,538
- Metro
- Lake Charles, LA
- Population (ZIP)
- 30,872
- Household income
- $49,992
- Rent vs Own
- Severe rent burden
- 1304.0
Population outlook (Calcasieu County) Hauer SSP2
- Today (2025)
- 212,179 people
- By 2030
- 218,199 · +2.8%
- By 2040
- 228,486 · +7.7%
- By 2050
- 236,208 · +11.3%
- By 2075
- 251,696 · +18.6%
- By 2100
- 247,848 · +16.8%
Race, ethnicity, and origin ACS 2023
- Neighborhood character
- Diverse neighborhood (Simpson 0.55)
- Race & ethnicity
- Black 59% White 31% Two or more races 7% Hispanic / Latino 5%
- Common ancestry
- Lithuanian 7% Iranian 1% Serbian 1%
- Foreign-born
- 3% · Canada
- Languages at home
- 95% English-only · Spanish 2% French/Haitian/Cajun 1%
Political lean MEDSL · Calcasieu
- 2024 margin
- Solid R (+39.6) · D 29.5% · R 69.0% · Other 1.5%
- 2008→2024 swing
- -15.0pp toward R · 2008: -24.6pp · 2024: -39.6pp
- All cycles
- 2024: R+39.6 2020: R+35.2 2016: R+33.3 2012: R+28.7 2008: R+24.6
Not yet ingested
- Civics
- —
Market trends
- HPI YoY
- ▼ -109.32%
- Current HPI
- 55.6127
- Rent YoY
- ▲ 6.18%
- Metro
- Lake Charles, LA
- State GDP YoY
- ▲ 3.29%
- F500 in state
- 10
Industry mix (Fortune 500 HQ in LA)
| Industry | F500 HQs | Revenue |
|---|---|---|
| Telecommunications | 2 | $23B |
|
||
| Utilities | 1 | $12B |
|
||
| Wholesale / Distribution | 1 | $5B |
|
||
| Advertising | 1 | $2B |
|
||
Price history
+271.4% since first listed2 events — show timeline
- 2026-04-13 Listed $169,000 SWLAR
- 1993-11-22 Sold (Public Records) $45,500 Public Records
Property tax history
+0.6%/yrLatest (2025): $815 · +4.5% YoY. Source: county tax records.
Cash-flow waterfall
monthlySold comps — $/sqft
last 12 mo · ≤1 miLoading sold comps…