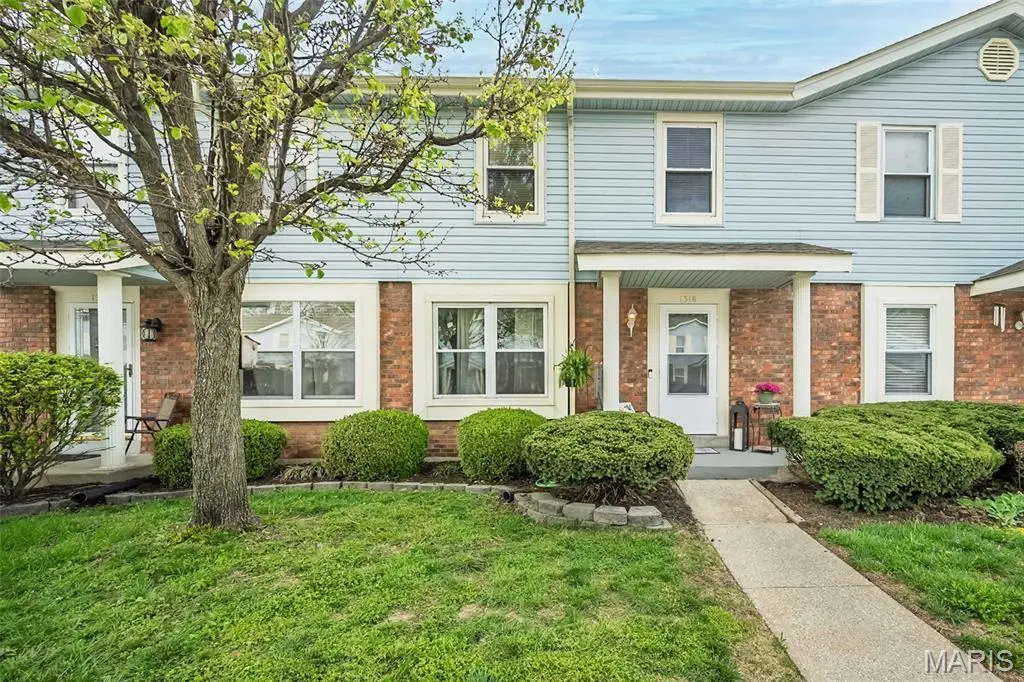
1318 Summergate Pkwy · St. Peters, MO
Flood risk 1/10 · Minimal
- FEMA flood zone
- X (unshaded)
- Chance of flooding over 30 yrs
- 0.0%
- Est. flood insurance / yr
- $507 – $1,088
Fire risk 1/10 · Minimal
- Est. fire insurance / yr
- $1,054 – $1,958
Heat risk 5/10 · Moderate
- Hot days now (above 108°F)
- 7 days/yr
- Hot days in 30 yrs
- 20 days/yr
Wind risk 2/10 · Minimal
- Chance of severe wind over 30 yrs
- 1.0%
Air-quality risk 2/10 · Minimal
- Unhealthy air days now
- 2 days/yr
- Unhealthy air days in 30 yrs
- 2 days/yr
Risk factors via First Street. Map © Google.
Why this score? — see what drove the D+ grade
The composite is a weighted blend of 9 inputs, each scored 0–100. Each bar is that input's sub-score; the figure is the points it added to the 100-point composite (weight × sub-score).
- Cash flow +13.1/30.0
- ARV discount +9.4/15.0
- Schools +5.2/10.0
- 1% rule +5.1/10.0
- DSCR +3.9/10.0
- Rent growth +3.3/5.0
- Livability +2.5/5.0
- Condition / age +2.5/5.0
- Appreciation +0.0/10.0
$200,000
🖨 Deal sheet (PDF) 📄 Offer letter ✓ Due diligence
Listing remarks
Why rent when you can own in Summergate? This cute 2-story townhome offers the kind of space, function, and low-maintenance living that just makes sense. The main floor features a comfortable living room, a generously sized dining area, and an open connection to the kitchen that keeps everyday living feeling easy and practical. You’ll also love the added convenience of main-floor laundry, a powder room for guests, and a sliding door off the kitchen that leads to your private deck—perfect for morning coffee, grilling out, or winding down at the end of the day! Upstairs, you’ll find 2 spacious bedrooms, a full hall bath, and the primary bedroom has two closets. Need more roo
Key facts
- $300 HOA
- Built 1983
- Listed 18 days
Property features AI
Finance
- Financial info: Lease not considered
- HOA & community: Part of the Summergate association; Monthly HOA fee (approximately $300); HOA covers grounds maintenance, parking/road maintenance, common area maintenance, exterior maintenance, snow removal, and trash; Association management
Exterior
- Parking: Asphalt assigned parking
- Utilities: Public water; Public sewer; Electricity connected
- Home design: Residential townhouse; Two levels; Above-grade finished area approximately 1,280 (per public records)
- Construction: Brick and vinyl siding exterior; Concrete perimeter foundation
- Exterior features: Deck; Level lot
Interior
- Kitchen: Dishwasher; Disposal; Electric oven
- Bedrooms: 2 bedrooms (both on the upper level)
- Flooring: Carpet
- Bathrooms: 1 full bath; 1 half bath
- Heating & cooling: Electric forced-air heating; Central electric air conditioning
- Interior features: Ceiling fans; Eat-in kitchen; Kitchen/dining room combo
- Laundry & utility: Main-level laundry; Water heater
Neighborhood map
What this means for you Summary
Snapshot
- This is a 2-bed/1.5-bath townhouse listed at $200k.
Deal economics
- At list price, monthly cash flow is $-7 ($-90/yr) — negative.
- To cash-flow at today's rent, offer at most $199k (0.7% below list).
- Meets the 1% rule at list price ($2k rent vs $200k).
- Recommended offer: $197k (1.5% below list) — sets the bar for market timing.
- Cap rate 6.2% vs local median 4.2% in St. Peters — top-decile yield for the area; either an underpriced asset or a hidden risk that comps aren't pricing in. Stress-test before assuming the spread holds.
Location & tenants
- Location reads: area grade D — affects rentability + tenant quality, not the cash-flow math above.
- Francis Howell R-III (suburban): math 53% / reading 63% proficiency, ranked #11 of 324 in MO (top 3%) — acceptable for families but not a draw, mixed tenant base, ~2y average lease; only 15% free/reduced lunch — higher-income household profile.
- Zoned schools: Becky-David Elem. (math 62% / reading 71%, grade B+, #57 of 1,115 statewide, top 5%, 849 students, 13% FRL); Hollenbeck Middle (math 56% / reading 55%, grade B-, #42 of 391 statewide, top 11%, 753 students, 26% FRL); Francis Howell North High (math 40% / reading 55%, grade D, #154 of 521 statewide, top 29%, 1,679 students, 19% FRL) — zoned schools at 19% FRL track the district average.
- Market conditions: Rents rising (+3.3%/yr); 202 active listings in the ZIP; 10 comparable units currently listed for rent nearby; rentals leasing fast (median 13d on market — plan ~1-2 weeks tenant-placement turnaround); solid renter incomes; 2,021 units permitted in St. Charles County in 2024 (568 in 5+ unit buildings).
Forward outlook
- Local home prices are declining (-3.0%/yr); year-one equity from $1k of loan paydown is wiped out by about $6k of value loss. Plan a longer hold.
- St. Charles County population projected at +22% by 2050 — long-run rental-demand tailwind backs the buy-and-hold thesis.
Negotiation context
- It's been on market 18 days — a 2% lower offer ($197k) is reasonable based on typical stale-listing flexibility.
- 2 sale attempts with the ask held roughly flat each time — persistent listings suggest the price (not the market) is what's stuck; bring a comps-based counter.
- Current owner paid $120k; list at $200k implies a 67% gain — meaningful room to come down on a strong offer.
Risks & watch-outs
- Climate carrying-cost: extreme-heat days projected 7→20/yr by 2055 (HVAC capex compounding) — expect insurance premiums to compound above CPI over the hold.
Questions for the listing agent
- What do current leases actually rent for vs. the listed asking? Can we see a recent rent roll and the last 12 months of T-12 income?
- What does the HOA fee cover, when was the last increase, and are there any pending special assessments or reserve-fund shortfalls?
- Is there a deadline driving the sale (1031 exchange, divorce, estate, relocation)? That informs how much negotiation room exists.
- The area grade is low — what's the realistic commute time and amenity access for the typical tenant pool here? Any planned neighborhood developments (good or bad) we should know about?
- What's the average days-on-market for RENTAL listings here right now (not sales)? A rising rental-DOM trend means longer vacancies and softer asking-rent achievability than the comps imply.
- What's the recent tenant-quality profile in this submarket — average credit score on applications, eviction rate, late-payment / NSF rate, and stable-employment percentage? A property-management company in the area should have these aggregated.
- How much new for-sale + rental construction is in the pipeline within 1–3 miles? Heavy new supply typically softens prices + rents 12–24 months out; constrained supply supports both.
Investment metrics
- 1% rule
- 1.01% ✓
- Cap rate
- 6.25%
- Cash-on-cash
- -0.16%
- DSCR
- 0.99
- GRM
- 8.2
CMA / ARV
- ARV (on-the-fly)
- $208,640
- Comps found
- 12
Show comp detail 12 sales within ~0.75 mi
| Address | Dist | Beds/Ba | Sqft | Sold | Price | $/sf | Match |
|---|---|---|---|---|---|---|---|
| 1318 Summergate Pkwy | 0.00mi | 2/1.5 | 1,280 (0%) | 1mo | $200,000 | $156 | 99 |
| 1329 Summergate Pkwy | 0.04mi | 2/1.5 | 1,280 (0%) | 9mo | $215,000 | $168 | 91 |
| 1325 Summergate Pkwy | 0.03mi | 2/1.5 | 1,280 (0%) | 13mo | $209,000 | $163 | 88 |
| 1357 Summergate Parkway Pkwy | 0.06mi | 2/1.5 | 1,280 (0%) | 15mo | $179,500 | $140 | 85 |
| 1371 Summergate Pkwy | 0.05mi | 2/1.5 | 1,280 (0%) | 17mo | $189,900 | $148 | 83 |
| 1505 Summergate Pkwy | 0.09mi | 2/1.5 | 1,200 (-6%) | 14mo | $195,000 | $163 | 74 |
| 748 Sugar Glen Dr #2 | 0.74mi | 2/2.0 | 1,316 (+3%) | 8mo | $190,000 | $144 | 52 |
| 32 Loris Ln | 0.29mi | 3/2.5 (+1) | 1,456 (+14%) | 10mo | $265,000 | $182 | 46 |
| 104 Sugar Bend Ct #4 | 0.75mi | 2/1.0 | 1,196 (-7%) | 10mo | $172,500 | $144 | 44 |
| 51 Meadow Run Ct #3 | 0.74mi | 3/2.0 (+1) | 1,176 (-8%) | 5mo | $249,900 | $213 | 41 |
| 63 Meadow Run Ct #1 | 0.72mi | 3/2.0 (+1) | 1,176 (-8%) | 11mo | $255,000 | $217 | 37 |
| 72 Sugar Glen Ct #1 | 0.69mi | 2/2.0 | 1,460 (+14%) | 12mo | $187,500 | $128 | 32 |
Match score weights: distance 35% · size 25% · config 20% · recency 20%. Top-matched comps best support the ARV.
Projected returns pro-forma
-3.0% appreciation · 3.27% rent growth · sell at horizon
- IRR
- -16.1%
- Equity multiple
- 0.43×
- Total profit
- $-32,168
- Equity at exit
- $29,821
- IRR
- -7.1%
- Equity multiple
- 0.54×
- Total profit
- $-25,677
- Equity at exit
- $17,292
Cash invested: $56,000 (down + closing). Projections, not guarantees.
Landlord ↔ Tenant lean methodology
- Overall (STATE)
- 81 Strongly Landlord-Friendly
- State Missouri
- 81 Strongly Landlord-Friendly · R+10
- County
- — inherits STATE
- City
- — inherits STATE
ZIP-level market 63303
- Rents YoY
- 3.3%
- Active inventory
- 202
- Price-to-rent
- 8.2×
Monthly cashflow live
- Estimated rent
- $2,021 high interval (Pro) →
- Mortgage (P&I)
- −$1,049
- Tax from tax record
- −$172 /mo · $2,062/yr
- Insurance
- −$83
- HOA
- −$300
- Vacancy / Maint / Mgmt
- −$424
- Net cashflow
- $-7
Break-even live
Sensitivity live
| Price | -10% $106 | -5% $49 | +0% $-7 | +5% $-64 | +10% $-121 |
|---|---|---|---|---|---|
| Rent | -10% $-167 | -5% $-87 | +0% $-7 | +5% $72 | +10% $152 |
| Rate | -1.0pp $93 | -0.5pp $43 | base $-7 | +0.5pp $-59 | +1.0pp $-112 |
UW: 25.0% down · 7.5% · 30yr · 1.5% tax · 5.0% vac · 8.0% maint · 8.0% mgmt
Financing live
Cash to close
- Down payment
- $50,000
- Closing costs
- $6,000
- Reserves months
- —
- Total cash needed
- —
Loan-product check · same deal, 3 products live
Conventional
25% down · 7.5% · 30yr
- Down + closing
- —
- Monthly P&I
- —
- Monthly cashflow
- —
- DSCR
- —
- Eligible?
- —
Personal DTI + credit; lowest rate.
DSCR
20% down · 8.5% · 30yr
- Down + closing
- —
- Monthly P&I
- —
- Monthly cashflow
- —
- DSCR
- —
- Eligible?
- —
No personal income docs; deal must DSCR.
Hard money
10% down · 12.0% · 12mo
- Down + closing
- —
- Monthly P&I
- —
- Monthly cashflow
- —
- DSCR
- —
- Eligible?
- —
Short-term bridge; refi at stabilization.
Rent comps 10 comps
| Address | Beds | Baths | Sqft | Rent | $/sqft | DOM | Units | Dist |
|---|---|---|---|---|---|---|---|---|
| 145 Sesame Loop Unit 1 St Charles, MO | 3.0 | 2.5 | 1869 | $2,450 | $1.31 | 9d | 1 | 0.32mi |
| 531 Saravalle Dr Saint Peters, MO | 2.0 | 2.0 | 1012 | $1,650 | $1.63 | 45d | 1 | 0.76mi |
| 1321 Forest Creek Dr St Peters, MO | 2.0 | 1.0 | 1359 | $2,000 | $1.47 | 45d | 1 | 0.79mi |
| 3515 Ridgewood Dr Saint Charles, MO | 3.0 | 2.5 | 1677 | $2,535 | $1.51 | 6d | 1 | 0.90mi |
| 1000 Jasper Ln St Peters, MO | 1.0–3.0 | 1.0–2.0 | 1047 | $2,000 | $1.91 | 3d | 12 | 0.92mi |
| 206 Waterside Crossing Ct Saint Peters, MO | 2.0 | 2.0 | 1256 | $2,100 | $1.67 | 12d | 1 | 0.93mi |
| 100 Broadridge Dr St Peters, MO | 1.0–2.0 | 1.0–2.0 | 845 | $1,648 | $1.95 | 3d | 10 | 0.97mi |
| 3039 Plum Creek Dr Saint Peters, MO | 3.0 | 2.0 | 1300 | $2,180 | $1.68 | 23d | 1 | 0.98mi |
| 2970 Aintree Dr Saint Charles, MO | 3.0 | 2.0 | 1318 | $2,380 | $1.81 | 45d | 1 | 1.15mi |
| 3891 Cambridge Crossing Dr Saint Charles, MO | 3.0 | 2.0 | 1509 | $2,396 | $1.59 | 5d | 1 | 1.41mi |
HOA detail
- Monthly dues
- $300 · $3,600/yr
Listing history 12 events
-
2026-04-27status Pending
-
2026-04-10$200,000 Active
-
2026-04-09historical $200,000
-
2025-10-20price $199,900
-
2025-10-06price $204,900
-
2025-09-26$209,900 Active
-
2019-08-23soldstatus $120,000
-
2006-08-16soldstatus $125,000
-
2003-07-10soldstatus $96,000
-
1999-04-07soldstatus $62,300
-
1996-12-01soldstatus $51,000
-
1984-11-01soldstatus
ⓘ Source: listings_history table (triggers on properties + properties_extension) + one-shot
backfill from property_details.listing_events for pre-trigger history.
Tax reassessment forecast MO · Resets to sale price
- Current annual tax
- $2,062 · $172/mo
- Projected year-2 tax
- $2,062 · $172/mo
- Expected delta
- $0/yr ($0/mo · 0.0%)
ⓘ Screening estimate from a state-policy table — verify with the county assessor before closing.
Climate risk First Street
- Flood 1/10 Low FEMA zone X (unshaded) · 0% chance over 30 yrs
- Wildfire 1/10 Low
- Heat 5/10 Major 7 d/yr ≥108°F today · 20 d/yr by 30 yrs out
- Wind 2/10 Low 100% chance of damaging wind over 30 yrs
- Air quality 2/10 Low 2 unhealthy d/yr today · 2 by 30 yrs out
Nearby sold comps map
Loading sold comps map…
Walkable amenities ~0.75 mi
Loading nearby amenities…
Taxation est. · year 1
- Rental income
- $24,251
- − Mortgage interest
- −$11,203
- − Property taxes
- −$2,062
- − Insurance
- −$1,000
- − Repairs & maintenance
- −$1,940
- − Management
- −$1,940
- − HOA
- −$3,600
- − Depreciation
- −$5,818
- Taxable loss
- −$3,313
- Est. tax savings @ 24.0%
- +$795
- After-tax cash flow
- $705/yr
For passive investors: Depreciation is non-cash, so a rental often shows a tax loss while cash-flowing — sheltering income. Rental losses are passive: they offset passive income freely, and up to $25,000/yr can offset ordinary (W-2) income if you actively participate and your MAGI is under $100k (phasing out to $0 by $150k); unused losses carry forward. On sale, claimed depreciation is recaptured at up to 25%, and gains may owe capital-gains tax (a 1031 exchange can defer both). Figures are a year-1 estimate at your 24.0% rate — not tax advice; consult a CPA.
Schools (NCES district)
- District
- Francis Howell R-III
- NCES district ID
- 2928950
- Math proficiency
- 53% ▼ -12.00%
- Reading proficiency
- 63% ▼ -5.00%
- Median HH income
- $79,768
- Composite
- 52.23/100
- National rank
- #1602
- State rank
- #11 of 324 in MO
Livability — St. Peters
No livability data for this city. (Only ~50 U.S. cities are tracked.)
Census & demographics
- County
- Saint Charles County · 399,703 people
- City population
- 74,876
- Metro
- St. Louis, MO-IL
- Population (ZIP)
- 46,089
- Household income
- $99,138
- Rent vs Own
- Severe rent burden
- 1026.0
Population outlook (St. Charles County) Hauer SSP2
- Today (2025)
- 437,857 people
- By 2030
- 461,707 · +5.4%
- By 2040
- 503,222 · +14.9%
- By 2050
- 534,684 · +22.1%
- By 2075
- 597,047 · +36.4%
- By 2100
- 609,682 · +39.2%
Race, ethnicity, and origin ACS 2023
- Neighborhood character
- Predominantly White (79%)
- Race & ethnicity
- White 79% Black 6% Asian 6% Two or more races 6% Hispanic / Latino 5%
- Common ancestry
- Lithuanian 3% Romanian 3% Slovak 2%
- Foreign-born
- 7% · Canada, China, South Korea
- Languages at home
- 91% English-only · Spanish 3% Other Indo-European 1% Other Asian/Pacific 1%
Political lean MEDSL · St. Charles
- 2024 margin
- R (+17.0) · D 40.8% · R 57.8% · Other 1.4%
- 2008→2024 swing
- -7.2pp toward R · 2008: -9.7pp · 2024: -17.0pp
- All cycles
- 2024: R+17.0 2020: R+17.5 2016: R+26.4 2012: R+21.0 2008: R+9.7
Not yet ingested
- Civics
- —
Market trends
- HPI YoY
- ▼ -260.84%
- Current HPI
- 224.7406
- Rent YoY
- ▲ 3.27%
- Metro
- St. Louis, MO-IL
- State GDP YoY
- ▲ 1.84%
- F500 in state
- 20
Industry mix (Fortune 500 HQ in MO)
| Industry | F500 HQs | Revenue |
|---|---|---|
| Healthcare | 1 | $163B |
|
||
| Insurance | 1 | $21B |
|
||
| Industrial Technology | 1 | $17B |
|
||
| Retail | 1 | $16B |
|
||
| Industrial Distribution | 1 | $10B |
|
||
| Utilities | 1 | $9B |
|
||
Price history
+292.2% since first listed12 events — show timeline
- 2026-04-27 Pending — MARIS as Distributed by MLS Grid
- 2026-04-10 Listed $200,000 MARIS as Distributed by MLS Grid
- 2026-04-09 Coming Soon $200,000 MARIS as Distributed by MLS Grid
- 2025-10-20 Price Changed $199,900 MARIS as Distributed by MLS Grid
- 2025-10-06 Price Changed $204,900 MARIS as Distributed by MLS Grid
- 2025-09-26 Listed $209,900 MARIS as Distributed by MLS Grid
- 2019-08-23 Sold (Public Records) $120,000 Public Records
- 2006-08-16 Sold (Public Records) $125,000 Public Records
- 2003-07-10 Sold (Public Records) $96,000 Public Records
- 1999-04-07 Sold (Public Records) $62,300 Public Records
- 1996-12-01 Sold (Public Records) $51,000 Public Records
- 1984-11-01 Sold (Public Records) — Public Records
Property tax history
+5.3%/yrLatest (2025): $2,062 · +3.0% YoY. Source: county tax records.
Cash-flow waterfall
monthlySold comps — $/sqft
last 12 mo · ≤1 miLoading sold comps…