211 E 13th St Unit 6-D · New York, NY
Flood risk 1/10 · Minimal
- FEMA flood zone
- X (unshaded)
- Chance of flooding over 30 yrs
- 0.0%
- Est. flood insurance / yr
- $507 – $1,088
Fire risk 1/10 · Minimal
- Est. fire insurance / yr
- $691 – $1,283
Heat risk 7/10 · Major
- Hot days now (above 99°F)
- 7 days/yr
- Hot days in 30 yrs
- 15 days/yr
Wind risk 6/10 · Moderate
- Chance of severe wind over 30 yrs
- 27.0%
Air-quality risk 4/10 · Minor
- Unhealthy air days now
- 5 days/yr
- Unhealthy air days in 30 yrs
- 7 days/yr
Risk factors via First Street. Map © Google.
Why this score? — see what drove the D grade
The composite is a weighted blend of 9 inputs, each scored 0–100. Each bar is that input's sub-score; the figure is the points it added to the 100-point composite (weight × sub-score).
- Appreciation +9.7/10.0
- ARV discount +7.5/15.0
- Cash flow +5.9/30.0
- Schools +5.0/10.0
- Rent growth +4.8/5.0
- Livability +3.8/5.0
- Condition / age +2.5/5.0
- 1% rule +1.8/10.0
- DSCR +0.2/10.0
$1,100,000
🖨 Deal sheet (PDF) 📄 Offer letter ✓ Due diligence
Listing remarks
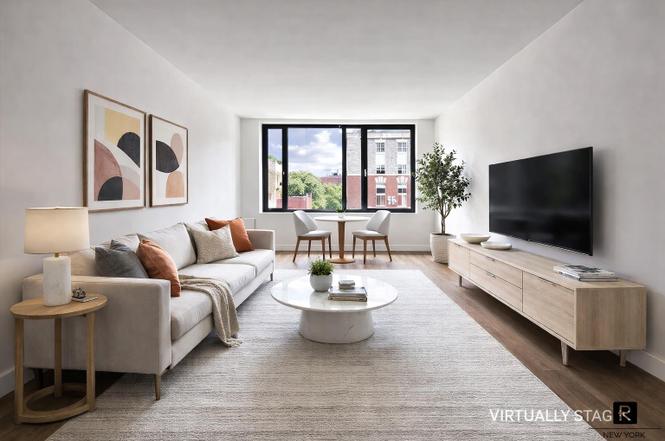
Residence 6D at 211 East 13th Street is a stylish Manhattan sanctuary in the heart of downtown, enhanced by sunny southern exposure and beautiful natural light throughout the day. This chic alcove studio / junior one-bedroom offers a thoughtfully balanced layout, high ceilings, and a distinct sleeping area while maintaining an open, airy feel. Sunlight pours into the home, highlighting its inviting proportions and creating a warm and bright atmosphere. Thoughtfully designed for both comfort and convenience, equipped with high end appliances - Subzero and Wolf, garbage disposal, along with convenience of in-unit washer dryer, and a spa-like bath with a deep soaking tub. The apartment’s
Key facts
- 9'2 ceilings
- Oversized windows
- $947 HOA
Tags
Property features AI
Finance
- HOA & community: Monthly association fee of $947; Pets allowed in the building
Exterior
- Home design: Condominium/co-op in an 8-story building; Unit entry level: 6; South-facing
- Exterior features: Building storage; Building roof deck
Interior
- Bedrooms: 2 total rooms (includes bedrooms and living spaces)
- Bathrooms: 1 full bathroom
- Heating & cooling: Central air
- Interior features: Central air conditioning; South-facing exposure
- Laundry & utility: In-unit washer and dryer; Building allows washer/dryer installation
Neighborhood map
What this means for you Summary
Snapshot
- This is a 1-bed/1.0-bath condo listed at $1.10M.
Deal economics
- At list price, monthly cash flow is $-2k ($-26k/yr) — negative.
- To cash-flow at today's rent, offer at most $717k (34.9% below list).
- To meet the 1% rule (rent ≥ 1% of price), the offer needs to be $753k (31.6% below list).
- Recommended offer: $717k (34.9% below list) — sets the bar for cash-flow.
- Cap rate 3.9% vs local median 2.6% in New York — top-decile yield for the area; either an underpriced asset or a hidden risk that comps aren't pricing in. Stress-test before assuming the spread holds.
Location & tenants
- Location reads 75/100 on livability (#268 in NY, #4,188 nationally) — a middle-class / working-renter tenant base. Strengths: amenities A+, commute A+, health & safety A; Watch: crime F, cost of living F.
- Zoned schools: Elm Tree Elementary School (math 27% / reading 52%, grade F, #1,444 of 2,108 statewide, top 71%, 806 students, 94% FRL); Mark Twain Is 239 For The Gifted And Talented (math 90% / reading 96%, grade A+, #6 of 729 statewide, top 1%, 1,207 students, 44% FRL); Midwood High School (math 94% / reading 96%, grade A+, #83 of 1,100 statewide, top 8%, 4,062 students, 73% FRL).
- Market conditions: Rents rising fast (+9.2%/yr); 365 active listings in the ZIP; 40 comparable units currently listed for rent nearby; rentals leasing fast (median 8d on market — plan ~1-2 weeks tenant-placement turnaround); high-income renter base; 4,467 units permitted in New York County in 2024 (4,463 in 5+ unit buildings).
- At $7,529/mo this rent would consume 59% of the median local household income ($154k/yr) (locally 3480% of renters already pay >50% of income on rent) — very limited rent-growth headroom before tenants either downsize or default.
Forward outlook
- In year one you build about $110k of equity ($8k loan paydown + $103k appreciation (9.3% local appreciation)).
- New York County population projected at +21% by 2050 — long-run rental-demand tailwind backs the buy-and-hold thesis.
- By year 2, paydown + projected appreciation supports a ~$177k cash-out refi (75% LTV) — recoverable capital for the next deal without selling this one.
Negotiation context
- It's been on market 279 days — a 12% lower offer ($968k) is reasonable based on typical stale-listing flexibility.
- 2 sale attempts with the ask held roughly flat each time — persistent listings suggest the price (not the market) is what's stuck; bring a comps-based counter.
- Current owner paid $908k; 21% above their basis — modest negotiation headroom, anchor on the comps not their cost.
Risks & watch-outs
- Climate carrying-cost: major wind risk, 27% chance of damaging wind over 30y; extreme-heat days projected 7→15/yr by 2055 (HVAC capex compounding) — expect insurance premiums to compound above CPI over the hold.
Questions for the listing agent
- What do current leases actually rent for vs. the listed asking? Can we see a recent rent roll and the last 12 months of T-12 income?
- It's been on market 279 days. Have you received any prior offers? Is the seller open to a 35% concession, seller financing, or rate buy-down credit?
- What does the HOA fee cover, when was the last increase, and are there any pending special assessments or reserve-fund shortfalls?
- Any open or pending special assessments — roof, HVAC, plumbing, elevator, façade? What's the per-unit balance and payoff schedule, and is the seller paying it off at close or rolling it to the buyer?
- Why hasn't it sold? Are there any deal-killer items the seller is aware of (foundation, flood, title, zoning, code violations)?
- Is there a deadline driving the sale (1031 exchange, divorce, estate, relocation)? That informs how much negotiation room exists.
- Schools are B-rated — typically a magnet for longer-tenancy family renters. What's the average tenant stay here, and is there a school-zone premium baked into asking?
- Crime grade is F in this area — have there been break-ins, vandalism, or insurance claims at this property in the last 3 years? What carrier currently insures it and at what premium?
- The area grade is low — what's the realistic commute time and amenity access for the typical tenant pool here? Any planned neighborhood developments (good or bad) we should know about?
- What's the average days-on-market for RENTAL listings here right now (not sales)? A rising rental-DOM trend means longer vacancies and softer asking-rent achievability than the comps imply.
- What's the recent tenant-quality profile in this submarket — average credit score on applications, eviction rate, late-payment / NSF rate, and stable-employment percentage? A property-management company in the area should have these aggregated.
- How much new apartment / multifamily construction is in the pipeline within 1–3 miles? Heavy new supply (>2% of stock underway) typically softens rents 12–24 months out; light construction supports rent growth.
Investment metrics
- 1% rule
- 0.68% ✗
- Cap rate
- 3.92%
- Cash-on-cash
- -8.46%
- DSCR
- 0.62
- GRM
- 12.2
CMA / ARV
No comps found within radius.
Projected returns pro-forma
9.32% appreciation · 8.0% rent growth · sell at horizon
- IRR
- 18.2%
- Equity multiple
- 2.46×
- Total profit
- $450,116
- Equity at exit
- $936,773
- IRR
- 18.3%
- Equity multiple
- 5.94×
- Total profit
- $1,522,114
- Equity at exit
- $1,965,167
Cash invested: $308,000 (down + closing). Projections, not guarantees.
Landlord ↔ Tenant lean methodology
- Overall (CITY)
- 0 Strongly Tenant-Friendly
- State New York
- 15 Strongly Tenant-Friendly · D+10
- County
- — inherits STATE
- City New York
- 0 Strongly Tenant-Friendly · D+34
ZIP-level market 10003
- Home prices YoY
- 3.4%
- Rents YoY
- 9.2%
- Active inventory
- 365
- Price-to-rent
- 12.2×
Monthly cashflow live
- Estimated rent
- $7,529 high interval (Pro) →
- Mortgage (P&I)
- −$5,769
- Tax from tax record
- −$945 /mo · $11,341/yr
- Insurance
- −$458
- HOA
- −$947
- Vacancy / Maint / Mgmt
- −$1,581
- Net cashflow
- $-2,171
Break-even live
Sensitivity live
| Price | -10% $-1,548 | -5% $-1,859 | +0% $-2,171 | +5% $-2,482 | +10% $-2,793 |
|---|---|---|---|---|---|
| Rent | -10% $-2,766 | -5% $-2,468 | +0% $-2,171 | +5% $-1,873 | +10% $-1,576 |
| Rate | -1.0pp $-1,617 | -0.5pp $-1,891 | base $-2,171 | +0.5pp $-2,456 | +1.0pp $-2,746 |
UW: 25.0% down · 7.5% · 30yr · 1.5% tax · 5.0% vac · 8.0% maint · 8.0% mgmt
Financing live
Cash to close
- Down payment
- $275,000
- Closing costs
- $33,000
- Reserves months
- —
- Total cash needed
- —
Loan-product check · same deal, 3 products live
Conventional
25% down · 7.5% · 30yr
- Down + closing
- —
- Monthly P&I
- —
- Monthly cashflow
- —
- DSCR
- —
- Eligible?
- —
Personal DTI + credit; lowest rate.
DSCR
20% down · 8.5% · 30yr
- Down + closing
- —
- Monthly P&I
- —
- Monthly cashflow
- —
- DSCR
- —
- Eligible?
- —
No personal income docs; deal must DSCR.
Hard money
10% down · 12.0% · 12mo
- Down + closing
- —
- Monthly P&I
- —
- Monthly cashflow
- —
- DSCR
- —
- Eligible?
- —
Short-term bridge; refi at stabilization.
Rent comps 40 comps
| Address | Beds | Baths | Sqft | Rent | $/sqft | DOM | Units | Dist |
|---|---|---|---|---|---|---|---|---|
| 101 E 10th St #1153 New York, NY | 1.0–2.0 | 1.0–2.0 | 575 | $6,630 | $11.53 | 1d | 2 | 0.12mi |
| 112 E 10th St Unit 1021937P New York, NY | 1.0–3.0 | 1.0–2.5 | 1296 | $5,772 | $4.45 | 5d | 2 | 0.14mi |
| 209 1st Ave Unit 1370708P New York, NY | 1.0 | 1.0 | 602 | $12,000 | $19.93 | 26d | 1 | 0.21mi |
| 1 Union Sq S #1174 New York, NY | 2.0 | 1.0–2.0 | 775 | $10,120 | $13.06 | 12d | 3 | 0.22mi |
| 815 Broadway #204 New York, NY | 1.0 | 1.0 | 522 | $8,250 | $15.80 | 9d | 1 | 0.25mi |
| 346 E 18th St Unit 1254596P New York, NY | 2.0 | 2.0 | 699 | $12,979 | $18.57 | 23d | 1 | 0.32mi |
| 93 1/2 E 7th St Unit 1054297P New York, NY | 2.0 | 1.0 | 495 | $10,000 | $20.20 | 23d | 1 | 0.36mi |
| 250 E 21st St Unit 8D New York, NY | 1.0 | 1.0 | 688 | $9,525 | $13.84 | 4d | 1 | 0.41mi |
| 290 3rd Ave #279 New York, NY | 1.0 | 1.0 | 607 | $9,740 | $16.03 | 5d | 2 | 0.49mi |
| 11 E 1st St New York, NY | 2.0 | 1.0–2.0 | 1060 | $8,052 | $7.60 | 0d | 1 | 0.58mi |
| 229 Chrystie St New York, NY | 1.0–2.0 | 1.0–2.0 | 810 | $6,120 | $7.56 | 6d | 3 | 0.64mi |
| 101 W 15th St New York, NY | 1.0 | 1.0 | 562 | $9,550 | $16.98 | 3d | 2 | 0.67mi |
| 108 W 15th St #205 New York, NY | 1.0–2.0 | 1.0 | 697 | $6,050 | $8.67 | 5d | 2 | 0.68mi |
| 364 6th Ave Unit 1023432P New York, NY | 1.0 | 1.0 | 441 | $9,135 | $20.71 | 23d | 1 | 0.69mi |
| 130 W 15th St #1383 New York, NY | 1.0–2.0 | 1.0–2.0 | 844 | $8,990 | $10.65 | 1d | 2 | 0.71mi |
| 171 Suffolk St #1265 New York, NY | 1.0–2.0 | 1.0 | 650 | $6,950 | $10.69 | 9d | 2 | 0.74mi |
| 104 MacDougal St Unit 1056263P New York, NY | 2.0 | 1.0 | 441 | $9,375 | $21.26 | 23d | 1 | 0.75mi |
| 177 Waverly Pl Unit 1075286P New York, NY | 1.0 | 1.0 | 452 | $10,000 | $22.12 | 26d | 1 | 0.76mi |
| 120 W 21st St New York, NY | 2.0 | 1.0–2.0 | 676 | $7,070 | $10.46 | 6d | 14 | 0.80mi |
| 20 Waterside Plz #978 New York, NY | 1.0 | 1.0 | 682 | $4,760 | $6.98 | 8d | 1 | 0.81mi |
| 30 Waterside Plz New York, NY | 2.0 | 1.0–2.0 | 743 | $5,245 | $7.06 | 0d | 35 | 0.84mi |
| 10 Downing St #131 New York, NY | 1.0 | 1.0 | 731 | $9,050 | $12.38 | 6d | 2 | 0.85mi |
| 180 W 20th St #1202 New York, NY | 2.0 | 1.0–2.0 | 791 | $9,465 | $11.96 | 1d | 3 | 0.85mi |
| 776 6th Ave New York, NY | 2.0 | 1.0–2.0 | 742 | $7,700 | $10.37 | 0d | 19 | 0.90mi |
| 43 W 27th St #1055 New York, NY | 2.0 | 1.0 | 740 | $9,940 | $13.43 | 26d | 1 | 0.92mi |
| 155 E 31st St #2190 New York, NY | 1.0–2.0 | 1.0–1.5 | 725 | $5,610 | $7.74 | 9d | 2 | 0.93mi |
| 52 Barrow St #2123 New York, NY | 1.0–2.0 | 1.0 | 547 | $6,420 | $11.73 | 12d | 3 | 0.93mi |
| 125 Delancey St #1523 New York, NY | 1.0–2.0 | 1.0–2.0 | 850 | $7,860 | $9.25 | 3d | 2 | 0.95mi |
| 160 W 24th St New York, NY | 2.0 | 1.0–2.0 | 731 | $7,896 | $10.79 | 0d | 13 | 0.96mi |
| 87 Perry St New York, NY | 2.0 | 2.0 | 748 | $18,500 | $24.73 | 26d | 1 | 0.96mi |
| 290 W 12th St #1592 New York, NY | 1.0–2.0 | 1.0–2.0 | 515 | $7,110 | $13.81 | 9d | 2 | 0.98mi |
| 120 Christopher St #1886 New York, NY | 1.0–2.0 | 1.0 | 574 | $5,640 | $9.82 | 1d | 3 | 0.98mi |
| 141 E 33rd St #1278 New York, NY | 2.0 | 1.0–1.5 | 683 | $6,230 | $9.12 | 9d | 3 | 1.02mi |
| 309 5th Ave New York, NY | 1.0 | 1.0 | 597 | $7,596 | $12.72 | 9d | 13 | 1.02mi |
| 535 Hudson St #1032 New York, NY | 1.0–2.0 | 1.0 | 550 | $6,030 | $10.96 | 9d | 2 | 1.03mi |
| 180 Broome St #1521 New York, NY | 1.0–2.0 | 1.0–2.0 | 850 | $7,970 | $9.38 | 3d | 2 | 1.03mi |
| 222 E 34th St #999 New York, NY | 1.0 | 1.0 | 554 | $5,490 | $9.91 | 8d | 1 | 1.04mi |
| 139 Christopher St Unit 1021914P New York, NY | 1.0–2.0 | 1.0 | 667 | $5,340 | $8.01 | 9d | 2 | 1.06mi |
| 399 E 34th St Unit 1025362P New York, NY | 1.0 | 1.0 | 570 | $9,174 | $16.09 | 23d | 1 | 1.09mi |
| 401 E 34th St New York, NY | 3.0 | 1.0–2.0 | 887 | $5,532 | $6.23 | 0d | 49 | 1.10mi |
HOA detail condo
- Monthly dues
- $947 · $11,364/yr
- Likely covers
- trash
- Assessments
- None detected in remarks — confirm with the listing agent.
Listing history 15 events
-
2026-06-21days on market $1,100,000 Active 279 DOM
-
2026-06-18days on market $1,100,000 Active 276 DOM
-
2026-06-17days on market $1,100,000 Active 275 DOM
-
2026-06-15days on market $1,100,000 Active 273 DOM
-
2026-06-13days on market $1,100,000 Active 271 DOM
-
2026-06-10days on market $1,100,000 Active 267 DOM
-
2026-06-08days on market $1,100,000 Active 266 DOM
-
2026-06-03days on market $1,100,000 Active 261 DOM
-
2026-06-01days on market $1,100,000 Active 259 DOM
-
2026-05-31days on market $1,100,000 Active 258 DOM
-
2026-05-09price $1,100,000
-
2026-03-20status Active
-
2026-03-20price $1,125,000
-
2025-06-29$1,100,000 Active
-
2014-08-11soldstatus $908,242
ⓘ Source: listings_history table (triggers on properties + properties_extension) + one-shot
backfill from property_details.listing_events for pre-trigger history.
Tax reassessment forecast NY · Partial reset (capped growth)
- Current annual tax
- $11,341 · $945/mo
- Projected year-2 tax
- $14,966 · $1,247/mo
- Expected delta
- +$3,624/yr (+$302/mo · 32.0%)
ⓘ Screening estimate from a state-policy table — verify with the county assessor before closing.
Climate risk First Street
- Flood 1/10 Low FEMA zone X (unshaded) · 0% chance over 30 yrs
- Wildfire 1/10 Low
- Heat 7/10 Severe 7 d/yr ≥99°F today · 15 d/yr by 30 yrs out
- Wind 6/10 Major 27% chance of damaging wind over 30 yrs
- Air quality 4/10 Moderate 5 unhealthy d/yr today · 7 by 30 yrs out
Nearby sold comps map
Loading sold comps map…
Walkable amenities ~0.75 mi
Loading nearby amenities…
Taxation est. · year 1
- Rental income
- $90,353
- − Mortgage interest
- −$61,617
- − Property taxes
- −$11,341
- − Insurance
- −$5,500
- − Repairs & maintenance
- −$7,228
- − Management
- −$7,228
- − HOA
- −$11,364
- − Depreciation
- −$32,000
- Taxable loss
- −$45,926
- Est. tax savings @ 24.0%
- +$11,022
- After-tax cash flow
- $-15,026/yr
For passive investors: Depreciation is non-cash, so a rental often shows a tax loss while cash-flowing — sheltering income. Rental losses are passive: they offset passive income freely, and up to $25,000/yr can offset ordinary (W-2) income if you actively participate and your MAGI is under $100k (phasing out to $0 by $150k); unused losses carry forward. On sale, claimed depreciation is recaptured at up to 25%, and gains may owe capital-gains tax (a 1031 exchange can defer both). Figures are a year-1 estimate at your 24.0% rate — not tax advice; consult a CPA.
Schools (NCES district)
No district data.
Livability — New York
- Score
- 75/100
- State rank
- #268
- US rank
- #4188
Category grades
Schools grade is shown separately in the Schools card above.
Census & demographics
- Census place
- New York, NY
- County
- New York County · 1,599,927 people
- City population
- 7,731,280
- Metro
- New York-Newark-Jersey City, NY-NJ-PA
- Population (ZIP)
- 53,560
- Household income
- $154,262
- Rent vs Own
- Severe rent burden
- 3480.0
Population outlook (New York County) Hauer SSP2
- Today (2025)
- 1,825,725 people
- By 2030
- 1,904,611 · +4.3%
- By 2040
- 2,052,719 · +12.4%
- By 2050
- 2,206,601 · +20.9%
- By 2075
- 2,509,427 · +37.4%
- By 2100
- 2,702,933 · +48.0%
Race, ethnicity, and origin ACS 2023
- Neighborhood character
- Majority White (64%)
- Race & ethnicity
- White 64% Asian 18% Hispanic / Latino 10% Two or more races 8% Black 4%
- Hispanic origin (detail)
- Puerto Rican 2%
- Common ancestry
- Scotch-Irish 5% Romanian 5% Lithuanian 3%
- Foreign-born
- 20% · Canada, China, South Korea
- Languages at home
- 78% English-only · Spanish 5% Chinese 4% French/Haitian/Cajun 3%
Political lean MEDSL · New York
- 2024 margin
- Solid D (+64.8) · D 82.4% · R 17.6%
- 2008→2024 swing
- -7.4pp toward R · 2008: 72.2pp · 2024: 64.8pp
- All cycles
- 2024: D+64.8 2020: D+74.5 2016: D+77.2 2012: D+69.6 2008: D+72.2
Not yet ingested
- Civics
- —
Market trends
- HPI YoY
- ▲ 9.32%
- Current HPI
- 284.9232
- Rent YoY
- ▲ 9.24%
- Metro
- New York-Newark-Jersey City, NY-NJ-PA
- State GDP YoY
- ▲ 2.60%
- F500 in state
- 92
Industry mix (Fortune 500 HQ in NY)
| Industry | F500 HQs | Revenue |
|---|---|---|
| Financial Services | 10 | $950B |
|
||
| Consumer Goods | 9 | $162B |
|
||
| Insurance | 4 | $225B |
|
||
| Telecommunications | 2 | $144B |
|
||
| Pharmaceuticals | 2 | $112B |
|
||
| Media / Entertainment | 2 | $69B |
|
||
Price history
+21.1% since first listed5 events — show timeline
- 2026-05-09 Price Changed $1,100,000 RLS at REBNY
- 2026-03-20 Relisted — RLS at REBNY
- 2026-03-20 Price Changed $1,125,000 RLS at REBNY
- 2025-06-29 Listed $1,100,000 RLS at REBNY
- 2014-08-11 Sold (Public Records) $908,242 Public Records
Property tax history
+7.5%/yrLatest (2025): $11,341 · +17.8% YoY. Source: county tax records.
Cash-flow waterfall
monthlySold comps — $/sqft
last 12 mo · ≤1 miLoading sold comps…