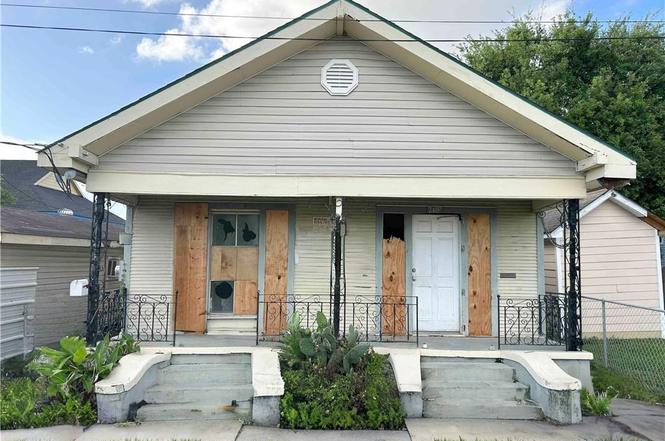
2407 S Miro St · New Orleans, LA
Flood risk 8/10 · Major
- FEMA flood zone
- AE
- Chance of flooding over 30 yrs
- 0.78%
- Est. flood insurance / yr
- $1,737 – $8,500
Fire risk 1/10 · Minimal
- Est. fire insurance / yr
- $1,269 – $2,357
Heat risk 10/10 · Severe
- Hot days now (above 108°F)
- 7 days/yr
- Hot days in 30 yrs
- 21 days/yr
Wind risk 10/10 · Severe
- Chance of severe wind over 30 yrs
- 99.0%
Air-quality risk 3/10 · Minor
- Unhealthy air days now
- 3 days/yr
- Unhealthy air days in 30 yrs
- 4 days/yr
Risk factors via First Street. Map © Google.
Why this score? — see what drove the B- grade
The composite is a weighted blend of 9 inputs, each scored 0–100. Each bar is that input's sub-score; the figure is the points it added to the 100-point composite (weight × sub-score).
- Cash flow +30.0/30.0
- 1% rule +10.0/10.0
- DSCR +10.0/10.0
- ARV discount +7.5/15.0
- Livability +4.0/5.0
- Rent growth +2.7/5.0
- Condition / age +2.5/5.0
- Schools +1.6/10.0
- Appreciation +0.0/10.0
$139,800
🖨 Deal sheet 📄 Offer letter ✓ Due diligence
Listing remarks MLS
Fantastic opportunity to own this versatile double. The front unit is all on the 1st level and features the inviting front porch, a roomy living and dining room, 3 bedrooms and 2 full baths. The rear unit includes the 2nd floor camelback and can be accessed by exterior doors on either side of the building. The rear unit features a wide open living/den/kitchen area with the primary bedroom and full bathroom completing the 1st floor. The camelback 2nd floor encompasses 2 bedrooms and 1 full bath with a cozy flex area (great spot for a desk) at the stairs landing. The upstairs bedrooms both overlook the rear yard and 1 has a door to the exterior rear stairs. If you're thinking of possible shared living arrangements, there is currently a door between units which can easily be permanently closed or left open. All offers must be submitted by the Buyer's agent via the RES.NET Agent Portal.
Key facts
- Front porch
- Living dining room
- Primary bedroom
Tags
Property features AI
Finance
- Other: Information not provided
- Financial info: This is a 2-unit property
- HOA & community: Information not provided
Exterior
- Parking: Information not provided
- Security: Information not provided
- Utilities: Public water; Public sewer
- Home design: 2-story property; Entry level information not provided; Facing direction not provided
- Construction: Shingle roof; Raised foundation; Built year not provided; Construction materials not provided
- Exterior features: City lot; Rectangular lot; Lot dimensions approximately 33 x 119
Interior
- Kitchen: Information not provided
- Bedrooms: Information not provided
- Flooring: Information not provided
- Bathrooms: 4 full bathrooms
- Heating & cooling: Central heating; Central air conditioning
- Interior features: Average condition
- Laundry & utility: Information not provided
Neighborhood map
What this means for you Summary
Snapshot
- This is a 6-bed/3.0-bath single-family listed at $140k.
Deal economics
- At list price, monthly cash flow is $2k ($24k/yr) — positive.
- The deal already cash-flows at list — no discount required.
- Meets the 1% rule at list price ($4k rent vs $140k).
- Cap rate 27.0% vs local median 4.4% in New Orleans — top-decile yield for the area; either an underpriced asset or a hidden risk that comps aren't pricing in. Stress-test before assuming the spread holds.
Location & tenants
- Location reads 81/100 on livability (#3 in LA, #1,383 nationally) — a professional / high-income tenant draw. Strengths: amenities A+, commute A+, health & safety A+; Watch: crime C-, employment D.
- Orleans Parish (urban): math 11% / reading 27% proficiency, ranked #69 of 98 in LA (top 70%) — low school quality limits family demand, transient renter base, plan for 1-2y turnover; 68% free/reduced lunch — lower-income household profile, screen leases tightly.
- Market conditions: Rents flat; 217 active listings in the ZIP; 8 comparable units currently listed for rent nearby; rentals lingering (median 44d on market — plan ~5-8 weeks vacancy on turnover, expect pricing pressure); 50% of comp listings sitting > 30 days — soft ceiling on asking rent; 710 units permitted in Orleans Parish in 2024 (244 in 5+ unit buildings).
- At $4,436/mo this rent would consume 87% of the median local household income ($61k/yr) (locally 1270% of renters already pay >50% of income on rent) — very limited rent-growth headroom before tenants either downsize or default.
Forward outlook
- Local home prices are declining (-3.0%/yr); year-one equity from $967 of loan paydown is wiped out by about $4k of value loss. Plan a longer hold.
- Orleans County population projected at +61% by 2050 — long-run rental-demand tailwind backs the buy-and-hold thesis.
- At projected returns (-3.0% appreciation + 0.7% rent growth), your $39k cash investment doubles in ~2 years — after that, you're playing with house money.
Negotiation context
- Only 7 days on market — expect competitive offers; lowballing is unlikely to land.
- 7 sale attempts since 26y ago with the ask held roughly flat each time — persistent listings suggest the price (not the market) is what's stuck; bring a comps-based counter.
- Current owner paid $38k; list at $140k implies a 268% gain — meaningful room to come down on a strong offer.
Risks & watch-outs
- Watch-outs: property tax is 2.6% of price; flood insurance adds $427/mo; built in 1942 — expect roof / HVAC / electrical / plumbing capex.
- Climate carrying-cost: in FEMA flood zone AE (mandatory federal flood insurance); severe wind risk, 99% chance of damaging wind over 30y; extreme-heat days projected 7→21/yr by 2055 (HVAC capex compounding) — expect insurance premiums to compound above CPI over the hold.
Questions for the listing agent
- Built in 1942 — when were the roof, HVAC, electrical panel, plumbing, and water heater last replaced?
- Property tax is high relative to price — has the assessment been appealed recently, and will the sale trigger a re-assessment?
- What's the actual annual flood-insurance premium (NFIP or private), and is the property in a SFHA with mandatory coverage?
- Is there a deadline driving the sale (1031 exchange, divorce, estate, relocation)? That informs how much negotiation room exists.
- What's the average days-on-market for RENTAL listings here right now (not sales)? A rising rental-DOM trend means longer vacancies and softer asking-rent achievability than the comps imply.
- What's the recent tenant-quality profile in this submarket — average credit score on applications, eviction rate, late-payment / NSF rate, and stable-employment percentage? A property-management company in the area should have these aggregated.
- How much new for-sale + rental construction is in the pipeline within 1–3 miles? Heavy new supply typically softens prices + rents 12–24 months out; constrained supply supports both.
Investment metrics
- 1% rule
- 3.17% ✓
- Cap rate
- 27.02%
- Cash-on-cash
- 74.03%
- DSCR
- 4.29
- GRM
- 2.6
CMA / ARV
- ARV (on-the-fly)
- $298,758
- Comps found
- 1
Show comp detail 1 sale within ~0.75 mi
| Address | Dist | Beds/Ba | Sqft | Sold | Price | $/sf | Match |
|---|---|---|---|---|---|---|---|
| 3415 Louisiana Ave Pkwy | 0.34mi | 6/3.5 | 2,568 (-13%) | 8mo | $260,000 | $101 | 54 |
Match score weights: distance 35% · size 25% · config 20% · recency 20%. Top-matched comps best support the ARV.
Projected returns pro-forma
-3.0% appreciation · 0.73% rent growth · sell at horizon
- IRR
- 56.8%
- Equity multiple
- 3.41×
- Total profit
- $94,477
- Equity at exit
- $20,845
- IRR
- 60.8%
- Equity multiple
- 6.32×
- Total profit
- $208,127
- Equity at exit
- $12,087
Cash invested: $39,144 (down + closing). Projections, not guarantees.
Landlord ↔ Tenant lean methodology
- Overall (STATE)
- 90 Strongly Landlord-Friendly
- State Louisiana
- 90 Strongly Landlord-Friendly · R+12
- County
- — inherits STATE
- City
- — inherits STATE
ZIP-level market 70125
- Home prices YoY
- -16.3%
- Rents YoY
- 0.7%
- Active inventory
- 217
- Price-to-rent
- 2.6×
Monthly cashflow live
- Estimated rent
- $4,436 high interval (Pro) →
- Mortgage (P&I)
- −$733
- Tax from tax record
- −$299 /mo · $3,583/yr
- Insurance
- −$58
- Flood insurance flood zone
- −$427 /mo · $5,118/yr
- HOA
- −$0
- Vacancy / Maint / Mgmt
- −$932
- Net cashflow
- $1,988
Break-even live
UW: 25.0% down · 7.5% · 30yr · 1.5% tax · 5.0% vac · 8.0% maint · 8.0% mgmt
Financing live
Cash to close
- Down payment
- $34,950
- Closing costs
- $4,194
- Reserves months
- —
- Total cash needed
- —
Loan-product check · same deal, 3 products live
Conventional
25% down · 7.5% · 30yr
- Down + closing
- —
- Monthly P&I
- —
- Monthly cashflow
- —
- DSCR
- —
- Eligible?
- —
Personal DTI + credit; lowest rate.
DSCR
20% down · 8.5% · 30yr
- Down + closing
- —
- Monthly P&I
- —
- Monthly cashflow
- —
- DSCR
- —
- Eligible?
- —
No personal income docs; deal must DSCR.
Hard money
10% down · 12.0% · 12mo
- Down + closing
- —
- Monthly P&I
- —
- Monthly cashflow
- —
- DSCR
- —
- Eligible?
- —
Short-term bridge; refi at stabilization.
Rent comps 8 comps
| Address | Beds | Baths | Sqft | Rent | $/sqft | DOM | Units | Dist |
|---|---|---|---|---|---|---|---|---|
| 3112 Upperline St New Orleans, LA | 5.0 | 3.5 | 2800 | $3,650 | $1.30 | 23d | 1 | 0.87mi |
| 6326 S Johnson St Unit 1 New Orleans, LA | 5.0 | 2.0 | 2013 | $3,950 | $1.96 | 43d | 1 | 1.22mi |
| 2703 Palmer Ave New Orleans, LA | 5.0 | 2.0 | 2349 | $5,500 | $2.34 | 43d | 1 | 1.26mi |
| 2715 Palmer Ave New Orleans, LA | 5.0 | 2.0 | 2184 | $4,900 | $2.24 | 43d | 1 | 1.26mi |
| 822 Howard Ave Unit 1272354P New Orleans, LA | 1.0–5.0 | 1.0–4.0 | 1749 | $11,882 | $6.79 | 1d | 3 | 1.28mi |
| 2808 Calhoun St New Orleans, LA | 6.0 | 4.0 | 3037 | $7,500 | $2.47 | 21d | 1 | 1.28mi |
| 1927 Napoleon Ave New Orleans, LA | 5.0 | 2.0 | 3350 | $3,600 | $1.07 | 43d | 1 | 1.37mi |
| 822 Perdido St Unit 1272370P New Orleans, LA | 1.0–5.0 | 1.0–5.0 | 1447 | $7,361 | $5.09 | 3d | 4 | 1.38mi |
Listing history 6 events
-
2026-06-18days on market $139,800 Active 7 DOM
-
2026-06-17days on market $139,800 Active 6 DOM
-
2026-06-16days on market $139,800 Active 5 DOM
-
2026-06-15days on market $139,800 Active 4 DOM
-
2026-06-13remarks 699-char remark
-
2026-06-13$139,800 Active 2 DOM
ⓘ Source: listings_history table (triggers on properties + properties_extension) + one-shot
backfill from property_details.listing_events for pre-trigger history.
Tax reassessment forecast LA · Resets to sale price
- Current annual tax
- $3,583 · $299/mo
- Projected year-2 tax
- $3,583 · $299/mo
- Expected delta
- $0/yr ($0/mo · 0.0%)
ⓘ Screening estimate from a state-policy table — verify with the county assessor before closing.
Climate risk First Street
- Flood 8/10 Severe FEMA zone AE · 78% chance over 30 yrs
- Wildfire 1/10 Low
- Heat 10/10 Extreme 7 d/yr ≥108°F today · 21 d/yr by 30 yrs out
- Wind 10/10 Extreme 99% chance of damaging wind over 30 yrs
- Air quality 3/10 Moderate 3 unhealthy d/yr today · 4 by 30 yrs out
Nearby sold comps map
Loading sold comps map…
Walkable amenities ~0.75 mi
Loading nearby amenities…
Taxation est. · year 1
- Rental income
- $53,237
- − Mortgage interest
- −$7,831
- − Property taxes
- −$3,583
- − Insurance
- −$5,818
- − Repairs & maintenance
- −$4,259
- − Management
- −$4,259
- − Depreciation
- −$4,067
- Taxable income
- $23,421
- Est. tax owed @ 24.0%
- −$5,621
- After-tax cash flow
- $18,238/yr
For passive investors: Depreciation is non-cash, so a rental often shows a tax loss while cash-flowing — sheltering income. Rental losses are passive: they offset passive income freely, and up to $25,000/yr can offset ordinary (W-2) income if you actively participate and your MAGI is under $100k (phasing out to $0 by $150k); unused losses carry forward. On sale, claimed depreciation is recaptured at up to 25%, and gains may owe capital-gains tax (a 1031 exchange can defer both). Figures are a year-1 estimate at your 24.0% rate — not tax advice; consult a CPA.
Schools (NCES district)
- District
- Orleans Parish
- NCES district ID
- 2201170
- Math proficiency
- 11% ▼ -52.00%
- Reading proficiency
- 27% ▼ -46.00%
- Median HH income
- $37,011
- Composite
- 15.78/100
- National rank
- #9271
- State rank
- #69 of 98 in LA
Livability — New Orleans
- Score
- 81/100
- State rank
- #3
- US rank
- #1383
Category grades
Schools grade is shown separately in the Schools card above.
Census & demographics
- Census place
- New Orleans, LA
- County
- Orleans Parish · 338,817 people
- City population
- 338,817
- Metro
- New Orleans-Metairie, LA
- Population (ZIP)
- 17,821
- Household income
- $61,174
- Rent vs Own
- Severe rent burden
- 1270.0
Population outlook (Orleans County) Hauer SSP2
- Today (2025)
- 513,025 people
- By 2030
- 575,781 · +12.2%
- By 2040
- 700,174 · +36.5%
- By 2050
- 826,541 · +61.1%
- By 2075
- 1,123,374 · +119.0%
- By 2100
- 1,355,609 · +164.2%
Race, ethnicity, and origin ACS 2023
- Neighborhood character
- Diverse neighborhood (Simpson 0.63)
- Race & ethnicity
- Black 51% White 32% Hispanic / Latino 9% Two or more races 9% Asian 2% Native American 1%
- Hispanic origin (detail)
- Mexican 2%
- Common ancestry
- Lithuanian 8% Romanian 1% Slovak 1%
- Foreign-born
- 7% · Canada, China
- Languages at home
- 90% English-only · Spanish 6% French/Haitian/Cajun 1% Chinese 1%
Political lean MEDSL · Orleans
- 2024 margin
- Solid D (+67.0) · D 82.2% · R 15.2% · Other 2.7%
- 2008→2024 swing
- +6.7pp toward D · 2008: 60.3pp · 2024: 67.0pp
- All cycles
- 2024: D+67.0 2020: D+68.2 2016: D+66.2 2012: D+62.5 2008: D+60.3
Not yet ingested
- Civics
- —
Market trends
- HPI YoY
- ▼ -49.68%
- Current HPI
- 255.5998
- Rent YoY
- ▲ 0.73%
- Metro
- New Orleans-Metairie, LA
- State GDP YoY
- ▲ 3.29%
- F500 in state
- 10
Industry mix (Fortune 500 HQ in LA)
| Industry | F500 HQs | Revenue |
|---|---|---|
| Telecommunications | 2 | $23B |
|
||
| Utilities | 1 | $12B |
|
||
| Wholesale / Distribution | 1 | $5B |
|
||
| Advertising | 1 | $2B |
|
||
Price history
+194.3% since first listed16 events — show timeline
- 2026-05-31 Listed $139,800 GSREIN
- 2026-05-31 Listed $139,800 AcadianaMLS
- 2025-02-03 Listed $116,850 AcadianaMLS
- 2024-11-27 Price Changed $116,850 AcadianaMLS
- 2024-11-27 Price Changed $116,850 GSREIN
- 2024-11-24 Price Changed $129,700 AcadianaMLS
- 2024-11-24 Price Changed $129,700 GSREIN
- 2024-11-03 Price Changed $138,700 AcadianaMLS
- 2024-11-03 Price Changed $138,700 GSREIN
- 2024-10-25 Listed $149,700 AcadianaMLS
- 2024-08-27 Price Changed $162,450 GSREIN
- 2024-07-11 Price Changed $171,000 GSREIN
- 2024-07-02 Listed $162,450 AcadianaMLS
- 2000-06-16 Sold (MLS) $38,000 GSREIN
- 2000-06-14 Listed $47,500 GSREIN
- 2000-06-14 Listed $47,500 AcadianaMLS
Property tax history
+13.9%/yrLatest (2026): $3,583 · +1.1% YoY. Source: county tax records.
Cash-flow waterfall
monthlySold comps — $/sqft
last 12 mo · ≤1 miLoading sold comps…