29 Hazelwood Dr · Franklinville, NJ
Flood risk No data
- FEMA flood zone
- —
- Chance of flooding over 30 yrs
- —
- Est. flood insurance / yr
- —
Fire risk No data
- Est. fire insurance / yr
- —
Heat risk No data
- Hot days now (above threshold)
- —
- Hot days in 30 yrs
- —
Wind risk No data
- Chance of severe wind over 30 yrs
- —
Air-quality risk No data
- Unhealthy air days now
- —
- Unhealthy air days in 30 yrs
- —
Risk factors via First Street. Map © Google.
Why this score? — see what drove the B- grade
The composite is a weighted blend of 9 inputs, each scored 0–100. Each bar is that input's sub-score; the figure is the points it added to the 100-point composite (weight × sub-score).
- Cash flow +30.0/30.0
- 1% rule +10.0/10.0
- DSCR +10.0/10.0
- ARV discount +8.4/15.0
- Schools +3.1/10.0
- Rent growth +2.5/5.0
- Livability +2.5/5.0
- Condition / age +2.5/5.0
- Appreciation +0.0/10.0
$75,000
🖨 Deal sheet 📄 Offer letter ✓ Due diligence
Listing remarks MLS
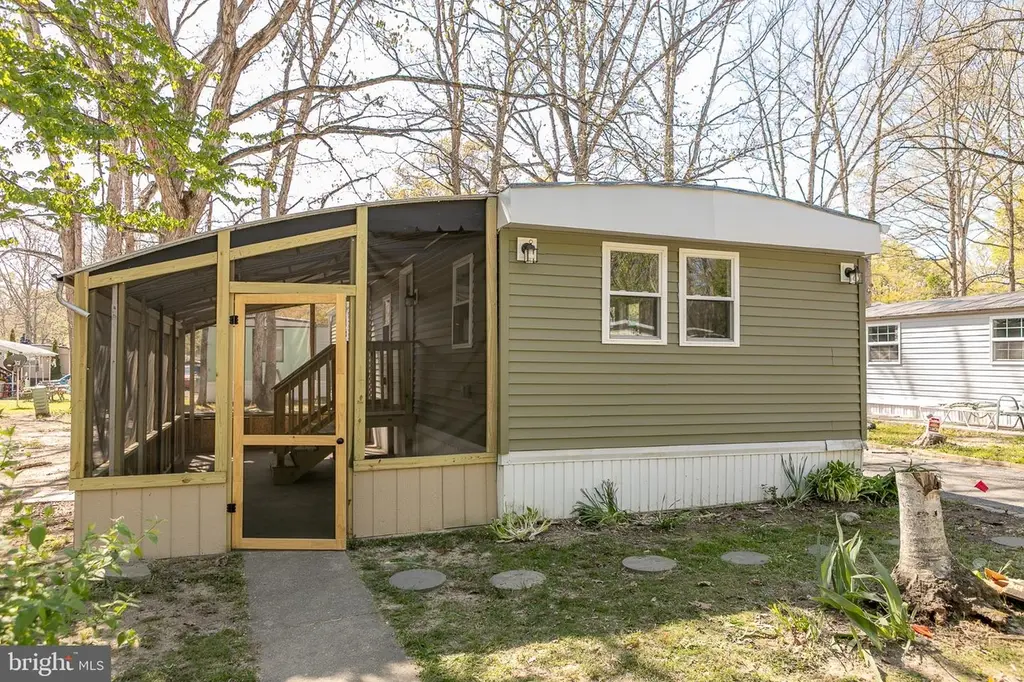
Mobile home 2 bedrooms 1 bath, Patio with awning, off street parking. Priced to sell " Being Sold as Is" Lot rent $450.00 a month
Key facts
- Renovated bathroom
- Fresh paint
- Upgraded kitchen
Tags
Property features AI
Finance
- Financial info: Monthly land lease: $789; Land lease years remaining: 123; Association recreation fee amount: $789
- HOA & community: Association recreation fee applies
Exterior
- Parking: Driveway parking; On-street parking
- Utilities: Public water; Public sewer
- Home design: Manufactured home; Land lease ownership
- Construction: Aluminum siding; Above-grade structure; Unknown roof; Year built (estimated); Major remodel/effective year 2026
- Exterior features: Community pool; Located in Harding Woods; Not in a federal flood zone
Interior
- Bedrooms: 2 bedrooms on the main level
- Flooring: Laminate flooring
- Bathrooms: 1 full bathroom (total); 1 full bathroom on the main level
- Heating & cooling: Forced air heating; Central air conditioning; Electric hot water
- Interior features: Drywall walls and ceilings; Estimated living area; Not furnished
Neighborhood map
What this means for you Summary
Snapshot
- This is a 2-bed/1.0-bath single-family listed at $75k.
Deal economics
- At list price, monthly cash flow is $473 ($6k/yr) — positive.
- The deal already cash-flows at list — no discount required.
- Meets the 1% rule at list price ($1k rent vs $75k).
- Recommended offer: $73k (3.0% below list) — sets the bar for market timing.
- Cap rate 13.9% vs local median 2.5% in Franklinville — top-decile yield for the area; either an underpriced asset or a hidden risk that comps aren't pricing in. Stress-test before assuming the spread holds.
Location & tenants
- Location reads: area grade B — affects rentability + tenant quality, not the cash-flow math above.
- Pittsgrove Township School District (rural): math 18% / reading 48% proficiency, ranked #295 of 472 in NJ (top 62%) — families likely to look elsewhere, expect single-tenant / working-renter base with shorter leases.
- Market conditions: 79 active listings in the ZIP; 95 units permitted in Salem County in 2024 (0 in 5+ unit buildings).
Forward outlook
- Local home prices are declining (-3.0%/yr); year-one equity from $519 of loan paydown is wiped out by about $2k of value loss. Plan a longer hold.
- Salem County population projected at -23% by 2050 — secular population decline; favor cash flow + early exit over multi-decade hold.
- At projected returns (-3.0% appreciation + 3.0% rent growth), your $21k cash investment doubles in ~5 years — after that, you're playing with house money.
Negotiation context
- It's been on market 58 days — a 3% lower offer ($73k) is reasonable based on typical stale-listing flexibility.
- 2 sale attempts since 18y ago; this cycle's ask has dropped $40k (35%) from the opening price — seller is motivated, your offer sets the floor, not the list.
- Current owner paid $11k; list at $75k implies a 582% gain — meaningful room to come down on a strong offer.
Questions for the listing agent
- It's been on market 58 days. Have you received any prior offers? Is the seller open to a 3% concession, seller financing, or rate buy-down credit?
- Built in 1978 — when were the roof, HVAC, electrical panel, plumbing, and water heater last replaced?
- Is there a deadline driving the sale (1031 exchange, divorce, estate, relocation)? That informs how much negotiation room exists.
- What's the average days-on-market for RENTAL listings here right now (not sales)? A rising rental-DOM trend means longer vacancies and softer asking-rent achievability than the comps imply.
- What's the recent tenant-quality profile in this submarket — average credit score on applications, eviction rate, late-payment / NSF rate, and stable-employment percentage? A property-management company in the area should have these aggregated.
- How much new for-sale + rental construction is in the pipeline within 1–3 miles? Heavy new supply typically softens prices + rents 12–24 months out; constrained supply supports both.
Investment metrics
- 1% rule
- 1.67% ✓
- Cap rate
- 13.86%
- Cash-on-cash
- 27.02%
- DSCR
- 2.20
- GRM
- 5.0
CMA / ARV
- ARV (on-the-fly)
- $76,500
- Comps found
- 12
Show comp detail 12 sales within ~0.75 mi
| Address | Dist | Beds/Ba | Sqft | Sold | Price | $/sf | Match |
|---|---|---|---|---|---|---|---|
| 26 Cedarwood Ave | 0.17mi | 2/2.0 | 952 (+6%) | 9mo | $83,000 | $87 | 71 |
| 43 Hazelwood Dr | 0.30mi | 2/1.0 | 860 (-4%) | 11mo | $69,000 | $80 | 69 |
| 4 Donald Pl | 0.37mi | 2/2.0 | 868 (-4%) | 6mo | $50,000 | $58 | 68 |
| 3 Cedarwood Dr | 0.21mi | 2/2.0 | 976 (+8%) | 6mo | $83,300 | $85 | 67 |
| 59 Hazelwood Dr | 0.30mi | 2/1.0 | 980 (+9%) | 6mo | $45,000 | $46 | 66 |
| 88 Hazelwood Dr | 0.31mi | 2/2.0 | 800 (-11%) | 9mo | $64,000 | $80 | 56 |
| 25 Elmwood Dr | 0.25mi | 2/1.0 | 768 (-15%) | 10mo | $20,000 | $26 | 56 |
| 5 Elmwood Cir | 0.36mi | 3/2.0 (+1) | 924 (+3%) | 19mo | $125,000 | $135 | 54 |
| 4 Dianna Pl | 0.50mi | 3/1.0 (+1) | 980 (+9%) | 9mo | $55,000 | $56 | 49 |
| 8 Ashwood Dr | 0.17mi | 3/2.0 (+1) | 1,000 (+11%) | 21mo | $120,000 | $120 | 47 |
| 5 Luann Dr | 0.58mi | 2/1.0 | 860 (-4%) | 23mo | $77,500 | $90 | 47 |
| 7 Elmwood Dr | 0.35mi | 2/2.0 | 784 (-13%) | 18mo | $109,000 | $139 | 43 |
Match score weights: distance 35% · size 25% · config 20% · recency 20%. Top-matched comps best support the ARV.
Projected returns pro-forma
-3.0% appreciation · 3.0% rent growth · sell at horizon
- IRR
- 21.0%
- Equity multiple
- 1.86×
- Total profit
- $17,986
- Equity at exit
- $11,183
- IRR
- 29.1%
- Equity multiple
- 3.60×
- Total profit
- $54,524
- Equity at exit
- $6,485
Cash invested: $21,000 (down + closing). Projections, not guarantees.
Landlord ↔ Tenant lean methodology
- Overall (STATE)
- 21 Tenant-Leaning
- State New Jersey
- 21 Tenant-Leaning · D+6
- County
- — inherits STATE
- City
- — inherits STATE
ZIP-level market 08318
- Home prices YoY
- -16.6%
- Active inventory
- 79
- Price-to-rent
- 5.0×
Monthly cashflow live
- Estimated rent
- $1,255 medium interval (Pro) →
- Mortgage (P&I)
- −$393
- Tax est. 1.5%
- −$94 /mo · $1,125/yr
- Insurance
- −$31
- HOA
- −$0
- Vacancy / Maint / Mgmt
- −$263
- Net cashflow
- $473
Break-even live
UW: 25.0% down · 7.5% · 30yr · 1.5% tax · 5.0% vac · 8.0% maint · 8.0% mgmt
Financing live
Cash to close
- Down payment
- $18,750
- Closing costs
- $2,250
- Reserves months
- —
- Total cash needed
- —
Loan-product check · same deal, 3 products live
Conventional
25% down · 7.5% · 30yr
- Down + closing
- —
- Monthly P&I
- —
- Monthly cashflow
- —
- DSCR
- —
- Eligible?
- —
Personal DTI + credit; lowest rate.
DSCR
20% down · 8.5% · 30yr
- Down + closing
- —
- Monthly P&I
- —
- Monthly cashflow
- —
- DSCR
- —
- Eligible?
- —
No personal income docs; deal must DSCR.
Hard money
10% down · 12.0% · 12mo
- Down + closing
- —
- Monthly P&I
- —
- Monthly cashflow
- —
- DSCR
- —
- Eligible?
- —
Short-term bridge; refi at stabilization.
Listing history 24 events
-
2026-06-19days on market $75,000 Active 58 DOM
-
2026-06-18days on market $75,000 Active 57 DOM
-
2026-06-17days on market $75,000 Active 56 DOM
-
2026-06-16days on market $75,000 Active 55 DOM
-
2026-06-15days on market $75,000 Active 54 DOM
-
2026-06-14days on market $75,000 Active 52 DOM
-
2026-06-13days on market $75,000 Active 51 DOM
-
2026-06-10days on market $75,000 Active 49 DOM
-
2026-06-09days on market $75,000 Active 48 DOM
-
2026-06-08days on market $75,000 Active 47 DOM
-
2026-06-07days on market $75,000 Active 46 DOM
-
2026-06-05pricedays on market $75,000 Active 43 DOM
-
2026-06-03price $85,000 Active 41 DOM
-
2026-06-02days on market $90,000 Active 41 DOM
-
2026-06-01days on market $90,000 Active 40 DOM
-
2026-05-31days on market $90,000 Active 39 DOM
-
2026-05-30days on market $90,000 Active 38 DOM
-
2026-05-16price $90,000
-
2026-05-06price $97,000
-
2026-04-28price $105,000
-
2026-04-22$115,000 Active
-
2008-10-17soldstatus $11,000 139-char remark
Show marketing remark (139 chars)
Mobile home 2 bedrooms 1 bath, Patio with awning, off street parking. Priced to sell " Being Sold as Is" Lot rent $450.00 a month
-
2008-09-12historical 139-char remark
Show marketing remark (139 chars)
Mobile home 2 bedrooms 1 bath, Patio with awning, off street parking. Priced to sell " Being Sold as Is" Lot rent $450.00 a month
-
2008-09-03$12,000 139-char remark
Show marketing remark (139 chars)
Mobile home 2 bedrooms 1 bath, Patio with awning, off street parking. Priced to sell " Being Sold as Is" Lot rent $450.00 a month
ⓘ Source: listings_history table (triggers on properties + properties_extension) + one-shot
backfill from property_details.listing_events for pre-trigger history.
Nearby sold comps map
Loading sold comps map…
Walkable amenities ~0.75 mi
Loading nearby amenities…
Taxation est. · year 1
- Rental income
- $15,057
- − Mortgage interest
- −$4,201
- − Property taxes
- −$1,125
- − Insurance
- −$375
- − Repairs & maintenance
- −$1,205
- − Management
- −$1,205
- − Depreciation
- −$2,182
- Taxable income
- $4,765
- Est. tax owed @ 24.0%
- −$1,144
- After-tax cash flow
- $4,532/yr
For passive investors: Depreciation is non-cash, so a rental often shows a tax loss while cash-flowing — sheltering income. Rental losses are passive: they offset passive income freely, and up to $25,000/yr can offset ordinary (W-2) income if you actively participate and your MAGI is under $100k (phasing out to $0 by $150k); unused losses carry forward. On sale, claimed depreciation is recaptured at up to 25%, and gains may owe capital-gains tax (a 1031 exchange can defer both). Figures are a year-1 estimate at your 24.0% rate — not tax advice; consult a CPA.
Schools (NCES district)
- District
- Pittsgrove Township School District
- NCES district ID
- 3413110
- Math proficiency
- 18% ▼ -22.00%
- Reading proficiency
- 48% ▼ -8.00%
- Median HH income
- $71,126
- Composite
- 30.59/100
- National rank
- #6201
- State rank
- #295 of 472 in NJ
Livability — Franklinville
No livability data for this city. (Only ~50 U.S. cities are tracked.)
Census & demographics
- Population (ZIP)
- 12,149
Population outlook (Salem County) Hauer SSP2
- Today (2025)
- 59,905 people
- By 2030
- 57,351 · -4.3%
- By 2040
- 51,837 · -13.5%
- By 2050
- 46,356 · -22.6%
- By 2075
- 36,452 · -39.2%
- By 2100
- 28,907 · -51.7%
Race, ethnicity, and origin ACS 2023
- Neighborhood character
- Predominantly White (79%)
- Race & ethnicity
- White 79% Hispanic / Latino 9% Black 7% Two or more races 7%
- Hispanic origin (detail)
- Mexican 2% Puerto Rican 6%
- Common ancestry
- Lithuanian 3% Romanian 3% Serbian 1%
- Foreign-born
- 1%
- Languages at home
- 93% English-only · Spanish 5%
Political lean MEDSL · Salem
- 2024 margin
- R (+19.2) · D 39.6% · R 58.8% · Other 1.6%
- 2008→2024 swing
- -23.1pp toward R · 2008: 3.9pp · 2024: -19.2pp
- All cycles
- 2024: R+19.2 2020: R+12.8 2016: R+15.4 2012: D+0.8 2008: D+3.9
Not yet ingested
- Civics
- —
Market trends
- HPI YoY
- ▼ -56.68%
- Current HPI
- 284.9025
- Rent YoY
- —
- Metro
- —
- State GDP YoY
- ▲ 2.05%
- F500 in state
- 34
Industry mix (Fortune 500 HQ in NJ)
| Industry | F500 HQs | Revenue |
|---|---|---|
| Consumer Goods | 3 | $31B |
|
||
| Pharmaceuticals | 2 | $153B |
|
||
| Technology | 2 | $21B |
|
||
| Insurance | 2 | $20B |
|
||
| Healthcare | 2 | $19B |
|
||
| Financial Services | 1 | $70B |
|
||
Price history
+650.0% since first listed7 events — show timeline
- 2026-05-16 Price Changed $90,000 BRIGHT MLS
- 2026-05-06 Price Changed $97,000 BRIGHT MLS
- 2026-04-28 Price Changed $105,000 BRIGHT MLS
- 2026-04-22 Listed $115,000 BRIGHT MLS
- 2008-10-17 Sold (MLS) $11,000 BRIGHT MLS
- 2008-09-12 Listing Removed — BRIGHT MLS
- 2008-09-03 Listed $12,000 BRIGHT MLS
Cash-flow waterfall
monthlySold comps — $/sqft
last 12 mo · ≤1 miLoading sold comps…