1217 Little Flock Dr · Fort Worth, TX
Flood risk 1/10 · Minimal
- FEMA flood zone
- X (unshaded)
- Chance of flooding over 30 yrs
- 0.0%
- Est. flood insurance / yr
- $507 – $1,088
Fire risk 4/10 · Minor
- Est. fire insurance / yr
- $1,222 – $2,270
Heat risk 7/10 · Major
- Hot days now (above 109°F)
- 7 days/yr
- Hot days in 30 yrs
- 23 days/yr
Wind risk 6/10 · Moderate
- Chance of severe wind over 30 yrs
- 27.0%
Air-quality risk 3/10 · Minor
- Unhealthy air days now
- 2 days/yr
- Unhealthy air days in 30 yrs
- 3 days/yr
Risk factors via First Street. Map © Google.
Why this score? — see what drove the D+ grade
The composite is a weighted blend of 9 inputs, each scored 0–100. Each bar is that input's sub-score; the figure is the points it added to the 100-point composite (weight × sub-score).
- Cash flow +13.2/30.0
- ARV discount +11.0/15.0
- DSCR +4.0/10.0
- Livability +4.0/5.0
- Condition / age +4.0/5.0
- 1% rule +3.7/10.0
- Rent growth +3.1/5.0
- Schools +2.5/10.0
- Appreciation +0.0/10.0
$268,999
🖨 Deal sheet (PDF) 📄 Offer letter ✓ Due diligence
Listing remarks
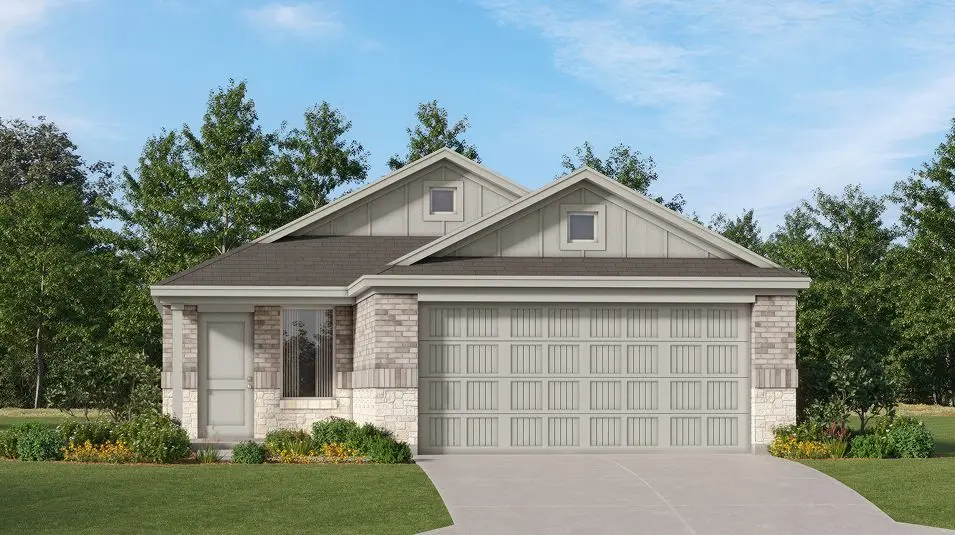
This single-level home showcases a spacious open floorplan shared between the kitchen, dining area and family room for easy entertaining. An owner's suite enjoys a private location in a rear corner of the home, complemented by an en-suite bathroom and walk-in closet. There are three secondary bedrooms along the side of the home, which are comfortable spaces for household members and overnight guests.
Key facts
- Walk-in closet
- Open floorplan
- Secondary bedrooms
Tags
Property features AI
Finance
- Other: Address: 1217 Little Flock Dr, Crowley TX 76036
- Financial info: List price $268,999
Exterior
- Parking: 2 garage spaces (2 total parking spaces)
- Home design: Single-family property (Pinehollow plan); Active listing
- Exterior features: Living area approximately 1,656 (listed)
Interior
- Bedrooms: 4 bedrooms
- Bathrooms: 2 bathrooms (both full)
- Interior features: Spec new construction (Pinehollow plan)
Neighborhood map
What this means for you Summary
Snapshot
- This is a 4-bed/2.0-bath single-family listed at $269k. Condition is rated good.
Deal economics
- At list price, monthly cash flow is $-4 ($-46/yr) — negative.
- To cash-flow at today's rent, offer at most $268k (0.2% below list).
- To meet the 1% rule (rent ≥ 1% of price), the offer needs to be $235k (12.7% below list).
- Recommended offer: $235k (12.7% below list) — sets the bar for 1% rule.
- Cap rate 6.3% vs local median 3.9% in Fort Worth — top-decile yield for the area; either an underpriced asset or a hidden risk that comps aren't pricing in. Stress-test before assuming the spread holds.
Location & tenants
- Location reads 80/100 on livability (#49 in TX, #1,954 nationally) — a professional / high-income tenant draw. Strengths: amenities A+, cost of living A+, housing A+; Watch: crime F.
- Crowley ISD (urban): math 23% / reading 32% proficiency, ranked #643 of 826 in TX (top 78%) — low school quality limits family demand, transient renter base, plan for 1-2y turnover.
- Zoned schools: Sidney H Poynter (math 12% / reading 27%, grade F, #3,583 of 4,322 statewide, top 86%, 422 students, 81% FRL); H F Stevens Middle (math 16% / reading 26%, grade F, #1,387 of 1,662 statewide, top 85%, 747 students, 84% FRL); Crowley H S (math 23% / reading 36%, grade F, #1,112 of 1,632 statewide, top 70%, 2,351 students, 72% FRL) — zoned schools average 79% FRL vs 52% district-wide (27 pts higher); higher-poverty schools than district average — tighter screening recommended.
- Market conditions: Rents rising (+2.3%/yr); 1036 active listings in the ZIP; 40 comparable units currently listed for rent nearby; rentals at typical pace (median 27d on market — plan ~3-4 weeks tenant-placement turnaround); 40% of comp listings sitting > 30 days — soft ceiling on asking rent; solid renter incomes; 18,938 units permitted in Tarrant County in 2024 (8,336 in 5+ unit buildings).
Forward outlook
- Local home prices are declining (-3.0%/yr); year-one equity from $2k of loan paydown is wiped out by about $8k of value loss. Plan a longer hold.
- Tarrant County population projected at +41% by 2050 — long-run rental-demand tailwind backs the buy-and-hold thesis.
Negotiation context
- It's been on market 19 days — a 2% lower offer ($265k) is reasonable based on typical stale-listing flexibility.
Risks & watch-outs
- Climate carrying-cost: major wind risk, 27% chance of damaging wind over 30y; extreme-heat days projected 7→23/yr by 2055 (HVAC capex compounding) — expect insurance premiums to compound above CPI over the hold.
Questions for the listing agent
- What do current leases actually rent for vs. the listed asking? Can we see a recent rent roll and the last 12 months of T-12 income?
- Is there a deadline driving the sale (1031 exchange, divorce, estate, relocation)? That informs how much negotiation room exists.
- Schools are D-rated, which usually means shorter tenancies and higher turnover. Who's the typical renter profile here, and what's been the actual vacancy rate?
- Crime grade is F in this area — have there been break-ins, vandalism, or insurance claims at this property in the last 3 years? What carrier currently insures it and at what premium?
- The area grade is low — what's the realistic commute time and amenity access for the typical tenant pool here? Any planned neighborhood developments (good or bad) we should know about?
- What's the average days-on-market for RENTAL listings here right now (not sales)? A rising rental-DOM trend means longer vacancies and softer asking-rent achievability than the comps imply.
- What's the recent tenant-quality profile in this submarket — average credit score on applications, eviction rate, late-payment / NSF rate, and stable-employment percentage? A property-management company in the area should have these aggregated.
- How much new for-sale + rental construction is in the pipeline within 1–3 miles? Heavy new supply typically softens prices + rents 12–24 months out; constrained supply supports both.
Investment metrics
- 1% rule
- 0.87% ✗
- Cap rate
- 6.28%
- Cash-on-cash
- -0.06%
- DSCR
- 1.00
- GRM
- 9.5
CMA / ARV
- ARV (on-the-fly)
- $291,456
- Comps found
- 12
Show comp detail 12 sales within ~0.75 mi
| Address | Dist | Beds/Ba | Sqft | Sold | Price | $/sf | Match |
|---|---|---|---|---|---|---|---|
| 1044 Pineview Ln | 0.31mi | 4/2.0 | 1,812 (+9%) | 2mo | $339,966 | $188 | 68 |
| 1017 Stonehaven Ln | 0.36mi | 4/2.0 | 1,813 (+10%) | 2mo | $344,558 | $190 | 66 |
| 1201 Oryx Dr | 0.74mi | 4/2.0 | 1,667 (+1%) | 1mo | $277,999 | $167 | 63 |
| 1240 Calamian Dr | 0.74mi | 4/2.0 | 1,667 (+1%) | 6mo | $263,999 | $158 | 60 |
| 1005 Quincy Ct | 0.34mi | 4/2.0 | 1,877 (+13%) | 3mo | $329,990 | $176 | 59 |
| 1233 Calamian Dr | 0.75mi | 4/2.0 | 1,707 (+3%) | 2mo | $287,999 | $169 | 58 |
| 1009 Stonehaven Ln | 0.35mi | 3/2.0 (-1) | 1,868 (+13%) | 1mo | $329,999 | $177 | 56 |
| 1004 Stonehaven Ln | 0.38mi | 4/2.0 | 1,898 (+15%) | 4mo | $329,990 | $174 | 54 |
| 1104 Meadow Vista Dr | 0.47mi | 4/2.0 | 1,898 (+15%) | 0mo | $329,990 | $174 | 54 |
| 1124 Tanger Ln | 0.56mi | 4/2.0 | 1,877 (+13%) | 2mo | $339,990 | $181 | 50 |
| 1124 Hackberry Ln | 0.57mi | 4/2.0 | 1,877 (+13%) | 3mo | $324,990 | $173 | 49 |
| 1120 Hackberry Ln | 0.56mi | 4/2.0 | 1,898 (+15%) | 1mo | $349,990 | $184 | 49 |
Match score weights: distance 35% · size 25% · config 20% · recency 20%. Top-matched comps best support the ARV.
Projected returns pro-forma
-3.0% appreciation · 2.28% rent growth · sell at horizon
- IRR
- -17.2%
- Equity multiple
- 0.40×
- Total profit
- $-45,486
- Equity at exit
- $40,109
- IRR
- -10.5%
- Equity multiple
- 0.38×
- Total profit
- $-46,609
- Equity at exit
- $23,258
Cash invested: $75,320 (down + closing). Projections, not guarantees.
Landlord ↔ Tenant lean methodology
- Overall (STATE)
- 87 Strongly Landlord-Friendly
- State Texas
- 87 Strongly Landlord-Friendly · R+5
- County
- — inherits STATE
- City
- — inherits STATE
ZIP-level market 76036
- Home prices YoY
- -25.2%
- Rents YoY
- 2.3%
- Active inventory
- 1036
- Price-to-rent
- 9.5×
Monthly cashflow live
- Estimated rent
- $2,348 high interval (Pro) →
- Mortgage (P&I)
- −$1,411
- Tax est. 1.5%
- −$336 /mo · $4,035/yr
- Insurance
- −$112
- HOA
- −$0
- Vacancy / Maint / Mgmt
- −$493
- Net cashflow
- $-4
Break-even live
Sensitivity live
| Price | -10% $182 | -5% $89 | +0% $-4 | +5% $-97 | +10% $-190 |
|---|---|---|---|---|---|
| Rent | -10% $-189 | -5% $-97 | +0% $-4 | +5% $89 | +10% $182 |
| Rate | -1.0pp $132 | -0.5pp $65 | base $-4 | +0.5pp $-74 | +1.0pp $-144 |
UW: 25.0% down · 7.5% · 30yr · 1.5% tax · 5.0% vac · 8.0% maint · 8.0% mgmt
Financing live
Cash to close
- Down payment
- $67,250
- Closing costs
- $8,070
- Reserves months
- —
- Total cash needed
- —
Loan-product check · same deal, 3 products live
Conventional
25% down · 7.5% · 30yr
- Down + closing
- —
- Monthly P&I
- —
- Monthly cashflow
- —
- DSCR
- —
- Eligible?
- —
Personal DTI + credit; lowest rate.
DSCR
20% down · 8.5% · 30yr
- Down + closing
- —
- Monthly P&I
- —
- Monthly cashflow
- —
- DSCR
- —
- Eligible?
- —
No personal income docs; deal must DSCR.
Hard money
10% down · 12.0% · 12mo
- Down + closing
- —
- Monthly P&I
- —
- Monthly cashflow
- —
- DSCR
- —
- Eligible?
- —
Short-term bridge; refi at stabilization.
Rent comps 40 comps
| Address | Beds | Baths | Sqft | Rent | $/sqft | DOM | Units | Dist |
|---|---|---|---|---|---|---|---|---|
| 1312 Hunters Ridge Dr Crowley, TX | 4.0 | 3.0 | 2155 | $2,700 | $1.25 | 12d | 1 | 0.54mi |
| 720 Watson Way Crowley, TX | 3.0 | 2.0 | 1782 | $2,095 | $1.18 | 45d | 1 | 0.88mi |
| 744 Walls Blvd Crowley, TX | 4.0 | 2.0 | 1792 | $2,300 | $1.28 | 45d | 1 | 0.96mi |
| 705 Loftin St Crowley, TX | 3.0 | 2.0 | 1514 | $2,200 | $1.45 | 45d | 1 | 1.01mi |
| 752 Rutherford Dr Crowley, TX | 4.0 | 2.0 | 1856 | $2,209 | $1.19 | 45d | 1 | 1.01mi |
| 708 Cheryl St Crowley, TX | 3.0 | 2.0 | 1659 | $2,100 | $1.27 | 20d | 1 | 1.02mi |
| 625 Hutchins Dr Crowley, TX | 3.0 | 2.0 | 1357 | $1,885 | $1.39 | 45d | 1 | 1.02mi |
| 9125 Nevis Dr Fort Worth, TX | 3.0 | 2.0 | 1497 | $2,159 | $1.44 | 0d | 1 | 1.05mi |
| 2604 Mill Springs Pass Fort Worth, TX | 5.0 | 2.0 | 1822 | $2,340 | $1.28 | 45d | 1 | 1.05mi |
| 552 Kerry St Crowley, TX | 3.0 | 2.0 | 1636 | $2,295 | $1.40 | 3d | 1 | 1.10mi |
| 605 Hidden Dale Dr Fort Worth, TX | 3.0 | 2.0 | 1161 | $1,875 | $1.61 | 45d | 1 | 1.17mi |
| 2720 Gains Mill Dr Fort Worth, TX | 3.0 | 2.0 | 1757 | $2,000 | $1.14 | 0d | 1 | 1.17mi |
| 517 Misty Mountain Dr Fort Worth, TX | 3.0 | 2.0 | 1342 | $2,050 | $1.53 | 0d | 1 | 1.21mi |
| 8457 Asheville Ln Fort Worth, TX | 4.0 | 2.0 | 1796 | $2,049 | $1.14 | 45d | 1 | 1.26mi |
| 8440 Asheville Ln Fort Worth, TX | 4.0 | 2.0 | 2048 | $2,250 | $1.10 | 14d | 1 | 1.29mi |
| 9157 Abaco Way Fort Worth, TX | 4.0 | 2.0 | 1705 | $2,149 | $1.26 | 45d | 1 | 1.29mi |
| 9157 Abaco Way Fort Worth, TX | 4.0 | 2.0 | 1705 | $2,089 | $1.23 | 26d | 1 | 1.29mi |
| 9165 Abaco Way Fort Worth, TX | 4.0 | 2.0 | 1705 | $2,095 | $1.23 | 0d | 1 | 1.30mi |
| 8832 Elk Creek Ln Fort Worth, TX | 5.0 | 2.0 | 2105 | $3,200 | $1.52 | 0d | 1 | 1.34mi |
| 10009 Quail Glen Dr Fort Worth, TX | 3.0 | 2.0 | 1130 | $1,795 | $1.59 | 45d | 1 | 1.35mi |
| 8612 Orleans Ln Fort Worth, TX | 3.0 | 2.0 | 1790 | $1,900 | $1.06 | 45d | 1 | 1.36mi |
| 2808 Adams Fall Ln Fort Worth, TX | 3.0 | 2.0 | 1545 | $2,100 | $1.36 | 45d | 1 | 1.37mi |
| 220 Elk Run Dr Fort Worth, TX | 3.0 | 2.0 | 1781 | $1,965 | $1.10 | 17d | 1 | 1.37mi |
| 824 E Prairie View Rd Crowley, TX | 3.0 | 2.0 | 1120 | $1,795 | $1.60 | 45d | 1 | 1.39mi |
| 708 E Prairie View Rd Crowley, TX | 3.0 | 1.5 | 1080 | $1,750 | $1.62 | 14d | 1 | 1.40mi |
| 433 Heritage Dr Crowley, TX | 3.0 | 2.0 | 1783 | $1,970 | $1.10 | 12d | 1 | 1.40mi |
| 416 Heritage Dr Crowley, TX | 3.0 | 2.0 | 2250 | $2,250 | $1.00 | 4d | 1 | 1.41mi |
| 501 McCurdy St Crowley, TX | 5.0 | 2.0 | 1798 | $2,850 | $1.59 | 22d | 1 | 1.42mi |
| 816 Oriel Cir Crowley, TX | 3.0 | 2.0 | 1540 | $2,400 | $1.56 | 3d | 1 | 1.42mi |
| 237 Kennedy Dr Crowley, TX | 3.0 | 2.0 | 1478 | $1,920 | $1.30 | 0d | 1 | 1.44mi |
| 8564 Charleston Ave Fort Worth, TX | 3.0 | 2.5 | 1463 | $1,875 | $1.28 | 26d | 1 | 1.44mi |
| 2605 Bear Oak Dr Fort Worth, TX | 3.0 | 2.0 | 1337 | $1,950 | $1.46 | 7d | 1 | 1.44mi |
| 8361 Horned Maple Trl Fort Worth, TX | 3.0 | 2.0 | 1523 | $2,200 | $1.44 | 45d | 1 | 1.44mi |
| 10905 Fawn Valley Dr Fort Worth, TX | 3.0 | 2.0 | 1796 | $1,885 | $1.05 | 7d | 1 | 1.45mi |
| 2913 Vicksburg Ln Fort Worth, TX | 3.0 | 2.0 | 1720 | $1,800 | $1.05 | 26d | 1 | 1.46mi |
| 9100 Cranwell Ct Fort Worth, TX | 3.0 | 2.5 | 1748 | $1,950 | $1.12 | 26d | 1 | 1.47mi |
| 10600 Bilsky Bay Dr Fort Worth, TX | 1.0–3.0 | 1.0–2.0 | 914 | $1,765 | $1.93 | 26d | 24 | 1.47mi |
| 3408 Saint Vincent Rd Fort Worth, TX | 3.0 | 2.0 | 1400 | $2,195 | $1.57 | 45d | 1 | 1.48mi |
| 3104 Stonewall Ln Fort Worth, TX | 3.0 | 2.0 | 1112 | $1,725 | $1.55 | 0d | 1 | 1.48mi |
| 200 Kennedy Ct Crowley, TX | 3.0 | 2.0 | 1478 | $1,860 | $1.26 | 45d | 1 | 1.49mi |
Listing history 13 events
-
2026-06-21days on market $268,999 Active 19 DOM
-
2026-06-18days on market $268,999 Active 16 DOM
-
2026-06-17days on market $268,999 Active 15 DOM
-
2026-06-16days on market $268,999 Active 14 DOM
-
2026-06-15days on market $268,999 Active 13 DOM
-
2026-06-13days on market $268,999 Active 11 DOM
-
2026-06-13days on market $268,999 Active 10 DOM
-
2026-06-09days on market $268,999 Active 7 DOM
-
2026-06-08days on market $268,999 Active 6 DOM
-
2026-06-07days on market $268,999 Active 5 DOM
-
2026-06-04days on market $268,999 Active 2 DOM
-
2026-06-02remarks 403-char remark
-
2026-06-02$268,999 Active 1 DOM
ⓘ Source: listings_history table (triggers on properties + properties_extension) + one-shot
backfill from property_details.listing_events for pre-trigger history.
Climate risk First Street
- Flood 1/10 Low FEMA zone X (unshaded) · 0% chance over 30 yrs
- Wildfire 4/10 Moderate
- Heat 7/10 Severe 7 d/yr ≥109°F today · 23 d/yr by 30 yrs out
- Wind 6/10 Major 27% chance of damaging wind over 30 yrs
- Air quality 3/10 Moderate 2 unhealthy d/yr today · 3 by 30 yrs out
Nearby sold comps map
Loading sold comps map…
Walkable amenities ~0.75 mi
Loading nearby amenities…
Taxation est. · year 1
- Rental income
- $28,180
- − Mortgage interest
- −$15,068
- − Property taxes
- −$4,035
- − Insurance
- −$1,345
- − Repairs & maintenance
- −$2,254
- − Management
- −$2,254
- − Depreciation
- −$7,825
- Taxable loss
- −$4,602
- Est. tax savings @ 24.0%
- +$1,105
- After-tax cash flow
- $1,059/yr
For passive investors: Depreciation is non-cash, so a rental often shows a tax loss while cash-flowing — sheltering income. Rental losses are passive: they offset passive income freely, and up to $25,000/yr can offset ordinary (W-2) income if you actively participate and your MAGI is under $100k (phasing out to $0 by $150k); unused losses carry forward. On sale, claimed depreciation is recaptured at up to 25%, and gains may owe capital-gains tax (a 1031 exchange can defer both). Figures are a year-1 estimate at your 24.0% rate — not tax advice; consult a CPA.
Condition & rehab AI · 12 photos
This single-level home features a spacious open floorplan and a well-maintained exterior, making it a good candidate for a cosmetic renovation to enhance its resale and rental value.
Value-add opportunities
- Resale Paint exterior trim — Fresh paint can enhance curb appeal and home value.
- Rental Replace window screens — New screens improve comfort and energy efficiency for renters.
Renovation cost estimate screening
Value-add ROI direction
- Resale Paint exterior trim — Fresh paint can enhance curb appeal and home value. ↑
- Rental Replace window screens — New screens improve comfort and energy efficiency for renters. ↑
ⓘ Cost ranges are severity-bucket heuristics (US national rule-of-thumb). Get contractor quotes + a written scope before underwriting a rehab budget.
Schools (NCES district)
- District
- Crowley ISD
- NCES district ID
- 4815910
- Math proficiency
- 23% ▼ -15.00%
- Reading proficiency
- 32% ▼ -6.00%
- Median HH income
- $59,810
- Composite
- 25.04/100
- National rank
- #7549
- State rank
- #643 of 826 in TX
Livability — Fort Worth
- Score
- 80/100
- State rank
- #49
- US rank
- #1954
Category grades
Schools grade is shown separately in the Schools card above.
Census & demographics
- Census place
- Fort Worth, TX
- County
- Tarrant County · 2,033,669 people
- City population
- 911,619
- Metro
- Dallas-Fort Worth-Arlington, TX
- Population (ZIP)
- 36,044
- Household income
- $97,973
- Rent vs Own
- Severe rent burden
- 584.0
Population outlook (Tarrant County) Hauer SSP2
- Today (2025)
- 2,380,417 people
- By 2030
- 2,578,900 · +8.3%
- By 2040
- 2,974,995 · +25.0%
- By 2050
- 3,350,489 · +40.8%
- By 2075
- 4,216,909 · +77.2%
- By 2100
- 4,741,527 · +99.2%
Race, ethnicity, and origin ACS 2023
- Neighborhood character
- Diverse neighborhood (Simpson 0.65)
- Race & ethnicity
- White 48% Hispanic / Latino 28% Black 20% Two or more races 14% Asian 2%
- Hispanic origin (detail)
- Mexican 23% Puerto Rican 2%
- Common ancestry
- Slovak 3% Italian 2% Serbian 1%
- Foreign-born
- 8% · Canada, Vietnam
- Languages at home
- 79% English-only · Spanish 18% Other Indo-European 1% Vietnamese 1%
Political lean MEDSL · Tarrant
- 2024 margin
- Lean R (+5.1) · D 46.7% · R 51.9% · Other 1.4%
- 2008→2024 swing
- +6.6pp toward D · 2008: -11.7pp · 2024: -5.1pp
- All cycles
- 2024: R+5.1 2020: D+0.2 2016: R+8.7 2012: R+15.7 2008: R+11.7
Not yet ingested
- Civics
- —
Market trends
- HPI YoY
- ▼ -80.45%
- Current HPI
- 238.6365
- Rent YoY
- ▲ 2.28%
- Metro
- Dallas-Fort Worth-Arlington, TX
- State GDP YoY
- ▲ 3.95%
- F500 in state
- 110
Industry mix (Fortune 500 HQ in TX)
| Industry | F500 HQs | Revenue |
|---|---|---|
| Energy | 16 | $1,198B |
|
||
| Technology | 5 | $198B |
|
||
| Engineering / Construction | 4 | $72B |
|
||
| Energy Services | 3 | $60B |
|
||
| Utilities | 3 | $41B |
|
||
| Healthcare | 2 | $330B |
|
||
Cash-flow waterfall
monthlySold comps — $/sqft
last 12 mo · ≤1 miLoading sold comps…