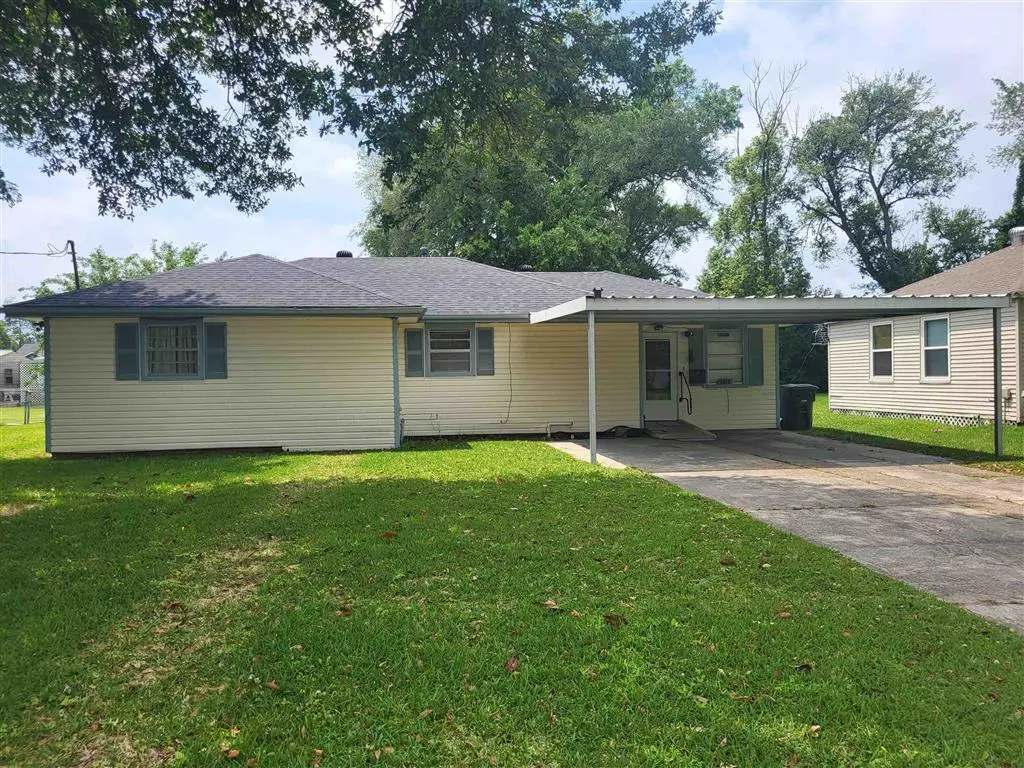
3810 Vanderbilt · Lake Charles, LA
Flood risk 4/10 · Minor
- FEMA flood zone
- X (unshaded)
- Chance of flooding over 30 yrs
- 0.22%
- Est. flood insurance / yr
- $507 – $1,088
Fire risk 1/10 · Minimal
- Est. fire insurance / yr
- $1,269 – $2,357
Heat risk 9/10 · Severe
- Hot days now (above 109°F)
- 7 days/yr
- Hot days in 30 yrs
- 22 days/yr
Wind risk 9/10 · Severe
- Chance of severe wind over 30 yrs
- 99.0%
Air-quality risk 2/10 · Minimal
- Unhealthy air days now
- 1 days/yr
- Unhealthy air days in 30 yrs
- 1 days/yr
Risk factors via First Street. Map © Google.
Why this score? — see what drove the B- grade
The composite is a weighted blend of 9 inputs, each scored 0–100. Each bar is that input's sub-score; the figure is the points it added to the 100-point composite (weight × sub-score).
- Cash flow +26.1/30.0
- ARV discount +15.0/15.0
- DSCR +8.8/10.0
- 1% rule +5.8/10.0
- Rent growth +4.6/5.0
- Livability +3.4/5.0
- Schools +3.1/10.0
- Condition / age +2.5/5.0
- Appreciation +0.0/10.0
$140,000
🖨 Deal sheet 📄 Offer letter ✓ Due diligence
Listing remarks
Charming 3-bedroom, 2-bath home conveniently located near McNeese University. This property features a spacious living area that flows seamlessly into the kitchen, complete with an island bar—perfect for entertaining. Much of the home showcases original hardwood flooring, adding timeless character and warmth. While the home could benefit from updates, it offers incredible potential to be restored to its original beauty. Enjoy outdoor living on the large screened-in back porch overlooking a fenced backyard, all shaded by beautiful, mature oak trees. A wonderful opportunity to create your dream home or investment property in a desirable location.
Key facts
- Mature oak trees
- Spacious living area
- Island bar
Tags
Neighborhood map
What this means for you Summary
Snapshot
- This is a 3-bed/2.0-bath single-family listed at $140k.
Deal economics
- At list price, monthly cash flow is $352 ($4k/yr) — positive.
- The deal already cash-flows at list — no discount required.
- Meets the 1% rule at list price ($2k rent vs $140k).
- Recommended offer: $138k (1.5% below list) — sets the bar for market timing.
- Cap rate 9.3% vs local median 4.3% in Lake Charles — top-decile yield for the area; either an underpriced asset or a hidden risk that comps aren't pricing in. Stress-test before assuming the spread holds.
Location & tenants
- Location reads 68/100 on livability (#95 in LA) — a middle-class / working-renter tenant base. Strengths: commute A+, cost of living A+, housing A+; Watch: crime F, amenities F, employment D-.
- Calcasieu Parish (other): math 30% / reading 44% proficiency, ranked #29 of 98 in LA (top 30%) — families likely to look elsewhere, expect single-tenant / working-renter base with shorter leases.
- Market conditions: Rents rising fast (+8.6%/yr); 567 active listings in the ZIP; 14 comparable units currently listed for rent nearby; rentals at typical pace (median 22d on market — plan ~3-4 weeks tenant-placement turnaround); 1,298 units permitted in Calcasieu Parish in 2024 (526 in 5+ unit buildings).
- This rent runs 30% of the median local income ($60k/yr) — at the standard rent-burdened threshold; future hikes will face affordability resistance.
Forward outlook
- Local home prices are declining (-3.0%/yr); year-one equity from $968 of loan paydown is wiped out by about $4k of value loss. Plan a longer hold.
- Calcasieu County population projected at +11% by 2050 — modest demand growth; plan on rents tracking national, not racing it.
- At projected returns (-3.0% appreciation + 8.0% rent growth), your $39k cash investment doubles in ~8 years — after that, you're playing with house money.
Negotiation context
- It's been on market 21 days — a 2% lower offer ($138k) is reasonable based on typical stale-listing flexibility.
Risks & watch-outs
- Climate carrying-cost: severe wind risk, 99% chance of damaging wind over 30y; extreme-heat days projected 7→22/yr by 2055 (HVAC capex compounding) — expect insurance premiums to compound above CPI over the hold.
Questions for the listing agent
- Built in 1960 — when were the roof, HVAC, electrical panel, plumbing, and water heater last replaced?
- Is there a deadline driving the sale (1031 exchange, divorce, estate, relocation)? That informs how much negotiation room exists.
- Schools are B-rated — typically a magnet for longer-tenancy family renters. What's the average tenant stay here, and is there a school-zone premium baked into asking?
- Crime grade is F in this area — have there been break-ins, vandalism, or insurance claims at this property in the last 3 years? What carrier currently insures it and at what premium?
- What's the average days-on-market for RENTAL listings here right now (not sales)? A rising rental-DOM trend means longer vacancies and softer asking-rent achievability than the comps imply.
- What's the recent tenant-quality profile in this submarket — average credit score on applications, eviction rate, late-payment / NSF rate, and stable-employment percentage? A property-management company in the area should have these aggregated.
- How much new for-sale + rental construction is in the pipeline within 1–3 miles? Heavy new supply typically softens prices + rents 12–24 months out; constrained supply supports both.
Investment metrics
- 1% rule
- 1.08% ✓
- Cap rate
- 9.31%
- Cash-on-cash
- 10.78%
- DSCR
- 1.48
- GRM
- 7.7
CMA / ARV
- ARV (median comp)
- $172,325
- List price
- $140,000
- Delta
- -18.76%
- Verdict
- UNDERPRICED
- Comps
- 20 within 1.0 mi
Show comp detail 12 sales within ~0.75 mi
| Address | Dist | Beds/Ba | Sqft | Sold | Price | $/sf | Match |
|---|---|---|---|---|---|---|---|
| 1205 Tulane St | 0.27mi | 3/2.0 | 1,620 (+1%) | 4mo | $148,000 | $91 | 83 |
| 3705 Auburn St | 0.29mi | 3/2.0 | 1,604 (-0%) | 8mo | $110,000 | $69 | 79 |
| 3705 Harvard St | 0.19mi | 3/2.0 | 1,520 (-6%) | 4mo | $160,500 | $106 | 78 |
| 3802 Auburn St | 0.30mi | 3/2.0 | 1,678 (+4%) | 4mo | $169,000 | $101 | 76 |
| 3905 Hodges St | 0.48mi | 3/2.0 | 1,582 (-2%) | 1mo | $124,900 | $79 | 74 |
| 3824 Harvard St | 0.16mi | 3/2.0 | 1,450 (-10%) | 7mo | $210,000 | $145 | 70 |
| 1212 E School St E | 0.34mi | 3/2.0 | 1,830 (+14%) | 3mo | $160,000 | $87 | 59 |
| 3526 Center St | 0.39mi | 3/1.0 | 1,805 (+12%) | 1mo | $75,000 | $42 | 57 |
| 3818 Hodges St | 0.50mi | 4/2.0 (+1) | 1,414 (-12%) | 7mo | $123,000 | $87 | 45 |
| 1309 Rosetta St | 0.49mi | 3/1.0 | 1,383 (-14%) | 6mo | $55,300 | $40 | 45 |
| 1016 Cherryhill St | 0.72mi | 3/2.0 | 1,444 (-10%) | 7mo | $200,000 | $139 | 44 |
| 4041 Fourden | 0.67mi | 3/— | 1,370 (-15%) | 3mo | $145,000 | $106 | 42 |
Match score weights: distance 35% · size 25% · config 20% · recency 20%. Top-matched comps best support the ARV.
Projected returns pro-forma
-3.0% appreciation · 8.0% rent growth · sell at horizon
- IRR
- 4.8%
- Equity multiple
- 1.20×
- Total profit
- $7,676
- Equity at exit
- $20,874
- IRR
- 18.1%
- Equity multiple
- 2.83×
- Total profit
- $71,681
- Equity at exit
- $12,105
Cash invested: $39,200 (down + closing). Projections, not guarantees.
Landlord ↔ Tenant lean methodology
- Overall (STATE)
- 90 Strongly Landlord-Friendly
- State Louisiana
- 90 Strongly Landlord-Friendly · R+12
- County
- — inherits STATE
- City
- — inherits STATE
ZIP-level market 70607
- Rents YoY
- 8.6%
- Active inventory
- 567
- Price-to-rent
- 7.7×
Monthly cashflow live
- Estimated rent
- $1,510 high interval (Pro) →
- Mortgage (P&I)
- −$734
- Tax from tax record
- −$49 /mo · $582/yr
- Insurance
- −$58
- HOA
- −$0
- Vacancy / Maint / Mgmt
- −$317
- Net cashflow
- $352
Break-even live
UW: 25.0% down · 7.5% · 30yr · 1.5% tax · 5.0% vac · 8.0% maint · 8.0% mgmt
Financing live
Cash to close
- Down payment
- $35,000
- Closing costs
- $4,200
- Reserves months
- —
- Total cash needed
- —
Loan-product check · same deal, 3 products live
Conventional
25% down · 7.5% · 30yr
- Down + closing
- —
- Monthly P&I
- —
- Monthly cashflow
- —
- DSCR
- —
- Eligible?
- —
Personal DTI + credit; lowest rate.
DSCR
20% down · 8.5% · 30yr
- Down + closing
- —
- Monthly P&I
- —
- Monthly cashflow
- —
- DSCR
- —
- Eligible?
- —
No personal income docs; deal must DSCR.
Hard money
10% down · 12.0% · 12mo
- Down + closing
- —
- Monthly P&I
- —
- Monthly cashflow
- —
- DSCR
- —
- Eligible?
- —
Short-term bridge; refi at stabilization.
Rent comps 14 comps
| Address | Beds | Baths | Sqft | Rent | $/sqft | DOM | Units | Dist |
|---|---|---|---|---|---|---|---|---|
| 930 Azalea St Lake Charles, LA | 4.0 | 2.0 | 1658 | $1,500 | $0.90 | 21d | 1 | 0.35mi |
| 617 E School St Unit A Lake Charles, LA | 3.0 | 2.0 | 1800 | $2,500 | $1.39 | 44d | 1 | 0.38mi |
| 807 Camelia St Lake Charles, LA | 3.0 | 1.0 | 1322 | $1,500 | $1.13 | 44d | 1 | 0.44mi |
| 4128 Center St Lake Charles, LA | 4.0 | 2.0 | 2227 | $1,500 | $0.67 | 44d | 1 | 0.45mi |
| 417 E Claude St Lake Charles, LA | 4.0 | 1.0 | 1610 | $1,400 | $0.87 | 44d | 1 | 0.46mi |
| 3601 1st Ave Lake Charles, LA | 3.0 | 2.0 | 1512 | $1,295 | $0.86 | 13d | 1 | 0.52mi |
| 1509 Sage Dr Lake Charles, LA | 4.0 | 1.0 | 1157 | $1,195 | $1.03 | 21d | 1 | 0.70mi |
| 3619 Texas St Lake Charles, LA | 1.0–3.0 | 1.0–2.0 | 950 | $1,087 | $1.14 | 13d | 6 | 0.77mi |
| 3206 Louisiana Ave Lake Charles, LA | 4.0 | 2.0 | 1600 | $1,600 | $1.00 | 13d | 1 | 0.80mi |
| 114 W Lagrange St Apt 18 Lake Charles, LA | 2.0 | 1.0 | 1200 | $1,300 | $1.08 | 21d | 1 | 0.88mi |
| 3206 Hodges St Lake Charles, LA | 2.0 | 1.0 | 1497 | $1,200 | $0.80 | 44d | 1 | 0.89mi |
| 3108 Aster St Unit M Lake Charles, LA | 2.0 | 1.0 | 1100 | $1,300 | $1.18 | 13d | 1 | 0.95mi |
| 1300 16th St Lake Charles, LA | 2.0 | 1.5 | 1344 | $1,295 | $0.96 | 21d | 1 | 1.41mi |
| 2700 Ernest St Lake Charles, LA | 1.0–3.0 | 1.0–2.0 | 1054 | $1,598 | $1.52 | 13d | 1 | 1.48mi |
Listing history 1 events
-
2026-05-03$140,000 Active 658-char remark
ⓘ Source: listings_history table (triggers on properties + properties_extension) + one-shot
backfill from property_details.listing_events for pre-trigger history.
Tax reassessment forecast LA · Resets to sale price
- Current annual tax
- $582 · $49/mo
- Projected year-2 tax
- $770 · $64/mo
- Expected delta
- +$188/yr (+$16/mo · 32.2%)
ⓘ Screening estimate from a state-policy table — verify with the county assessor before closing.
Climate risk First Street
- Flood 4/10 Moderate FEMA zone X (unshaded) · 22% chance over 30 yrs
- Wildfire 1/10 Low
- Heat 9/10 Extreme 7 d/yr ≥109°F today · 22 d/yr by 30 yrs out
- Wind 9/10 Extreme 99% chance of damaging wind over 30 yrs
- Air quality 2/10 Low 1 unhealthy d/yr today · 1 by 30 yrs out
Nearby sold comps map
Loading sold comps map…
Walkable amenities ~0.75 mi
Loading nearby amenities…
Taxation est. · year 1
- Rental income
- $18,126
- − Mortgage interest
- −$7,842
- − Property taxes
- −$582
- − Insurance
- −$700
- − Repairs & maintenance
- −$1,450
- − Management
- −$1,450
- − Depreciation
- −$4,073
- Taxable income
- $2,028
- Est. tax owed @ 24.0%
- −$487
- After-tax cash flow
- $3,740/yr
For passive investors: Depreciation is non-cash, so a rental often shows a tax loss while cash-flowing — sheltering income. Rental losses are passive: they offset passive income freely, and up to $25,000/yr can offset ordinary (W-2) income if you actively participate and your MAGI is under $100k (phasing out to $0 by $150k); unused losses carry forward. On sale, claimed depreciation is recaptured at up to 25%, and gains may owe capital-gains tax (a 1031 exchange can defer both). Figures are a year-1 estimate at your 24.0% rate — not tax advice; consult a CPA.
Schools (NCES district)
- District
- Calcasieu Parish
- NCES district ID
- 2200330
- Math proficiency
- 30% ▼ -39.00%
- Reading proficiency
- 44% ▼ -33.00%
- Median HH income
- $44,700
- Composite
- 31.45/100
- National rank
- #5979
- State rank
- #29 of 98 in LA
Livability — Lake Charles
- Score
- 68/100
- State rank
- #95
- US rank
- #9820
Category grades
Schools grade is shown separately in the Schools card above.
Census & demographics
- Census place
- Lake Charles, LA
- County
- Calcasieu Parish · 170,889 people
- City population
- 133,538
- Metro
- Lake Charles, LA
- Population (ZIP)
- 27,080
- Household income
- $60,351
- Rent vs Own
- Severe rent burden
- 1267.0
Population outlook (Calcasieu County) Hauer SSP2
- Today (2025)
- 212,179 people
- By 2030
- 218,199 · +2.8%
- By 2040
- 228,486 · +7.7%
- By 2050
- 236,208 · +11.3%
- By 2075
- 251,696 · +18.6%
- By 2100
- 247,848 · +16.8%
Race, ethnicity, and origin ACS 2023
- Neighborhood character
- Diverse neighborhood (Simpson 0.65)
- Race & ethnicity
- White 46% Black 36% Two or more races 11% Hispanic / Latino 6% Asian 2%
- Hispanic origin (detail)
- Mexican 1%
- Common ancestry
- Lithuanian 10% Serbian 1%
- Foreign-born
- 5% · Canada, Vietnam
- Languages at home
- 93% English-only · Spanish 4% French/Haitian/Cajun 2% Other Indo-European 1%
Political lean MEDSL · Calcasieu
- 2024 margin
- Solid R (+39.6) · D 29.5% · R 69.0% · Other 1.5%
- 2008→2024 swing
- -15.0pp toward R · 2008: -24.6pp · 2024: -39.6pp
- All cycles
- 2024: R+39.6 2020: R+35.2 2016: R+33.3 2012: R+28.7 2008: R+24.6
Not yet ingested
- Civics
- —
Market trends
- HPI YoY
- ▼ -91.59%
- Current HPI
- 93.679
- Rent YoY
- ▲ 8.55%
- Metro
- Lake Charles, LA
- State GDP YoY
- ▲ 3.29%
- F500 in state
- 10
Industry mix (Fortune 500 HQ in LA)
| Industry | F500 HQs | Revenue |
|---|---|---|
| Telecommunications | 2 | $23B |
|
||
| Utilities | 1 | $12B |
|
||
| Wholesale / Distribution | 1 | $5B |
|
||
| Advertising | 1 | $2B |
|
||
Property tax history
-0.5%/yrLatest (2025): $582 · +1.3% YoY. Source: county tax records.
Cash-flow waterfall
monthlySold comps — $/sqft
last 12 mo · ≤1 miLoading sold comps…