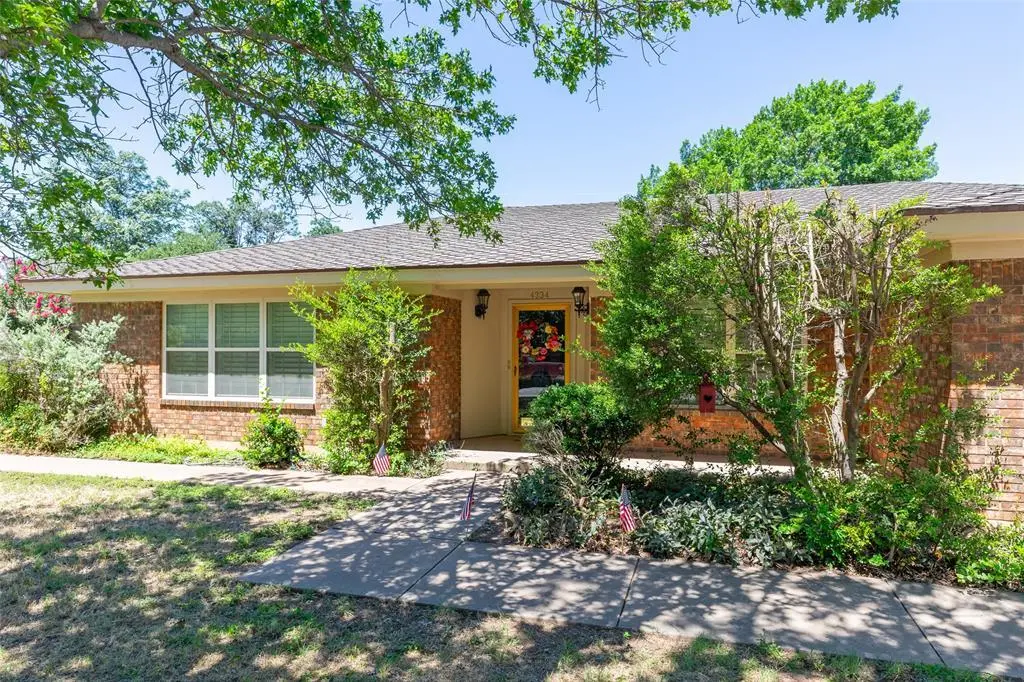
4334 Caprock Rd · Abilene, TX
Flood risk No data
- FEMA flood zone
- —
- Chance of flooding over 30 yrs
- %
- Est. flood insurance / yr
- —
Fire risk No data
- Est. fire insurance / yr
- —
Heat risk No data
- Hot days now (above °F)
- days/yr
- Hot days in 30 yrs
- days/yr
Wind risk No data
- Chance of severe wind over 30 yrs
- %
Air-quality risk No data
- Unhealthy air days now
- days/yr
- Unhealthy air days in 30 yrs
- days/yr
Risk factors via First Street. Map © Google.
Why this score? — see what drove the D+ grade
The composite is a weighted blend of 9 inputs, each scored 0–100. Each bar is that input's sub-score; the figure is the points it added to the 100-point composite (weight × sub-score).
- Cash flow +18.0/30.0
- DSCR +5.6/10.0
- Rent growth +5.0/5.0
- 1% rule +4.8/10.0
- ARV discount +4.5/15.0
- Livability +3.8/5.0
- Schools +2.8/10.0
- Condition / age +2.5/5.0
- Appreciation +0.0/10.0
$359,900
🖨 Deal sheet 📄 Offer letter ✓ Due diligence
Listing remarks
Spacious Southside Home in Abilene ISD! Welcome to this well-maintained, one-owner home offering 2,834 square feet of comfortable living space and exceptional pride of ownership throughout. Designed with families in mind, this spacious residence features 4 bedrooms, 2 bathrooms, 2 living areas, and 2 dining areas, providing plenty of room for everyday living and entertaining. The thoughtfully designed floor plan includes beautiful built-ins, classic plantation shutters, and a bright sunroom that offers additional flexible living space. The kitchen is equipped with updated appliances and ample workspace, making meal preparation a pleasure. Step outside to enjoy the covered patio and pergola
Key facts
- One-owner home
- Plantation shutters
- Sunroom
Tags
Neighborhood map
What this means for you Summary
Snapshot
- This is a 4-bed/2.0-bath single-family listed at $360k.
Deal economics
- At list price, monthly cash flow is $311 ($4k/yr) — positive.
- The deal already cash-flows at list — no discount required.
- To meet the 1% rule (rent ≥ 1% of price), the offer needs to be $354k (1.6% below list).
- Recommended offer: $354k (1.6% below list) — sets the bar for 1% rule.
Location & tenants
- Location reads 75/100 on livability (#142 in TX, #4,037 nationally) — a middle-class / working-renter tenant base. Strengths: cost of living A+, housing A+, health & safety A+; Watch: schools D+, crime D, commute F.
- Abilene ISD (urban): math 32% / reading 34% proficiency, ranked #575 of 826 in TX (top 70%) — families likely to look elsewhere, expect single-tenant / working-renter base with shorter leases.
- Market conditions: Rents rising fast (+40.7%/yr); 288 active listings in the ZIP; 7 comparable units currently listed for rent nearby; rentals at typical pace (median 21d on market — plan ~3-4 weeks tenant-placement turnaround); solid renter incomes; 508 units permitted in Taylor County in 2024 (0 in 5+ unit buildings).
- At $3,542/mo this rent would consume 54% of the median local household income ($79k/yr) (locally 1181% of renters already pay >50% of income on rent) — very limited rent-growth headroom before tenants either downsize or default.
Forward outlook
- Local home prices are declining (-3.0%/yr); year-one equity from $2k of loan paydown is wiped out by about $11k of value loss. Plan a longer hold.
- Taylor County population projected at +16% by 2050 — long-run rental-demand tailwind backs the buy-and-hold thesis.
- At projected returns (-3.0% appreciation + 8.0% rent growth), your $101k cash investment doubles in ~10 years — after that, you're playing with house money.
Negotiation context
- Only 1 days on market — expect competitive offers; lowballing is unlikely to land.
Questions for the listing agent
- Built in 1971 — when were the roof, HVAC, electrical panel, plumbing, and water heater last replaced?
- Is there a deadline driving the sale (1031 exchange, divorce, estate, relocation)? That informs how much negotiation room exists.
- Schools are D-rated, which usually means shorter tenancies and higher turnover. Who's the typical renter profile here, and what's been the actual vacancy rate?
- Crime grade is D in this area — have there been break-ins, vandalism, or insurance claims at this property in the last 3 years? What carrier currently insures it and at what premium?
- The area grade is low — what's the realistic commute time and amenity access for the typical tenant pool here? Any planned neighborhood developments (good or bad) we should know about?
- What's the average days-on-market for RENTAL listings here right now (not sales)? A rising rental-DOM trend means longer vacancies and softer asking-rent achievability than the comps imply.
- What's the recent tenant-quality profile in this submarket — average credit score on applications, eviction rate, late-payment / NSF rate, and stable-employment percentage? A property-management company in the area should have these aggregated.
- How much new for-sale + rental construction is in the pipeline within 1–3 miles? Heavy new supply typically softens prices + rents 12–24 months out; constrained supply supports both.
Investment metrics
- 1% rule
- 0.98% ✗
- Cap rate
- 7.33%
- Cash-on-cash
- 3.70%
- DSCR
- 1.16
- GRM
- 8.5
CMA / ARV
- ARV (on-the-fly)
- $337,246
- Comps found
- 7
Show comp detail 7 sales within ~0.75 mi
| Address | Dist | Beds/Ba | Sqft | Sold | Price | $/sf | Match |
|---|---|---|---|---|---|---|---|
| 2601 Gilmer Ave | 0.34mi | 3/2.0 (-1) | 2,637 (-7%) | 15mo | $175,000 | $66 | 55 |
| 2401 Helena Cir | 0.45mi | 4/2.0 | 2,501 (-12%) | 7mo | $349,990 | $140 | 53 |
| 2258 Rim Rock | 0.72mi | 4/3.0 | 3,015 (+6%) | 4mo | $360,000 | $119 | 48 |
| 2 Lake Point Cir | 0.53mi | 3/3.5 (-1) | 2,918 (+3%) | 22mo | $449,000 | $154 | 41 |
| 3526 Paint Brush Dr | 0.58mi | 4/3.0 | 2,451 (-14%) | 9mo | $240,000 | $98 | 39 |
| 2518 Helena Cir | 0.38mi | 5/3.0 (+1) | 2,411 (-15%) | 23mo | $299,000 | $124 | 29 |
| 2349 Cooke St | 0.72mi | 5/3.0 (+1) | 2,577 (-9%) | 18mo | $149,900 | $58 | 27 |
Match score weights: distance 35% · size 25% · config 20% · recency 20%. Top-matched comps best support the ARV.
Projected returns pro-forma
-3.0% appreciation · 8.0% rent growth · sell at horizon
- IRR
- -5.0%
- Equity multiple
- 0.80×
- Total profit
- $-19,749
- Equity at exit
- $53,662
- IRR
- 9.8%
- Equity multiple
- 1.93×
- Total profit
- $93,707
- Equity at exit
- $31,118
Cash invested: $100,772 (down + closing). Projections, not guarantees.
Landlord ↔ Tenant lean methodology
- Overall (STATE)
- 87 Strongly Landlord-Friendly
- State Texas
- 87 Strongly Landlord-Friendly · R+5
- County
- — inherits STATE
- City
- — inherits STATE
ZIP-level market 79606
- Rents YoY
- 40.7%
- Active inventory
- 288
- Price-to-rent
- 8.5×
Monthly cashflow live
- Estimated rent
- $3,542 high interval (Pro) →
- Mortgage (P&I)
- −$1,887
- Tax est. 1.5%
- −$450 /mo · $5,398/yr
- Insurance
- −$150
- HOA
- −$0
- Vacancy / Maint / Mgmt
- −$744
- Net cashflow
- $311
Break-even live
UW: 25.0% down · 7.5% · 30yr · 1.5% tax · 5.0% vac · 8.0% maint · 8.0% mgmt
Financing live
Cash to close
- Down payment
- $89,975
- Closing costs
- $10,797
- Reserves months
- —
- Total cash needed
- —
Loan-product check · same deal, 3 products live
Conventional
25% down · 7.5% · 30yr
- Down + closing
- —
- Monthly P&I
- —
- Monthly cashflow
- —
- DSCR
- —
- Eligible?
- —
Personal DTI + credit; lowest rate.
DSCR
20% down · 8.5% · 30yr
- Down + closing
- —
- Monthly P&I
- —
- Monthly cashflow
- —
- DSCR
- —
- Eligible?
- —
No personal income docs; deal must DSCR.
Hard money
10% down · 12.0% · 12mo
- Down + closing
- —
- Monthly P&I
- —
- Monthly cashflow
- —
- DSCR
- —
- Eligible?
- —
Short-term bridge; refi at stabilization.
Rent comps 7 comps
| Address | Beds | Baths | Sqft | Rent | $/sqft | DOM | Units | Dist |
|---|---|---|---|---|---|---|---|---|
| 2510 Gilmer Ave Abilene, TX | 3.0 | 2.0 | 1974 | $2,995 | $1.52 | 43d | 1 | 0.31mi |
| 2418 Helena Cir Abilene, TX | 4.0 | 2.5 | 2478 | $3,700 | $1.49 | 10d | 1 | 0.38mi |
| 4617 Catclaw Dr Abilene, TX | 4.0 | 2.0 | 2263 | $2,500 | $1.10 | 13d | 1 | 1.01mi |
| 5400 Ridgeline Dr Abilene, TX | 3.0 | 2.0 | 2571 | $6,000 | $2.33 | 24d | 1 | 1.12mi |
| 3409 High Meadows Dr Abilene, TX | 3.0 | 2.0 | 1987 | $2,995 | $1.51 | 20d | 1 | 1.28mi |
| 2929 Sayles Blvd Abilene, TX | 4.0 | 2.0 | 2384 | $6,000 | $2.52 | 13d | 1 | 1.36mi |
| 25 Juniper Cir Abilene, TX | 4.0 | 3.0 | 2557 | $3,500 | $1.37 | 43d | 1 | 1.47mi |
Listing history 2 events
-
2026-06-19remarks 699-char remark
-
2026-06-19$359,900 Active 1 DOM
ⓘ Source: listings_history table (triggers on properties + properties_extension) + one-shot
backfill from property_details.listing_events for pre-trigger history.
Nearby sold comps map
Loading sold comps map…
Walkable amenities ~0.75 mi
Loading nearby amenities…
Taxation est. · year 1
- Rental income
- $42,502
- − Mortgage interest
- −$20,160
- − Property taxes
- −$5,398
- − Insurance
- −$1,800
- − Repairs & maintenance
- −$3,400
- − Management
- −$3,400
- − Depreciation
- −$10,470
- Taxable loss
- −$2,126
- Est. tax savings @ 24.0%
- +$510
- After-tax cash flow
- $4,241/yr
For passive investors: Depreciation is non-cash, so a rental often shows a tax loss while cash-flowing — sheltering income. Rental losses are passive: they offset passive income freely, and up to $25,000/yr can offset ordinary (W-2) income if you actively participate and your MAGI is under $100k (phasing out to $0 by $150k); unused losses carry forward. On sale, claimed depreciation is recaptured at up to 25%, and gains may owe capital-gains tax (a 1031 exchange can defer both). Figures are a year-1 estimate at your 24.0% rate — not tax advice; consult a CPA.
Schools (NCES district)
- District
- Abilene ISD
- NCES district ID
- 4807440
- Math proficiency
- 32% ▼ -11.00%
- Reading proficiency
- 34% ▼ -5.00%
- Median HH income
- $39,782
- Composite
- 27.71/100
- National rank
- #6909
- State rank
- #575 of 826 in TX
Livability — Abilene
- Score
- 75/100
- State rank
- #142
- US rank
- #4037
Category grades
Schools grade is shown separately in the Schools card above.
Census & demographics
- Census place
- Abilene, TX
- County
- Taylor County · 136,672 people
- City population
- 136,672
- Metro
- Abilene, TX
- Population (ZIP)
- 29,182
- Household income
- $79,196
- Rent vs Own
- Severe rent burden
- 1181.0
Population outlook (Taylor County) Hauer SSP2
- Today (2025)
- 145,270 people
- By 2030
- 150,050 · +3.3%
- By 2040
- 159,417 · +9.7%
- By 2050
- 168,883 · +16.3%
- By 2075
- 194,436 · +33.8%
- By 2100
- 203,163 · +39.9%
Race, ethnicity, and origin ACS 2023
- Neighborhood character
- Predominantly White (69%)
- Race & ethnicity
- White 69% Hispanic / Latino 19% Two or more races 11% Black 6% Asian 4%
- Hispanic origin (detail)
- Mexican 14%
- Common ancestry
- Italian 4% Slovak 2% Serbian 1%
- Foreign-born
- 7% · Canada, Vietnam
- Languages at home
- 86% English-only · Spanish 10% Tagalog/Filipino 1% Other Indo-European 1%
Political lean MEDSL · Taylor
- 2024 margin
- Solid R (+49.8) · D 24.6% · R 74.4% · Other 1.0%
- 2008→2024 swing
- -4.2pp toward R · 2008: -45.6pp · 2024: -49.8pp
- All cycles
- 2024: R+49.8 2020: R+45.3 2016: R+51.1 2012: R+53.6 2008: R+45.6
Not yet ingested
- Civics
- —
Market trends
- HPI YoY
- ▼ -167.33%
- Current HPI
- 179.2555
- Rent YoY
- ▲ 40.73%
- Metro
- Abilene, TX
- State GDP YoY
- ▲ 3.95%
- F500 in state
- 110
Industry mix (Fortune 500 HQ in TX)
| Industry | F500 HQs | Revenue |
|---|---|---|
| Energy | 16 | $1,198B |
|
||
| Technology | 5 | $198B |
|
||
| Engineering / Construction | 4 | $72B |
|
||
| Energy Services | 3 | $60B |
|
||
| Utilities | 3 | $41B |
|
||
| Healthcare | 2 | $330B |
|
||
Cash-flow waterfall
monthlySold comps — $/sqft
last 12 mo · ≤1 miLoading sold comps…