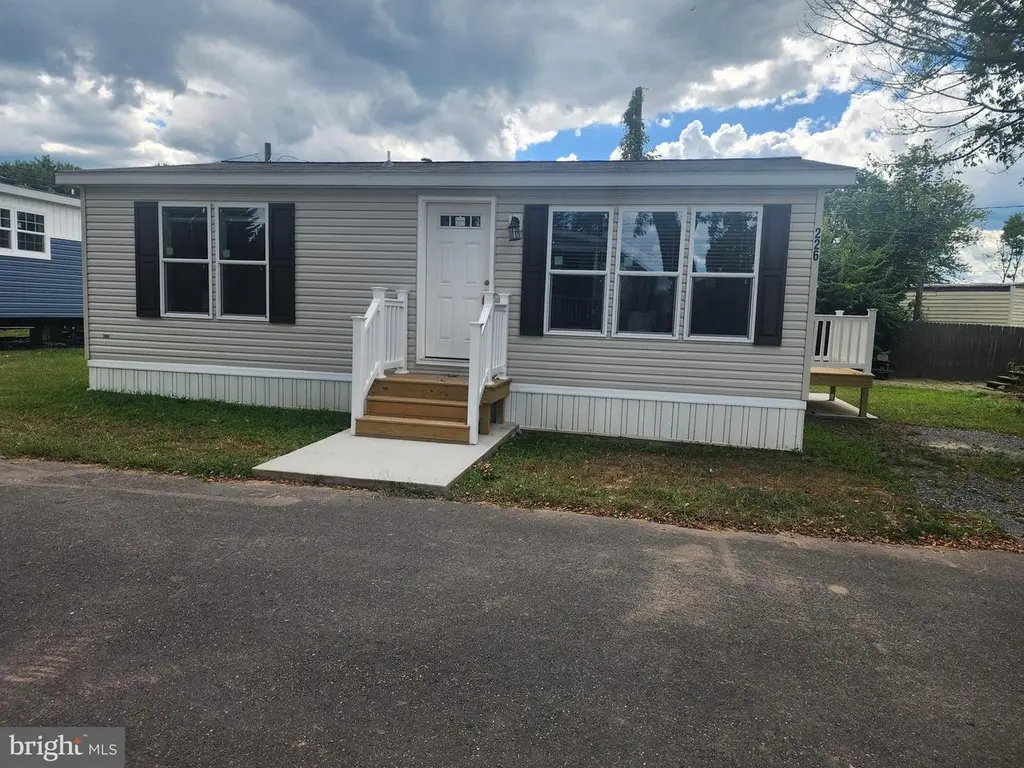
165 W Ridge Pike Lot 226 · Trappe, PA
Flood risk 1/10 · Minimal
- FEMA flood zone
- X (unshaded)
- Chance of flooding over 30 yrs
- 0.0%
- Est. flood insurance / yr
- $507 – $1,088
Fire risk 2/10 · Minimal
- Est. fire insurance / yr
- $511 – $949
Heat risk 5/10 · Moderate
- Hot days now (above 100°F)
- 7 days/yr
- Hot days in 30 yrs
- 14 days/yr
Wind risk 6/10 · Moderate
- Chance of severe wind over 30 yrs
- 27.0%
Air-quality risk 4/10 · Minor
- Unhealthy air days now
- 3 days/yr
- Unhealthy air days in 30 yrs
- 6 days/yr
Risk factors via First Street. Map © Google.
Why this score? — see what drove the C+ grade
The composite is a weighted blend of 9 inputs, each scored 0–100. Each bar is that input's sub-score; the figure is the points it added to the 100-point composite (weight × sub-score).
- Cash flow +30.0/30.0
- DSCR +10.0/10.0
- 1% rule +8.1/10.0
- Schools +6.1/10.0
- Livability +4.0/5.0
- Condition / age +2.5/5.0
- Rent growth +2.2/5.0
- ARV discount +0.0/15.0
- Appreciation +0.0/10.0
$167,500
🖨 Deal sheet (PDF) 📄 Offer letter ✓ Due diligence
Listing remarks MLS
* * * New Construction * * * 2 bedroom 1 bath home. 165 W Ridge Pike lot 226 Limerick PA 19468 This home has it all. A great location in Limerick, PA. Energy star windows and doors make this home very energy efficient. With full warranties on the entire home your covered. Custom kitchen with stainless steel appliances also included. Large living room. Financing is available with our three major lenders and rates are dropping. Now is the best time to jump into a new home. Schedule your private showing today.
Key facts
- Custom kitchen
- New construction
- Energy star windows
Tags
Neighborhood map
What this means for you Summary
Snapshot
- This is a 2-bed/1.0-bath manufactured listed at $168k.
Deal economics
- At list price, monthly cash flow is $751 ($9k/yr) — positive.
- The deal already cash-flows at list — no discount required.
- Meets the 1% rule at list price ($2k rent vs $168k).
- Recommended offer: $147k (12.0% below list) — sets the bar for market timing.
- Cap rate 11.7% vs local median 1.5% in Trappe — top-decile yield for the area; either an underpriced asset or a hidden risk that comps aren't pricing in. Stress-test before assuming the spread holds.
Location & tenants
- Location reads 79/100 on livability (#245 in PA, #2,090 nationally) — a middle-class / working-renter tenant base. Strengths: crime A+, employment A+, housing A+; Watch: commute F, health & safety D-.
- Spring-Ford Area SD (suburban): math 58% / reading 78% proficiency, ranked #23 of 539 in PA (top 4%) — acceptable for families but not a draw, mixed tenant base, ~2y average lease; only 11% free/reduced lunch — higher-income household profile.
- Zoned schools: Evans El Sch (math 67% / reading 80%, grade A, #113 of 1,518 statewide, top 8%, 559 students, 16% FRL); Spring-Ford Intrmd Sch 5Th/6Th (math 49% / reading 77%, grade B+, #29 of 512 statewide, top 5%, 1,278 students, 19% FRL); Spring-Ford Shs 9-12 Ctr (math 94% / reading 86%, grade A+, #3 of 437 statewide, top 0%, 2,631 students, 18% FRL).
- Market conditions: Rents soft (-1.2%/yr); 138 active listings in the ZIP; 6 comparable units currently listed for rent nearby; rentals leasing fast (median 5d on market — plan ~1-2 weeks tenant-placement turnaround); solid renter incomes; 1,936 units permitted in Montgomery County in 2024 (530 in 5+ unit buildings).
Forward outlook
- Local home prices are declining (-3.0%/yr); year-one equity from $1k of loan paydown is wiped out by about $5k of value loss. Plan a longer hold.
- Montgomery County population projected at +5% by 2050 — modest demand growth; plan on rents tracking national, not racing it.
- At projected returns (-3.0% appreciation + 0.0% rent growth), your $47k cash investment doubles in ~8 years — after that, you're playing with house money.
Negotiation context
- It's been on market 271 days — a 12% lower offer ($147k) is reasonable based on typical stale-listing flexibility.
- 2 sale attempts since 23y ago with the ask held roughly flat each time — persistent listings suggest the price (not the market) is what's stuck; bring a comps-based counter.
Risks & watch-outs
- Climate carrying-cost: major wind risk, 27% chance of damaging wind over 30y; extreme-heat days projected 7→14/yr by 2055 (HVAC capex compounding) — expect insurance premiums to compound above CPI over the hold.
Questions for the listing agent
- It's been on market 271 days. Have you received any prior offers? Is the seller open to a 12% concession, seller financing, or rate buy-down credit?
- Built in 1970 — when were the roof, HVAC, electrical panel, plumbing, and water heater last replaced?
- Why hasn't it sold? Are there any deal-killer items the seller is aware of (foundation, flood, title, zoning, code violations)?
- Is there a deadline driving the sale (1031 exchange, divorce, estate, relocation)? That informs how much negotiation room exists.
- Schools are A-rated — typically a magnet for longer-tenancy family renters. What's the average tenant stay here, and is there a school-zone premium baked into asking?
- What's the average days-on-market for RENTAL listings here right now (not sales)? A rising rental-DOM trend means longer vacancies and softer asking-rent achievability than the comps imply.
- What's the recent tenant-quality profile in this submarket — average credit score on applications, eviction rate, late-payment / NSF rate, and stable-employment percentage? A property-management company in the area should have these aggregated.
- How much new for-sale + rental construction is in the pipeline within 1–3 miles? Heavy new supply typically softens prices + rents 12–24 months out; constrained supply supports both.
Investment metrics
- 1% rule
- 1.31% ✓
- Cap rate
- 11.67%
- Cash-on-cash
- 19.21%
- DSCR
- 1.85
- GRM
- 6.4
CMA / ARV
- ARV (median comp)
- $128,596
- List price
- $167,500
- Delta
- 30.25%
- Verdict
- OVERPRICED
- Comps
- 4 within 1.0 mi
Projected returns pro-forma
-3.0% appreciation · 0.0% rent growth · sell at horizon
- IRR
- 8.0%
- Equity multiple
- 1.30×
- Total profit
- $14,168
- Equity at exit
- $24,975
- IRR
- 14.7%
- Equity multiple
- 2.04×
- Total profit
- $48,730
- Equity at exit
- $14,482
Cash invested: $46,900 (down + closing). Projections, not guarantees.
Landlord ↔ Tenant lean methodology
- Overall (STATE)
- 62 Landlord-Friendly
- State Pennsylvania
- 62 Landlord-Friendly · EVEN
- County
- — inherits STATE
- City
- — inherits STATE
ZIP-level market 19468
- Rents YoY
- -1.2%
- Active inventory
- 138
- Price-to-rent
- 6.4×
Monthly cashflow live
- Estimated rent
- $2,198 high interval (Pro) →
- Mortgage (P&I)
- −$878
- Tax from tax record
- −$37 /mo · $449/yr
- Insurance
- −$70
- HOA
- −$0
- Vacancy / Maint / Mgmt
- −$462
- Net cashflow
- $751
Break-even live
Sensitivity live
| Price | -10% $846 | -5% $798 | +0% $751 | +5% $703 | +10% $656 |
|---|---|---|---|---|---|
| Rent | -10% $577 | -5% $664 | +0% $751 | +5% $838 | +10% $925 |
| Rate | -1.0pp $835 | -0.5pp $793 | base $751 | +0.5pp $707 | +1.0pp $663 |
UW: 25.0% down · 7.5% · 30yr · 1.5% tax · 5.0% vac · 8.0% maint · 8.0% mgmt
Financing live
Cash to close
- Down payment
- $41,875
- Closing costs
- $5,025
- Reserves months
- —
- Total cash needed
- —
Loan-product check · same deal, 3 products live
Conventional
25% down · 7.5% · 30yr
- Down + closing
- —
- Monthly P&I
- —
- Monthly cashflow
- —
- DSCR
- —
- Eligible?
- —
Personal DTI + credit; lowest rate.
DSCR
20% down · 8.5% · 30yr
- Down + closing
- —
- Monthly P&I
- —
- Monthly cashflow
- —
- DSCR
- —
- Eligible?
- —
No personal income docs; deal must DSCR.
Hard money
10% down · 12.0% · 12mo
- Down + closing
- —
- Monthly P&I
- —
- Monthly cashflow
- —
- DSCR
- —
- Eligible?
- —
Short-term bridge; refi at stabilization.
Rent comps 6 comps
| Address | Beds | Baths | Sqft | Rent | $/sqft | DOM | Units | Dist |
|---|---|---|---|---|---|---|---|---|
| 266 W Ridge Pike #2 Royersford, PA | 1.0 | 1.0 | 720 | $1,475 | $2.05 | 20d | 1 | 0.51mi |
| 151 Holly Dr Royersford, PA | 1.0–2.0 | 1.0–2.0 | 964 | $2,685 | $2.78 | 0d | 9 | 1.26mi |
| 150 Morgan Dr Royersford, PA | 1.0–3.0 | 1.0–2.5 | 1075 | $2,590 | $2.41 | 45d | 15 | 1.26mi |
| 150 Morgan Dr Royersford, PA | 1.0–3.0 | 1.0–2.5 | 1075 | $2,380 | $2.21 | 0d | 15 | 1.26mi |
| 350 Brooke Dr Royersford, PA | 1.0–3.0 | 1.0–2.5 | 1025 | $2,410 | $2.35 | 5d | 9 | 1.41mi |
| 100 Hunsberger Dr Royersford, PA | 1.0–3.0 | 1.0–2.0 | 1104 | $2,699 | $2.44 | 0d | 6 | 1.47mi |
Listing history 19 events
-
2026-06-21days on market $167,500 Active 271 DOM
-
2026-06-18days on market $167,500 Active 268 DOM
-
2026-06-17days on market $167,500 Active 267 DOM
-
2026-06-16days on market $167,500 Active 266 DOM
-
2026-06-15days on market $167,500 Active 265 DOM
-
2026-06-13days on market $167,500 Active 263 DOM
-
2026-06-13days on market $167,500 Active 262 DOM
-
2026-06-09days on market $167,500 Active 259 DOM
-
2026-06-08days on market $167,500 Active 258 DOM
-
2026-06-07days on market $167,500 Active 257 DOM
-
2026-06-04days on market $167,500 Active 254 DOM
-
2026-06-03days on market $167,500 Active 253 DOM
-
2026-06-02days on market $167,500 Active 252 DOM
-
2026-06-01days on market $167,500 Active 251 DOM
-
2026-05-31days on market $167,500 Active 250 DOM
-
2025-12-04price $167,500 517-char remark
Show marketing remark (517 chars)
* * * New Construction * * * 2 bedroom 1 bath home. 165 W Ridge Pike lot 226 Limerick PA 19468 This home has it all. A great location in Limerick, PA. Energy star windows and doors make this home very energy efficient. With full warranties on the entire home your covered. Custom kitchen with stainless steel appliances also included. Large living room. Financing is available with our three major lenders and rates are dropping. Now is the best time to jump into a new home. Schedule your private showing today.
-
2025-09-23$172,500 Active 517-char remark
Show marketing remark (517 chars)
* * * New Construction * * * 2 bedroom 1 bath home. 165 W Ridge Pike lot 226 Limerick PA 19468 This home has it all. A great location in Limerick, PA. Energy star windows and doors make this home very energy efficient. With full warranties on the entire home your covered. Custom kitchen with stainless steel appliances also included. Large living room. Financing is available with our three major lenders and rates are dropping. Now is the best time to jump into a new home. Schedule your private showing today.
-
2003-07-21$25,900
-
2003-07-21historical
ⓘ Source: listings_history table (triggers on properties + properties_extension) + one-shot
backfill from property_details.listing_events for pre-trigger history.
Tax reassessment forecast PA · Partial reset (capped growth)
- Current annual tax
- $449 · $37/mo
- Projected year-2 tax
- $1,548 · $129/mo
- Expected delta
- +$1,099/yr (+$92/mo · 244.5%)
ⓘ Screening estimate from a state-policy table — verify with the county assessor before closing.
Climate risk First Street
- Flood 1/10 Low FEMA zone X (unshaded) · 0% chance over 30 yrs
- Wildfire 2/10 Low
- Heat 5/10 Major 7 d/yr ≥100°F today · 14 d/yr by 30 yrs out
- Wind 6/10 Major 27% chance of damaging wind over 30 yrs
- Air quality 4/10 Moderate 3 unhealthy d/yr today · 6 by 30 yrs out
Nearby sold comps map
Loading sold comps map…
Walkable amenities ~0.75 mi
Loading nearby amenities…
Taxation est. · year 1
- Rental income
- $26,377
- − Mortgage interest
- −$9,383
- − Property taxes
- −$449
- − Insurance
- −$838
- − Repairs & maintenance
- −$2,110
- − Management
- −$2,110
- − Depreciation
- −$4,873
- Taxable income
- $6,615
- Est. tax owed @ 24.0%
- −$1,588
- After-tax cash flow
- $7,423/yr
For passive investors: Depreciation is non-cash, so a rental often shows a tax loss while cash-flowing — sheltering income. Rental losses are passive: they offset passive income freely, and up to $25,000/yr can offset ordinary (W-2) income if you actively participate and your MAGI is under $100k (phasing out to $0 by $150k); unused losses carry forward. On sale, claimed depreciation is recaptured at up to 25%, and gains may owe capital-gains tax (a 1031 exchange can defer both). Figures are a year-1 estimate at your 24.0% rate — not tax advice; consult a CPA.
Schools (NCES district)
- District
- Spring-Ford Area SD
- NCES district ID
- 4222560
- Math proficiency
- 58% ▼ -11.00%
- Reading proficiency
- 78% ▼ -5.00%
- Median HH income
- $84,931
- Composite
- 60.97/100
- National rank
- #802
- State rank
- #23 of 539 in PA
Livability — Trappe
- Score
- 79/100
- State rank
- #245
- US rank
- #2090
Category grades
Schools grade is shown separately in the Schools card above.
Census & demographics
- County
- Montgomery County · 712,331 people
- Metro
- Philadelphia-Camden-Wilmington, PA-NJ-DE-MD
- Population (ZIP)
- 28,194
- Household income
- $108,534
- Rent vs Own
- Severe rent burden
- 555.0
Population outlook (Montgomery County) Hauer SSP2
- Today (2025)
- 856,074 people
- By 2030
- 870,887 · +1.7%
- By 2040
- 891,195 · +4.1%
- By 2050
- 896,417 · +4.7%
- By 2075
- 903,212 · +5.5%
- By 2100
- 843,240 · -1.5%
Race, ethnicity, and origin ACS 2023
- Neighborhood character
- Predominantly White (84%)
- Race & ethnicity
- White 84% Asian 7% Two or more races 3% Hispanic / Latino 3% Black 2%
- Common ancestry
- Romanian 9% Slovak 1% Lithuanian 1%
- Foreign-born
- 7% · Canada, China, Vietnam
- Languages at home
- 91% English-only · Other Indo-European 3% Spanish 2% Other Asian/Pacific 2%
Political lean MEDSL · Montgomery
- 2024 margin
- Strong D (+22.8) · D 60.9% · R 38.1% · Other 1.1%
- 2008→2024 swing
- +2.0pp toward D · 2008: 20.8pp · 2024: 22.8pp
- All cycles
- 2024: D+22.8 2020: D+26.3 2016: D+21.1 2012: D+14.3 2008: D+20.8
Not yet ingested
- Civics
- —
Market trends
- HPI YoY
- ▼ -269.11%
- Current HPI
- 300.9404
- Rent YoY
- ▼ -1.17%
- Metro
- Philadelphia-Camden-Wilmington, PA-NJ-DE-MD
- State GDP YoY
- ▲ 1.68%
- F500 in state
- 34
Industry mix (Fortune 500 HQ in PA)
| Industry | F500 HQs | Revenue |
|---|---|---|
| Healthcare | 2 | $309B |
|
||
| Insurance | 2 | $27B |
|
||
| Telecommunications / Media | 1 | $124B |
|
||
| Industrial Distribution | 1 | $22B |
|
||
| Financial Services | 1 | $20B |
|
||
| Chemicals / Materials | 1 | $18B |
|
||
Price history
+546.7% since first listed4 events — show timeline
- 2025-12-04 Price Changed $167,500 BRIGHT MLS
- 2025-09-23 Listed $172,500 BRIGHT MLS
- 2003-07-21 Listing Removed — BRIGHT MLS
- 2003-07-21 Listed $25,900 BRIGHT MLS
Property tax history
+2.1%/yrLatest (2021): $449 · +2.6% YoY. Source: county tax records.
Cash-flow waterfall
monthlySold comps — $/sqft
last 12 mo · ≤1 miLoading sold comps…