 🏷️ Likely Rental
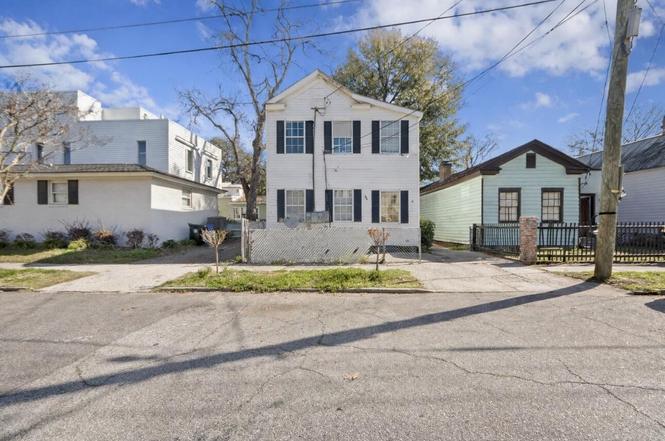
16 Killians St · Charleston, SC
Flood risk 9/10 · Severe
- FEMA flood zone
- AE
- Chance of flooding over 30 yrs
- 0.99%
- Est. flood insurance / yr
- $1,737 – $8,500
Fire risk 4/10 · Minor
- Est. fire insurance / yr
- $783 – $1,453
Heat risk 10/10 · Severe
- Hot days now (above 105°F)
- 7 days/yr
- Hot days in 30 yrs
- 18 days/yr
Wind risk 9/10 · Severe
- Chance of severe wind over 30 yrs
- 99.0%
Air-quality risk 3/10 · Minor
- Unhealthy air days now
- 3 days/yr
- Unhealthy air days in 30 yrs
- 3 days/yr
Risk factors via First Street. Map © Google.
Why this score? — see what drove the B- grade
The composite is a weighted blend of 9 inputs, each scored 0–100. Each bar is that input's sub-score; the figure is the points it added to the 100-point composite (weight × sub-score).
- Cash flow +25.2/30.0
- ARV discount +15.0/15.0
- DSCR +8.3/10.0
- 1% rule +5.4/10.0
- Schools +4.3/10.0
- Livability +3.8/5.0
- Rent growth +3.6/5.0
- Condition / age +2.5/5.0
- Appreciation +0.0/10.0
$900,000
🖨 Deal sheet 📄 Offer letter ✓ Due diligence
Multi-family units
County records classify this as Multi-Family (2-4 Unit). Listing-text estimate: 3 units. confirmed
Listing remarks
Three 3-bedroom, 1-bath units make up this triplex located in the desirable Westside of downtown Charleston. One unit is currently tenant-occupied, while the remaining two units are vacant and ready for the next owner to renovate and add value. Located in the rapidly growing Westside area, this property presents a strong investment opportunity for an owner-occupant or investor looking to expand their portfolio.
Key facts
- 3,484 sq ft lot
- Built 1930
- Listed 99 days
Property features AI
Finance
- Financial info: 3 total units; Tenant pays all utilities
Exterior
- Parking: Other parking
- Utilities: Public sewer
- Home design: Residential income property; Triplex
- Exterior features: Located in the Westside neighborhood; Subdivision: Westside; MLS area: Peninsula Charleston Outside of Crosstown
Interior
- Bedrooms: 9 bedrooms (total)
- Bathrooms: 3 bathrooms (total)
- Interior features: Central air conditioning; Natural gas heating
- Laundry & utility: Tenants pay all utilities
Neighborhood map
What this means for you Summary
Snapshot
- This is a 3 × 3-bed/1.0-bath units multifamily listed at $900k.
Deal economics
- At list price, monthly cash flow is $2k ($19k/yr) — positive. Per door: $528/mo.
- The deal already cash-flows at list — no discount required.
- Meets the 1% rule at list price ($9k rent vs $900k).
- Recommended offer: $819k (9.0% below list) — sets the bar for market timing.
- Cap rate 9.0% vs local median 2.4% in Charleston — top-decile yield for the area; either an underpriced asset or a hidden risk that comps aren't pricing in. Stress-test before assuming the spread holds.
Location & tenants
- Location reads 76/100 on livability (#22 in SC, #3,336 nationally) — a middle-class / working-renter tenant base. Strengths: amenities A+, housing A+, health & safety A+; Watch: crime D+, commute F, cost of living D-.
- Charleston 01 (urban): math 48% / reading 53% proficiency, ranked #7 of 80 in SC (top 9%) — acceptable for families but not a draw, mixed tenant base, ~2y average lease.
- Zoned schools: Mitchell Elementary (math 22% / reading 8%, grade F, #549 of 597 statewide, top 92%, 222 students, 100% FRL); Simmons Pinckney Middle (math 3% / reading 13%, grade F, #226 of 229 statewide, top 99%, 219 students, 100% FRL); Burke High (math 32% / reading 67%, grade D, #151 of 196 statewide, top 79%, 352 students, 100% FRL) — zoned schools average 100% FRL vs 44% district-wide (56 pts higher); higher-poverty schools than district average — tighter screening recommended.
- Zoned-school proficiency averages 24% at this address vs 50% district-wide (-26 pts) — the specific schools serving this property underperform the Charleston 01 average; the district grade overstates school quality for this exact location.
- Market conditions: Rents rising fast (+4.6%/yr); 147 active listings in the ZIP; 4,156 units permitted in Charleston County in 2024 (857 in 5+ unit buildings).
- At $9,350/mo this rent would consume 168% of the median local household income ($67k/yr) (locally 2319% of renters already pay >50% of income on rent) — very limited rent-growth headroom before tenants either downsize or default.
Forward outlook
- Local home prices are declining (-3.0%/yr); year-one equity from $6k of loan paydown is wiped out by about $27k of value loss. Plan a longer hold.
- Charleston County population projected at +44% by 2050 — long-run rental-demand tailwind backs the buy-and-hold thesis.
Negotiation context
- It's been on market 99 days — a 9% lower offer ($819k) is reasonable based on typical stale-listing flexibility.
- 5 sale attempts since 7y ago; this cycle's ask has dropped $100k (10%) from the opening price — seller is motivated, your offer sets the floor, not the list.
Risks & watch-outs
- Watch-outs: flood insurance adds $427/mo; built in 1930 — expect roof / HVAC / electrical / plumbing capex.
- Climate carrying-cost: in FEMA flood zone AE (mandatory federal flood insurance); severe wind risk, 99% chance of damaging wind over 30y; extreme-heat days projected 7→18/yr by 2055 (HVAC capex compounding) — expect insurance premiums to compound above CPI over the hold.
Questions for the listing agent
- It's been on market 99 days. Have you received any prior offers? Is the seller open to a 9% concession, seller financing, or rate buy-down credit?
- Can we see the unit-by-unit rent roll, current vacancy, and any below-market leases? What's the average tenancy length?
- What capital expenditures (roof, boiler, parking lot, exteriors) have been made in the last 5 years, and what's planned in the next 2?
- Built in 1930 — when were the roof, HVAC, electrical panel, plumbing, and water heater last replaced?
- What's the actual annual flood-insurance premium (NFIP or private), and is the property in a SFHA with mandatory coverage?
- Why hasn't it sold? Are there any deal-killer items the seller is aware of (foundation, flood, title, zoning, code violations)?
- Is there a deadline driving the sale (1031 exchange, divorce, estate, relocation)? That informs how much negotiation room exists.
- Schools are A-rated — typically a magnet for longer-tenancy family renters. What's the average tenant stay here, and is there a school-zone premium baked into asking?
- Crime grade is D in this area — have there been break-ins, vandalism, or insurance claims at this property in the last 3 years? What carrier currently insures it and at what premium?
- What's the average days-on-market for RENTAL listings here right now (not sales)? A rising rental-DOM trend means longer vacancies and softer asking-rent achievability than the comps imply.
- What's the recent tenant-quality profile in this submarket — average credit score on applications, eviction rate, late-payment / NSF rate, and stable-employment percentage? A property-management company in the area should have these aggregated.
- How much new apartment / multifamily construction is in the pipeline within 1–3 miles? Heavy new supply (>2% of stock underway) typically softens rents 12–24 months out; light construction supports rent growth.
Investment metrics
- 1% rule
- 1.04% ✓
- Cap rate
- 8.98%
- Cash-on-cash
- 9.58%
- DSCR
- 1.43
- GRM
- 8.0
CMA / ARV
- ARV (on-the-fly)
- $1,765,584
- Comps found
- 3
Show comp detail 3 sales within ~0.75 mi
| Address | Dist | Beds/Ba | Sqft | Sold | Price | $/sf | Match |
|---|---|---|---|---|---|---|---|
| 27 Percy St | 0.33mi | 6/5.0 | 2,288 (-5%) | 12mo | $1,675,000 | $732 | 58 |
| 201 Spring St | 0.39mi | 6/5.0 | 2,529 (+5%) | 17mo | $895,000 | $354 | 52 |
| 40 Spring St Unit A & B | 0.53mi | 6/6.5 | 2,710 (+12%) | 16mo | $2,425,000 | $895 | 28 |
Match score weights: distance 35% · size 25% · config 20% · recency 20%. Top-matched comps best support the ARV.
Projected returns pro-forma
-3.0% appreciation · 4.58% rent growth · sell at horizon
- IRR
- -3.1%
- Equity multiple
- 0.88×
- Total profit
- $-29,894
- Equity at exit
- $134,193
- IRR
- 8.2%
- Equity multiple
- 1.66×
- Total profit
- $167,487
- Equity at exit
- $77,816
Cash invested: $252,000 (down + closing). Projections, not guarantees.
Landlord ↔ Tenant lean methodology
- Overall (STATE)
- 90 Strongly Landlord-Friendly
- State South Carolina
- 90 Strongly Landlord-Friendly · R+6
- County
- — inherits STATE
- City
- — inherits STATE
ZIP-level market 29403
- Rents YoY
- 4.6%
- Active inventory
- 147
- Price-to-rent
- 24.1×
Monthly cashflow live
- Estimated rent
- $9,350 high interval (Pro) →
- Mortgage (P&I)
- −$4,720
- Tax from tax record
- −$280 /mo · $3,361/yr
- Insurance
- −$375
- Flood insurance flood zone
- −$427 /mo · $5,118/yr
- HOA
- −$0
- Vacancy / Maint / Mgmt
- −$1,964
- Net cashflow
- $1,585
Break-even live
3-unit breakdown (identical units grouped — click to expand)
| Units | Beds | Baths | Est. rent |
|---|---|---|---|
| 3× units | 3 | 1 | $9,351 |
| #1 | 3 | 1 | $3,117 |
| #2 | 3 | 1 | $3,117 |
| #3 | 3 | 1 | $3,117 |
| Total (3 units) | $9,350 | ||
UW: 25.0% down · 7.5% · 30yr · 1.5% tax · 5.0% vac · 8.0% maint · 8.0% mgmt
Financing live
Cash to close
- Down payment
- $225,000
- Closing costs
- $27,000
- Reserves months
- —
- Total cash needed
- —
Loan-product check · same deal, 3 products live
Conventional
25% down · 7.5% · 30yr
- Down + closing
- —
- Monthly P&I
- —
- Monthly cashflow
- —
- DSCR
- —
- Eligible?
- —
Personal DTI + credit; lowest rate.
DSCR
20% down · 8.5% · 30yr
- Down + closing
- —
- Monthly P&I
- —
- Monthly cashflow
- —
- DSCR
- —
- Eligible?
- —
No personal income docs; deal must DSCR.
Hard money
10% down · 12.0% · 12mo
- Down + closing
- —
- Monthly P&I
- —
- Monthly cashflow
- —
- DSCR
- —
- Eligible?
- —
Short-term bridge; refi at stabilization.
Listing history 22 events
-
2026-06-18days on market $900,000 Active 99 DOM
-
2026-06-17days on market $900,000 Active 98 DOM
-
2026-06-16days on market $900,000 Active 97 DOM
-
2026-06-15days on market $900,000 Active 96 DOM
-
2026-06-10days on market $900,000 Active 91 DOM
-
2026-06-09days on market $900,000 Active 90 DOM
-
2026-06-08days on market $900,000 Active 89 DOM
-
2026-06-07days on market $900,000 Active 88 DOM
-
2026-06-05days on market $900,000 Active 85 DOM
-
2026-06-03days on market $900,000 Active 84 DOM
-
2026-06-01days on market $900,000 Active 82 DOM
-
2026-05-31days on market $900,000 Active 81 DOM
-
2026-04-16price $900,000
-
2026-03-11$1,000,000 Active
-
2021-11-02historical
-
2021-09-16historical
-
2021-09-16status Active
-
2021-03-25$719,900 Active
-
2021-03-25historical
-
2020-11-16$749,900 Active
-
2020-09-21historical
-
2019-10-17$799,000 Active
ⓘ Source: listings_history table (triggers on properties + properties_extension) + one-shot
backfill from property_details.listing_events for pre-trigger history.
Tax reassessment forecast SC · Resets to sale price
- Current annual tax
- $3,361 · $280/mo
- Projected year-2 tax
- $5,130 · $428/mo
- Expected delta
- +$1,769/yr (+$147/mo · 52.7%)
ⓘ Screening estimate from a state-policy table — verify with the county assessor before closing.
Climate risk First Street
- Flood 9/10 Extreme FEMA zone AE · 99% chance over 30 yrs
- Wildfire 4/10 Moderate
- Heat 10/10 Extreme 7 d/yr ≥105°F today · 18 d/yr by 30 yrs out
- Wind 9/10 Extreme 99% chance of damaging wind over 30 yrs
- Air quality 3/10 Moderate 3 unhealthy d/yr today · 3 by 30 yrs out
Nearby sold comps map
Loading sold comps map…
Walkable amenities ~0.75 mi
Loading nearby amenities…
Taxation est. · year 1
- Rental income
- $112,200
- − Mortgage interest
- −$50,414
- − Property taxes
- −$3,361
- − Insurance
- −$9,618
- − Repairs & maintenance
- −$8,976
- − Management
- −$8,976
- − Depreciation
- −$26,182
- Taxable income
- $4,673
- Est. tax owed @ 24.0%
- −$1,122
- After-tax cash flow
- $17,901/yr
For passive investors: Depreciation is non-cash, so a rental often shows a tax loss while cash-flowing — sheltering income. Rental losses are passive: they offset passive income freely, and up to $25,000/yr can offset ordinary (W-2) income if you actively participate and your MAGI is under $100k (phasing out to $0 by $150k); unused losses carry forward. On sale, claimed depreciation is recaptured at up to 25%, and gains may owe capital-gains tax (a 1031 exchange can defer both). Figures are a year-1 estimate at your 24.0% rate — not tax advice; consult a CPA.
Schools (NCES district)
- District
- Charleston 01
- NCES district ID
- 4501440
- Math proficiency
- 48% ▼ -2.00%
- Reading proficiency
- 53% ▬ 0.00%
- Median HH income
- $52,376
- Composite
- 43.41/100
- National rank
- #3018
- State rank
- #7 of 80 in SC
Livability — Charleston
- Score
- 76/100
- State rank
- #22
- US rank
- #3336
Category grades
Schools grade is shown separately in the Schools card above.
Census & demographics
- Census place
- Charleston, SC
- County
- Charleston County · 366,793 people
- City population
- 200,573
- Metro
- Charleston-North Charleston, SC
- Population (ZIP)
- 22,533
- Household income
- $66,944
- Rent vs Own
- Severe rent burden
- 2319.0
Population outlook (Charleston County) Hauer SSP2
- Today (2025)
- 480,562 people
- By 2030
- 525,921 · +9.4%
- By 2040
- 612,189 · +27.4%
- By 2050
- 691,627 · +43.9%
- By 2075
- 847,979 · +76.5%
- By 2100
- 926,482 · +92.8%
Race, ethnicity, and origin ACS 2023
- Neighborhood character
- Majority White (58%)
- Race & ethnicity
- White 58% Black 34% Hispanic / Latino 4% Two or more races 3% Asian 1%
- Common ancestry
- Slovak 2% Italian 2% Romanian 1%
- Foreign-born
- 3% · Canada, Dominican Republic, China
- Languages at home
- 96% English-only · Spanish 1% French/Haitian/Cajun 1% Other Indo-European 1%
Political lean MEDSL · Charleston
- 2024 margin
- Lean D (+5.7) · D 51.9% · R 46.3% · Other 1.8%
- 2008→2024 swing
- -2.7pp toward R · 2008: 8.3pp · 2024: 5.7pp
- All cycles
- 2024: D+5.7 2020: D+12.9 2016: D+7.9 2012: D+2.4 2008: D+8.3
Not yet ingested
- Civics
- —
Market trends
- HPI YoY
- ▼ -471.75%
- Current HPI
- 585.4871
- Rent YoY
- ▲ 4.58%
- Metro
- Charleston-North Charleston, SC
- State GDP YoY
- ▲ 4.51%
- F500 in state
- 2
Industry mix (Fortune 500 HQ in SC)
| Industry | F500 HQs | Revenue |
|---|---|---|
| Packaging | 1 | $7B |
|
||
Price history
+12.6% since first listed10 events — show timeline
- 2026-04-16 Price Changed $900,000 Charleston Trident MLS
- 2026-03-11 Listed $1,000,000 Charleston Trident MLS
- 2021-11-02 Listing Removed — Charleston Trident MLS
- 2021-09-16 Listing Removed — Charleston Trident MLS
- 2021-09-16 Relisted — Charleston Trident MLS
- 2021-03-25 Listing Removed — Charleston Trident MLS
- 2021-03-25 Listed $719,900 Charleston Trident MLS
- 2020-11-16 Listed $749,900 Charleston Trident MLS
- 2020-09-21 Listing Removed — Charleston Trident MLS
- 2019-10-17 Listed $799,000 Charleston Trident MLS
Property tax history
+3.6%/yrLatest (2022): $3,361 · +1.2% YoY. Source: county tax records.
Cash-flow waterfall
monthlySold comps — $/sqft
last 12 mo · ≤1 miLoading sold comps…