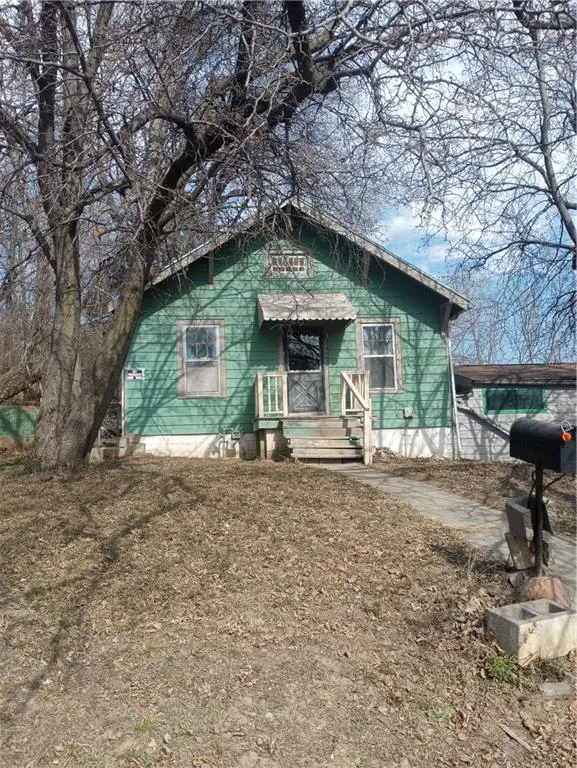
8840 E Wilson Rd · Independence, MO
Flood risk 1/10 · Minimal
- FEMA flood zone
- X (unshaded)
- Chance of flooding over 30 yrs
- 0.0%
- Est. flood insurance / yr
- $473 – $860
Fire risk 3/10 · Minor
- Est. fire insurance / yr
- $1,054 – $1,958
Heat risk 4/10 · Minor
- Hot days now (above 107°F)
- 7 days/yr
- Hot days in 30 yrs
- 17 days/yr
Wind risk 2/10 · Minimal
- Chance of severe wind over 30 yrs
- —
Air-quality risk 3/10 · Minor
- Unhealthy air days now
- 2 days/yr
- Unhealthy air days in 30 yrs
- 3 days/yr
Risk factors via First Street. Map © Google.
Why this score? — see what drove the A grade
The composite is a weighted blend of 9 inputs, each scored 0–100. Each bar is that input's sub-score; the figure is the points it added to the 100-point composite (weight × sub-score).
- Cash flow +30.0/30.0
- ARV discount +15.0/15.0
- DSCR +10.0/10.0
- Appreciation +10.0/10.0
- 1% rule +8.6/10.0
- Livability +4.1/5.0
- Schools +2.7/10.0
- Rent growth +2.5/5.0
- Condition / age +2.5/5.0
$73,750
🖨 Deal sheet 📄 Offer letter ✓ Due diligence
Listing remarks MLS
This Fixer upper features a Roof within the Last 2 Years, 200 Amp Service, an Extended Garage in the Basement with ample Room for a Workshop. It also has a Main Floor Laundry plus, the Original Hardwood Floors throughout. The Bathroom has a Shower, No Tub. This house sits on a Treed Corner Lot with an irregular Lot size. Please see Supplements for the Public Lot Plat. Dehumidifier and Window A/C stays.
Key facts
- 8,645 sq ft lot
- Garage
- Built 1922
Neighborhood map
What this means for you Summary
Snapshot
- This is a 2-bed/1.0-bath single-family listed at $74k.
Deal economics
- At list price, monthly cash flow is $322 ($4k/yr) — positive.
- The deal already cash-flows at list — no discount required.
- Meets the 1% rule at list price ($1k rent vs $74k).
- Recommended offer: $67k (9.0% below list) — sets the bar for market timing.
- Cap rate 11.5% vs local median 5.0% in Independence — top-decile yield for the area; either an underpriced asset or a hidden risk that comps aren't pricing in. Stress-test before assuming the spread holds.
Location & tenants
- Location reads 82/100 on livability (#10 in MO, #1,296 nationally) — a professional / high-income tenant draw. Strengths: amenities A+, commute A+, cost of living A+; Watch: schools C-, employment D+, crime F.
- Independence 30 (suburban): math 26% / reading 38% proficiency, ranked #252 of 324 in MO (top 78%) — families likely to look elsewhere, expect single-tenant / working-renter base with shorter leases.
- Market conditions: 46 active listings in the ZIP; 9 comparable units currently listed for rent nearby; rentals lingering (median 44d on market — plan ~5-8 weeks vacancy on turnover, expect pricing pressure); 56% of comp listings sitting > 30 days — soft ceiling on asking rent; 4,002 units permitted in Jackson County in 2024 (2,271 in 5+ unit buildings).
Forward outlook
- In year one you build about $8k of equity ($510 loan paydown + $7k appreciation (10.0% local appreciation)).
- Jackson County population projected at +4% by 2050 — modest demand growth; plan on rents tracking national, not racing it.
- At projected returns (10.0% appreciation + 3.0% rent growth), your $21k cash investment doubles in ~2 years — after that, you're playing with house money.
- By year 5, paydown + projected appreciation supports a ~$37k cash-out refi (75% LTV) — recoverable capital for the next deal without selling this one.
Negotiation context
- It's been on market 111 days — a 9% lower offer ($67k) is reasonable based on typical stale-listing flexibility.
- 4 sale attempts since 17y ago; this cycle's ask has dropped $9k (11%) from the opening price — seller is motivated, your offer sets the floor, not the list.
Risks & watch-outs
- Watch-outs: built in 1922 — expect roof / HVAC / electrical / plumbing capex.
Questions for the listing agent
- It's been on market 111 days. Have you received any prior offers? Is the seller open to a 9% concession, seller financing, or rate buy-down credit?
- Built in 1922 — when were the roof, HVAC, electrical panel, plumbing, and water heater last replaced?
- Why hasn't it sold? Are there any deal-killer items the seller is aware of (foundation, flood, title, zoning, code violations)?
- Is there a deadline driving the sale (1031 exchange, divorce, estate, relocation)? That informs how much negotiation room exists.
- Crime grade is F in this area — have there been break-ins, vandalism, or insurance claims at this property in the last 3 years? What carrier currently insures it and at what premium?
- What's the average days-on-market for RENTAL listings here right now (not sales)? A rising rental-DOM trend means longer vacancies and softer asking-rent achievability than the comps imply.
- What's the recent tenant-quality profile in this submarket — average credit score on applications, eviction rate, late-payment / NSF rate, and stable-employment percentage? A property-management company in the area should have these aggregated.
- How much new for-sale + rental construction is in the pipeline within 1–3 miles? Heavy new supply typically softens prices + rents 12–24 months out; constrained supply supports both.
Investment metrics
- 1% rule
- 1.36% ✓
- Cap rate
- 11.54%
- Cash-on-cash
- 18.72%
- DSCR
- 1.83
- GRM
- 6.1
CMA / ARV
- ARV (median comp)
- $141,373
- List price
- $73,750
- Delta
- -47.83%
- Verdict
- UNDERPRICED
- Comps
- 20 within 1.0 mi
Show comp detail 12 sales within ~0.75 mi
| Address | Dist | Beds/Ba | Sqft | Sold | Price | $/sf | Match |
|---|---|---|---|---|---|---|---|
| 8908 E Thompson Ave | 0.28mi | 2/1.0 | 859 (+2%) | 5mo | $68,500 | $80 | 79 |
| 125 S Brookside St | 0.42mi | 2/1.0 | 855 (+2%) | 4mo | $90,000 | $105 | 74 |
| 8806 E Smart Ave | 0.23mi | 2/1.0 | 908 (+8%) | 6mo | $95,000 | $105 | 71 |
| 8703 E Morrell Ave | 0.23mi | 2/1.0 | 748 (-11%) | 4mo | $79,900 | $107 | 68 |
| 526 S Brookside Ave | 0.48mi | 2/1.0 | 821 (-2%) | 14mo | $29,000 | $35 | 62 |
| 548 S Brookside Ave | 0.53mi | 2/1.0 | 875 (+4%) | 17mo | $45,000 | $51 | 54 |
| 107 N Ditzler Ave | 0.37mi | 3/2.0 (+1) | 934 (+11%) | 2mo | $178,500 | $191 | 54 |
| 128 S Arlington Ave | 0.63mi | 3/1.0 (+1) | 884 (+5%) | 7mo | $125,000 | $141 | 51 |
| 604 S Glenwood Ave | 0.69mi | 3/1.0 (+1) | 865 (+3%) | 10mo | $50,000 | $58 | 49 |
| 112 N Brookside Ave | 0.40mi | 2/1.5 | 729 (-13%) | 16mo | $115,000 | $158 | 44 |
| 119 N Evanston Ave | 0.73mi | 2/1.0 | 952 (+13%) | 3mo | $140,000 | $147 | 41 |
| 107 N Crescent Ave | 0.61mi | 2/1.0 | 942 (+12%) | 14mo | $142,750 | $152 | 40 |
Match score weights: distance 35% · size 25% · config 20% · recency 20%. Top-matched comps best support the ARV.
Projected returns pro-forma
10.0% appreciation · 3.0% rent growth · sell at horizon
- IRR
- 38.2%
- Equity multiple
- 3.94×
- Total profit
- $60,678
- Equity at exit
- $66,440
- IRR
- 32.9%
- Equity multiple
- 8.87×
- Total profit
- $162,530
- Equity at exit
- $143,280
Cash invested: $20,650 (down + closing). Projections, not guarantees.
Landlord ↔ Tenant lean methodology
- Overall (STATE)
- 81 Strongly Landlord-Friendly
- State Missouri
- 81 Strongly Landlord-Friendly · R+10
- County
- — inherits STATE
- City
- — inherits STATE
ZIP-level market 64053
- Home prices YoY
- 17.9%
- Active inventory
- 46
- Price-to-rent
- 6.1×
Monthly cashflow live
- Estimated rent
- $1,002 high interval (Pro) →
- Mortgage (P&I)
- −$387
- Tax from tax record
- −$52 /mo · $625/yr
- Insurance
- −$31
- HOA
- −$0
- Vacancy / Maint / Mgmt
- −$210
- Net cashflow
- $322
Break-even live
UW: 25.0% down · 7.5% · 30yr · 1.5% tax · 5.0% vac · 8.0% maint · 8.0% mgmt
Financing live
Cash to close
- Down payment
- $18,438
- Closing costs
- $2,212
- Reserves months
- —
- Total cash needed
- —
Loan-product check · same deal, 3 products live
Conventional
25% down · 7.5% · 30yr
- Down + closing
- —
- Monthly P&I
- —
- Monthly cashflow
- —
- DSCR
- —
- Eligible?
- —
Personal DTI + credit; lowest rate.
DSCR
20% down · 8.5% · 30yr
- Down + closing
- —
- Monthly P&I
- —
- Monthly cashflow
- —
- DSCR
- —
- Eligible?
- —
No personal income docs; deal must DSCR.
Hard money
10% down · 12.0% · 12mo
- Down + closing
- —
- Monthly P&I
- —
- Monthly cashflow
- —
- DSCR
- —
- Eligible?
- —
Short-term bridge; refi at stabilization.
Rent comps 9 comps
| Address | Beds | Baths | Sqft | Rent | $/sqft | DOM | Units | Dist |
|---|---|---|---|---|---|---|---|---|
| 8705 E Smart Ave Independence, MO | 2.0 | 1.0 | 750 | $1,000 | $1.33 | 43d | 1 | 0.31mi |
| 576 S Oxford Ave Independence, MO | 3.0 | 2.0 | 1098 | $1,400 | $1.28 | 43d | 1 | 0.61mi |
| 600 S Glenwood Ave Unit F Independence, MO | 2.0 | 1.0 | 750 | $995 | $1.33 | 19d | 1 | 0.70mi |
| 600 S Glenwood Ave Unit E Independence, MO | 1.0 | 1.0 | 600 | $725 | $1.21 | 43d | 1 | 0.70mi |
| 600 S Glenwood Ave Unit I Independence, MO | 1.0 | 1.0 | 700 | $695 | $0.99 | 43d | 1 | 0.71mi |
| 9528 E Winner Rd Independence, MO | 1.0–3.0 | 1.0 | 730 | $999 | $1.37 | 43d | 1 | 1.05mi |
| 563 S Ash Ave Unit 3 Independence, MO | 2.0 | 1.0 | 650 | $950 | $1.46 | 1d | 1 | 1.20mi |
| 1601 Blue Ridge Blvd Independence, MO | 1.0 | 1.0 | 515 | $909 | $1.77 | 12d | 3 | 1.26mi |
| 611 Ewing Ave Unit B Kansas City, MO | 1.0 | 1.0 | 700 | $800 | $1.14 | 23d | 1 | 1.48mi |
Listing history 28 events
-
2026-06-18days on market $73,750 Active 111 DOM
-
2026-06-17days on market $73,750 Active 110 DOM
-
2026-06-16days on market $73,750 Active 109 DOM
-
2026-06-15days on market $73,750 Active 108 DOM
-
2026-06-13days on market $73,750 Active 106 DOM
-
2026-06-09days on market $73,750 Active 102 DOM
-
2026-06-08days on market $73,750 Active 101 DOM
-
2026-06-07days on market $73,750 Active 100 DOM
-
2026-06-05days on market $73,750 Active 97 DOM
-
2026-06-03days on market $73,750 Active 96 DOM
-
2026-06-02days on market $73,750 Active 95 DOM
-
2026-06-01days on market $73,750 Active 94 DOM
-
2026-05-31days on market $73,750 Active 93 DOM
-
2026-05-05price $73,750 405-char remark
Show marketing remark (405 chars)
This Fixer upper features a Roof within the Last 2 Years, 200 Amp Service, an Extended Garage in the Basement with ample Room for a Workshop. It also has a Main Floor Laundry plus, the Original Hardwood Floors throughout. The Bathroom has a Shower, No Tub. This house sits on a Treed Corner Lot with an irregular Lot size. Please see Supplements for the Public Lot Plat. Dehumidifier and Window A/C stays.
-
2026-03-31price $78,800 405-char remark
Show marketing remark (405 chars)
This Fixer upper features a Roof within the Last 2 Years, 200 Amp Service, an Extended Garage in the Basement with ample Room for a Workshop. It also has a Main Floor Laundry plus, the Original Hardwood Floors throughout. The Bathroom has a Shower, No Tub. This house sits on a Treed Corner Lot with an irregular Lot size. Please see Supplements for the Public Lot Plat. Dehumidifier and Window A/C stays.
-
2026-02-28$82,800 Active 405-char remark
Show marketing remark (405 chars)
This Fixer upper features a Roof within the Last 2 Years, 200 Amp Service, an Extended Garage in the Basement with ample Room for a Workshop. It also has a Main Floor Laundry plus, the Original Hardwood Floors throughout. The Bathroom has a Shower, No Tub. This house sits on a Treed Corner Lot with an irregular Lot size. Please see Supplements for the Public Lot Plat. Dehumidifier and Window A/C stays.
-
2026-02-25historical $82,800 405-char remark
Show marketing remark (405 chars)
This Fixer upper features a Roof within the Last 2 Years, 200 Amp Service, an Extended Garage in the Basement with ample Room for a Workshop. It also has a Main Floor Laundry plus, the Original Hardwood Floors throughout. The Bathroom has a Shower, No Tub. This house sits on a Treed Corner Lot with an irregular Lot size. Please see Supplements for the Public Lot Plat. Dehumidifier and Window A/C stays.
-
2026-01-02historical
-
2025-11-09price $92,850
-
2025-09-05$100,000 Active
-
2020-07-30historical
-
2020-07-20historical Contingent - Accepting Backup Offers
-
2020-05-01$37,500 Active
-
2009-05-29historical
-
2009-05-26soldstatus
-
2009-05-22soldstatus
-
2009-02-16$19,000
-
1993-09-14soldstatus
ⓘ Source: listings_history table (triggers on properties + properties_extension) + one-shot
backfill from property_details.listing_events for pre-trigger history.
Tax reassessment forecast MO · Resets to sale price
- Current annual tax
- $625 · $52/mo
- Projected year-2 tax
- $715 · $60/mo
- Expected delta
- +$91/yr (+$8/mo · 14.5%)
ⓘ Screening estimate from a state-policy table — verify with the county assessor before closing.
Climate risk First Street
- Flood 1/10 Low FEMA zone X (unshaded) · 0% chance over 30 yrs
- Wildfire 3/10 Moderate
- Heat 4/10 Moderate 7 d/yr ≥107°F today · 17 d/yr by 30 yrs out
- Wind 2/10 Low
- Air quality 3/10 Moderate 2 unhealthy d/yr today · 3 by 30 yrs out
Nearby sold comps map
Loading sold comps map…
Walkable amenities ~0.75 mi
Loading nearby amenities…
Taxation est. · year 1
- Rental income
- $12,027
- − Mortgage interest
- −$4,131
- − Property taxes
- −$625
- − Insurance
- −$369
- − Repairs & maintenance
- −$962
- − Management
- −$962
- − Depreciation
- −$2,145
- Taxable income
- $2,832
- Est. tax owed @ 24.0%
- −$680
- After-tax cash flow
- $3,187/yr
For passive investors: Depreciation is non-cash, so a rental often shows a tax loss while cash-flowing — sheltering income. Rental losses are passive: they offset passive income freely, and up to $25,000/yr can offset ordinary (W-2) income if you actively participate and your MAGI is under $100k (phasing out to $0 by $150k); unused losses carry forward. On sale, claimed depreciation is recaptured at up to 25%, and gains may owe capital-gains tax (a 1031 exchange can defer both). Figures are a year-1 estimate at your 24.0% rate — not tax advice; consult a CPA.
Schools (NCES district)
- District
- Independence 30
- NCES district ID
- 2915480
- Math proficiency
- 26% ▼ -8.00%
- Reading proficiency
- 38% ▼ -5.00%
- Median HH income
- $41,843
- Composite
- 27.04/100
- National rank
- #7054
- State rank
- #252 of 324 in MO
Livability — Independence
- Score
- 82/100
- State rank
- #10
- US rank
- #1296
Category grades
Schools grade is shown separately in the Schools card above.
Census & demographics
- Census place
- Independence, MO
- County
- Jackson County · 687,798 people
- City population
- 117,675
- Metro
- Kansas City, MO-KS
- Population (ZIP)
- 6,775
- Household income
- $47,285
- Rent vs Own
- Severe rent burden
- 330.0
Population outlook (Jackson County) Hauer SSP2
- Today (2025)
- 719,589 people
- By 2030
- 731,456 · +1.6%
- By 2040
- 746,689 · +3.8%
- By 2050
- 749,289 · +4.1%
- By 2075
- 736,227 · +2.3%
- By 2100
- 668,210 · -7.1%
Race, ethnicity, and origin ACS 2023
- Neighborhood character
- Diverse neighborhood (Simpson 0.57)
- Race & ethnicity
- White 59% Hispanic / Latino 28% Two or more races 14% Black 9% Native American 3%
- Hispanic origin (detail)
- Mexican 25%
- Common ancestry
- Italian 12% Lithuanian 3% Slovak 1%
- Foreign-born
- 12% · Canada, China
- Languages at home
- 78% English-only · Spanish 21%
Political lean MEDSL · Jackson
- 2024 margin
- D (+19.3) · D 58.9% · R 39.5% · Other 1.6%
- 2008→2024 swing
- -6.1pp toward R · 2008: 25.4pp · 2024: 19.3pp
- All cycles
- 2024: D+19.3 2020: D+22.0 2016: D+16.6 2012: D+19.0 2008: D+25.4
Not yet ingested
- Civics
- —
Market trends
- HPI YoY
- ▲ 52.69%
- Current HPI
- 347.9512
- Rent YoY
- —
- Metro
- Kansas City, MO-KS
- State GDP YoY
- ▲ 1.84%
- F500 in state
- 20
Industry mix (Fortune 500 HQ in MO)
| Industry | F500 HQs | Revenue |
|---|---|---|
| Healthcare | 1 | $163B |
|
||
| Insurance | 1 | $21B |
|
||
| Industrial Technology | 1 | $17B |
|
||
| Retail | 1 | $16B |
|
||
| Industrial Distribution | 1 | $10B |
|
||
| Utilities | 1 | $9B |
|
||
Price history
+288.2% since first listed15 events — show timeline
- 2026-05-05 Price Changed $73,750 Heartland MLS as Distributed by MLS Grid
- 2026-03-31 Price Changed $78,800 Heartland MLS as Distributed by MLS Grid
- 2026-02-28 Listed $82,800 Heartland MLS as Distributed by MLS Grid
- 2026-02-25 Coming Soon $82,800 Heartland MLS as Distributed by MLS Grid
- 2026-01-02 Listing Removed — Heartland MLS as Distributed by MLS Grid
- 2025-11-09 Price Changed $92,850 Heartland MLS as Distributed by MLS Grid
- 2025-09-05 Listed $100,000 Heartland MLS as Distributed by MLS Grid
- 2020-07-30 Listing Removed — Heartland MLS as Distributed by MLS Grid
- 2020-07-20 Contingent — Heartland MLS as Distributed by MLS Grid
- 2020-05-01 Listed $37,500 Heartland MLS as Distributed by MLS Grid
- 2009-05-29 Listing Removed — Heartland MLS as Distributed by MLS Grid
- 2009-05-26 Sold (Public Records) — Public Records
- 2009-05-22 Sold (MLS) — Heartland MLS as Distributed by MLS Grid
- 2009-02-16 Listed $19,000 Heartland MLS as Distributed by MLS Grid
- 1993-09-14 Sold (Public Records) — Public Records
Property tax history
+4.7%/yrLatest (2025): $625 · -15.9% YoY. Source: county tax records.
Cash-flow waterfall
monthlySold comps — $/sqft
last 12 mo · ≤1 miLoading sold comps…