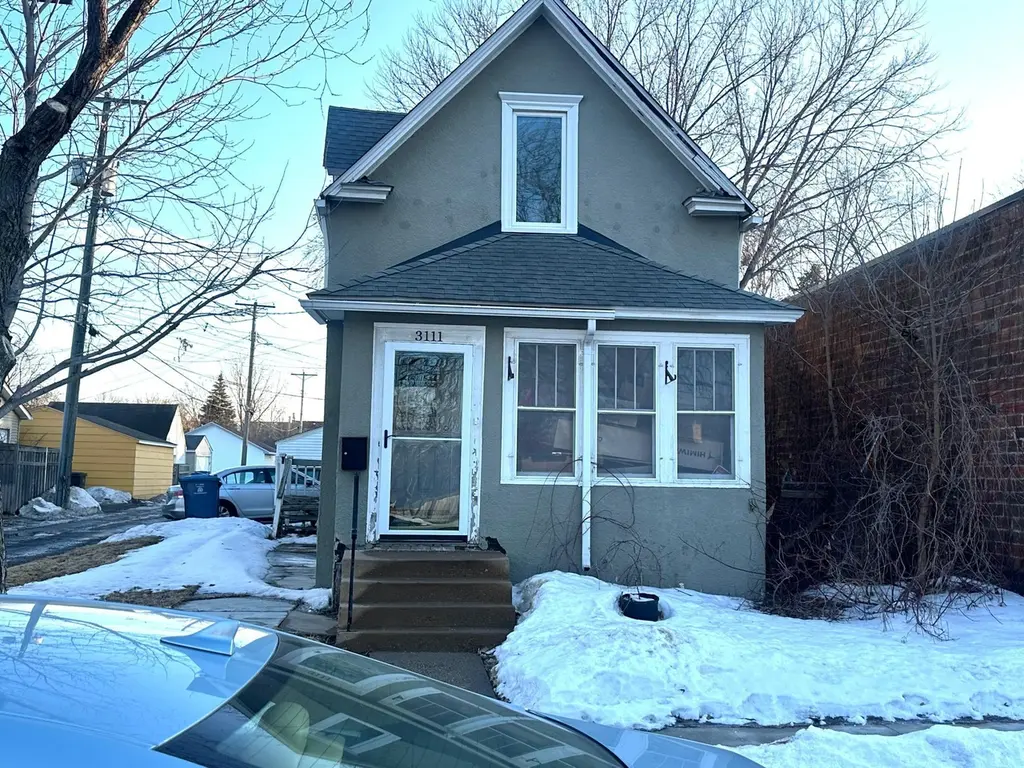
3111 E 42nd St · Minneapolis, MN
Flood risk 1/10 · Minimal
- FEMA flood zone
- X (unshaded)
- Chance of flooding over 30 yrs
- 0.0%
- Est. flood insurance / yr
- $473 – $860
Fire risk 1/10 · Minimal
- Est. fire insurance / yr
- $888 – $1,650
Heat risk 2/10 · Minimal
- Hot days now (above 100°F)
- 7 days/yr
- Hot days in 30 yrs
- 14 days/yr
Wind risk 2/10 · Minimal
- Chance of severe wind over 30 yrs
- —
Air-quality risk 2/10 · Minimal
- Unhealthy air days now
- 1 days/yr
- Unhealthy air days in 30 yrs
- 2 days/yr
Risk factors via First Street. Map © Google.
Why this score? — see what drove the D grade
The composite is a weighted blend of 9 inputs, each scored 0–100. Each bar is that input's sub-score; the figure is the points it added to the 100-point composite (weight × sub-score).
- ARV discount +15.0/15.0
- Cash flow +9.2/30.0
- Livability +3.9/5.0
- Schools +3.5/10.0
- Rent growth +3.2/5.0
- 1% rule +2.7/10.0
- DSCR +2.6/10.0
- Condition / age +2.5/5.0
- Appreciation +0.0/10.0
$229,999
🖨 Deal sheet 📄 Offer letter ✓ Due diligence
Listing remarks MLS
Great opportunity for investment in up and coming neighborhood. This wonderful 1912 home with original woodwork and floors has a lot to offer. This home has been thoroughly updated over the last 15 years including all plumbing, roof (including skylight), all exterior doors and windows, entire kitchen including appliances, upstairs bathroom and garage. Newer, efficient furnace and water heater also. Home is currently occupied, being sold as-is and ready for quick sale. Sellers will contribute $5,000.00 for painting and replacement of basement bathroom fixtures upon completion of sale.
Key facts
- 2,613 sq ft lot
- Garage
- Built 1900
Neighborhood map
What this means for you Summary
Snapshot
- This is a 2-bed/2.0-bath single-family listed at $230k.
Deal economics
- At list price, monthly cash flow is $-174 ($-2k/yr) — negative.
- To cash-flow at today's rent, offer at most $199k (13.3% below list).
- To meet the 1% rule (rent ≥ 1% of price), the offer needs to be $177k (23.0% below list).
- Recommended offer: $177k (23.0% below list) — sets the bar for 1% rule.
- Cap rate 5.4% vs local median 3.1% in Minneapolis — top-decile yield for the area; either an underpriced asset or a hidden risk that comps aren't pricing in. Stress-test before assuming the spread holds.
Location & tenants
- Location reads 78/100 on livability (#110 in MN, #2,525 nationally) — a middle-class / working-renter tenant base. Strengths: amenities A+, commute A+, housing A+; Watch: cost of living C-, crime F.
- Minneapolis Public School District (urban): math 35% / reading 46% proficiency, ranked #217 of 301 in MN (top 72%) — families likely to look elsewhere, expect single-tenant / working-renter base with shorter leases.
- Market conditions: Rents rising (+3.0%/yr); 149 active listings in the ZIP; 18 comparable units currently listed for rent nearby; rentals leasing fast (median 8d on market — plan ~1-2 weeks tenant-placement turnaround); solid renter incomes; 4,651 units permitted in Hennepin County in 2024 (2,443 in 5+ unit buildings).
Forward outlook
- Local home prices are declining (-3.0%/yr); year-one equity from $2k of loan paydown is wiped out by about $7k of value loss. Plan a longer hold.
- Hennepin County population projected at +30% by 2050 — long-run rental-demand tailwind backs the buy-and-hold thesis.
Negotiation context
- It's been on market 126 days — a 12% lower offer ($202k) is reasonable based on typical stale-listing flexibility.
- 13 sale attempts since 33y ago with the ask held roughly flat each time — persistent listings suggest the price (not the market) is what's stuck; bring a comps-based counter.
- Current owner paid $111k; list at $230k implies a 107% gain — meaningful room to come down on a strong offer.
Risks & watch-outs
- Watch-outs: built in 1900 — expect roof / HVAC / electrical / plumbing capex.
Questions for the listing agent
- What do current leases actually rent for vs. the listed asking? Can we see a recent rent roll and the last 12 months of T-12 income?
- It's been on market 126 days. Have you received any prior offers? Is the seller open to a 23% concession, seller financing, or rate buy-down credit?
- Built in 1900 — when were the roof, HVAC, electrical panel, plumbing, and water heater last replaced?
- Why hasn't it sold? Are there any deal-killer items the seller is aware of (foundation, flood, title, zoning, code violations)?
- Is there a deadline driving the sale (1031 exchange, divorce, estate, relocation)? That informs how much negotiation room exists.
- Crime grade is F in this area — have there been break-ins, vandalism, or insurance claims at this property in the last 3 years? What carrier currently insures it and at what premium?
- The area grade is low — what's the realistic commute time and amenity access for the typical tenant pool here? Any planned neighborhood developments (good or bad) we should know about?
- What's the average days-on-market for RENTAL listings here right now (not sales)? A rising rental-DOM trend means longer vacancies and softer asking-rent achievability than the comps imply.
- What's the recent tenant-quality profile in this submarket — average credit score on applications, eviction rate, late-payment / NSF rate, and stable-employment percentage? A property-management company in the area should have these aggregated.
- How much new for-sale + rental construction is in the pipeline within 1–3 miles? Heavy new supply typically softens prices + rents 12–24 months out; constrained supply supports both.
Investment metrics
- 1% rule
- 0.77% ✗
- Cap rate
- 5.39%
- Cash-on-cash
- -3.24%
- DSCR
- 0.86
- GRM
- 10.8
CMA / ARV
- ARV (median comp)
- $288,041
- List price
- $229,999
- Delta
- -20.15%
- Verdict
- UNDERPRICED
- Comps
- 4 within 1.0 mi
Projected returns pro-forma
-3.0% appreciation · 2.99% rent growth · sell at horizon
- IRR
- -21.7%
- Equity multiple
- 0.25×
- Total profit
- $-48,340
- Equity at exit
- $34,294
- IRR
- -15.5%
- Equity multiple
- 0.12×
- Total profit
- $-56,353
- Equity at exit
- $19,886
Cash invested: $64,400 (down + closing). Projections, not guarantees.
Landlord ↔ Tenant lean methodology
- Overall (CITY)
- 34 Tenant-Leaning
- State Minnesota
- 46 Balanced · D+2
- County
- — inherits STATE
- City Minneapolis
- 34 Tenant-Leaning · D+50
ZIP-level market 55406
- Rents YoY
- 3.0%
- Active inventory
- 149
- Price-to-rent
- 10.8×
Monthly cashflow live
- Estimated rent
- $1,771 high interval (Pro) →
- Mortgage (P&I)
- −$1,206
- Tax from tax record
- −$271 /mo · $3,255/yr
- Insurance
- −$96
- HOA
- −$0
- Vacancy / Maint / Mgmt
- −$372
- Net cashflow
- $-174
Break-even live
UW: 25.0% down · 7.5% · 30yr · 1.5% tax · 5.0% vac · 8.0% maint · 8.0% mgmt
Financing live
Cash to close
- Down payment
- $57,500
- Closing costs
- $6,900
- Reserves months
- —
- Total cash needed
- —
Loan-product check · same deal, 3 products live
Conventional
25% down · 7.5% · 30yr
- Down + closing
- —
- Monthly P&I
- —
- Monthly cashflow
- —
- DSCR
- —
- Eligible?
- —
Personal DTI + credit; lowest rate.
DSCR
20% down · 8.5% · 30yr
- Down + closing
- —
- Monthly P&I
- —
- Monthly cashflow
- —
- DSCR
- —
- Eligible?
- —
No personal income docs; deal must DSCR.
Hard money
10% down · 12.0% · 12mo
- Down + closing
- —
- Monthly P&I
- —
- Monthly cashflow
- —
- DSCR
- —
- Eligible?
- —
Short-term bridge; refi at stabilization.
Rent comps 18 comps
| Address | Beds | Baths | Sqft | Rent | $/sqft | DOM | Units | Dist |
|---|---|---|---|---|---|---|---|---|
| 3912 Minnehaha Ave Minneapolis, MN | 2.0 | 1.0 | 650 | $1,495 | $2.30 | 14d | 1 | 0.38mi |
| 3605 E 44th St Minneapolis, MN | 2.0–3.0 | 1.0–1.5 | 825 | $1,437 | $1.74 | 1d | 37 | 0.46mi |
| 3806 28th Ave S Minneapolis, MN | 1.0–2.0 | 1.0–2.0 | 820 | $1,925 | $2.35 | 23d | 3 | 0.56mi |
| 4444 Minnehaha Ave Minneapolis, MN | 1.0 | 1.0 | 735 | $1,362 | $1.85 | 7d | 4 | 0.59mi |
| 3725 29th Ave S Minneapolis, MN | 1.0 | 1.0 | 729 | $1,675 | $2.30 | 2d | 2 | 0.62mi |
| 3806 24th Ave S Minneapolis, MN | 2.0 | 1.0–2.0 | 772 | $2,305 | $2.98 | 3d | 11 | 0.74mi |
| 3120 E 36th St Minneapolis, MN | 2.0 | 1.0 | 585 | $1,925 | $3.29 | 7d | 7 | 0.75mi |
| 3215 E Minnehaha Pkwy Minneapolis, MN | 2.0 | 1.0–2.0 | 1004 | $2,550 | $2.54 | 43d | 4 | 0.78mi |
| 4020 Nawadaha Blvd Minneapolis, MN | 1.0–2.0 | 1.0–2.0 | 795 | $2,388 | $3.00 | 2d | 9 | 0.83mi |
| 4244 45th Ave S Minneapolis, MN | 3.0 | 1.0 | 1200 | $2,200 | $1.83 | 7d | 1 | 0.83mi |
| 3449 Snelling Ave Unit 3451 Minneapolis, MN | 3.0 | 1.0 | 1108 | $1,995 | $1.80 | 14d | 1 | 0.92mi |
| 4556 46th Ave S Unit 109 Minneapolis, MN | 1.0 | 1.0 | 718 | $1,495 | $2.08 | 3d | 1 | 1.01mi |
| 3501 22nd Ave S Unit Upper Minneapolis, MN | 3.0 | 1.0 | 1100 | $1,595 | $1.45 | 24d | 1 | 1.10mi |
| 3501 22nd Ave S Minneapolis, MN | 3.0 | 1.0 | 1100 | $1,595 | $1.45 | 7d | 1 | 1.11mi |
| 3136 Minnehaha Ave Minneapolis, MN | 1.0–2.0 | 1.0 | 577 | $1,745 | $3.02 | 3d | 3 | 1.31mi |
| 3126 Minnehaha Ave Minneapolis, MN | 2.0 | 1.0 | 562 | $1,895 | $3.37 | 7d | 4 | 1.34mi |
| 3320 Longfellow Ave Minneapolis, MN | 2.0 | 1.0 | 950 | $1,798 | $1.89 | 16d | 1 | 1.43mi |
| 4212 13th Ave S Minneapolis, MN | 3.0 | 1.0 | 1500 | $2,250 | $1.50 | 43d | 1 | 1.50mi |
Listing history 47 events
-
2026-06-18days on market $229,999 Active 126 DOM
-
2026-06-17days on market $229,999 Active 125 DOM
-
2026-06-16days on market $229,999 Active 124 DOM
-
2026-06-15days on market $229,999 Active 123 DOM
-
2026-06-13days on market $229,999 Active 121 DOM
-
2026-06-09days on market $229,999 Active 117 DOM
-
2026-06-08days on market $229,999 Active 116 DOM
-
2026-06-07days on market $229,999 Active 115 DOM
-
2026-06-04days on market $229,999 Active 112 DOM
-
2026-06-03days on market $229,999 Active 111 DOM
-
2026-06-02days on market $229,999 Active 110 DOM
-
2026-06-01days on market $229,999 Active 109 DOM
-
2026-05-31days on market $229,999 Active 108 DOM
-
2026-04-09price $229,999 590-char remark
Show marketing remark (590 chars)
Great opportunity for investment in up and coming neighborhood. This wonderful 1912 home with original woodwork and floors has a lot to offer. This home has been thoroughly updated over the last 15 years including all plumbing, roof (including skylight), all exterior doors and windows, entire kitchen including appliances, upstairs bathroom and garage. Newer, efficient furnace and water heater also. Home is currently occupied, being sold as-is and ready for quick sale. Sellers will contribute $5,000.00 for painting and replacement of basement bathroom fixtures upon completion of sale.
-
2026-02-12$242,000 Active 590-char remark
Show marketing remark (590 chars)
Great opportunity for investment in up and coming neighborhood. This wonderful 1912 home with original woodwork and floors has a lot to offer. This home has been thoroughly updated over the last 15 years including all plumbing, roof (including skylight), all exterior doors and windows, entire kitchen including appliances, upstairs bathroom and garage. Newer, efficient furnace and water heater also. Home is currently occupied, being sold as-is and ready for quick sale. Sellers will contribute $5,000.00 for painting and replacement of basement bathroom fixtures upon completion of sale.
-
2012-04-02soldstatus $111,000
-
2012-03-23soldstatus $111,000 267-char remark
Show marketing remark (267 chars)
BEAUTIFUL RENOVATION. NEW KITCHEN, BATH & WOODWORK. 4 BLKS TO LIGHTRAIL. PERFECT CITY LIVING. PRIVATE PATIO, HARDWOOD FLOORS, LANDSCAPING. NEW SS APPL, TILED FLOORS & SHOWERS.OPEN FLOOR PLAN. FRONT & BACK PORCH,LOTS OF STORAGE! BRAND NEW OVERSIZED GARAGE.
-
2012-02-20historical 267-char remark
Show marketing remark (267 chars)
BEAUTIFUL RENOVATION. NEW KITCHEN, BATH & WOODWORK. 4 BLKS TO LIGHTRAIL. PERFECT CITY LIVING. PRIVATE PATIO, HARDWOOD FLOORS, LANDSCAPING. NEW SS APPL, TILED FLOORS & SHOWERS.OPEN FLOOR PLAN. FRONT & BACK PORCH,LOTS OF STORAGE! BRAND NEW OVERSIZED GARAGE.
-
2011-11-29$119,900 267-char remark
Show marketing remark (267 chars)
BEAUTIFUL RENOVATION. NEW KITCHEN, BATH & WOODWORK. 4 BLKS TO LIGHTRAIL. PERFECT CITY LIVING. PRIVATE PATIO, HARDWOOD FLOORS, LANDSCAPING. NEW SS APPL, TILED FLOORS & SHOWERS.OPEN FLOOR PLAN. FRONT & BACK PORCH,LOTS OF STORAGE! BRAND NEW OVERSIZED GARAGE.
-
2011-11-29historical
Show marketing remark (267 chars)
BEAUTIFUL RENOVATION. NEW KITCHEN, BATH & WOODWORK. 4 BLKS TO LIGHTRAIL. PERFECT CITY LIVING. PRIVATE PATIO, HARDWOOD FLOORS, LANDSCAPING. NEW SS APPL, TILED FLOORS & SHOWERS.OPEN FLOOR PLAN. FRONT & BACK PORCH,LOTS OF STORAGE! BRAND NEW OVERSIZED GARAGE.
-
2011-10-06$119,900
-
2011-07-11soldstatus $20,000
-
2011-06-27historical
-
2010-11-02$31,950
-
2010-10-21historical
-
2010-06-23$68,900
-
2010-05-20historical
-
2009-11-20$90,000
-
2004-04-16soldstatus $159,900
-
2004-03-07historical
-
2004-01-05$152,500
-
2000-11-05soldstatus $99,000
-
2000-10-06soldstatus $36,000
-
2000-09-09historical
-
2000-08-10$98,900
-
2000-06-29soldstatus $35,900
-
2000-06-07historical
-
2000-06-06$35,900
-
1998-07-08historical
-
1998-03-08$46,500
-
1997-12-07historical
-
1997-08-07$49,900
-
1996-09-25soldstatus $20,000
-
1994-05-19historical
-
1993-11-19$34,900
-
1993-10-20historical
-
1993-05-21$39,900
ⓘ Source: listings_history table (triggers on properties + properties_extension) + one-shot
backfill from property_details.listing_events for pre-trigger history.
Tax reassessment forecast MN · Partial reset (capped growth)
- Current annual tax
- $3,255 · $271/mo
- Projected year-2 tax
- $3,255 · $271/mo
- Expected delta
- $0/yr ($0/mo · 0.0%)
ⓘ Screening estimate from a state-policy table — verify with the county assessor before closing.
Climate risk First Street
- Flood 1/10 Low FEMA zone X (unshaded) · 0% chance over 30 yrs
- Wildfire 1/10 Low
- Heat 2/10 Low 7 d/yr ≥100°F today · 14 d/yr by 30 yrs out
- Wind 2/10 Low
- Air quality 2/10 Low 1 unhealthy d/yr today · 2 by 30 yrs out
Nearby sold comps map
Loading sold comps map…
Walkable amenities ~0.75 mi
Loading nearby amenities…
Taxation est. · year 1
- Rental income
- $21,257
- − Mortgage interest
- −$12,884
- − Property taxes
- −$3,255
- − Insurance
- −$1,150
- − Repairs & maintenance
- −$1,701
- − Management
- −$1,701
- − Depreciation
- −$6,691
- Taxable loss
- −$6,124
- Est. tax savings @ 24.0%
- +$1,470
- After-tax cash flow
- $-616/yr
For passive investors: Depreciation is non-cash, so a rental often shows a tax loss while cash-flowing — sheltering income. Rental losses are passive: they offset passive income freely, and up to $25,000/yr can offset ordinary (W-2) income if you actively participate and your MAGI is under $100k (phasing out to $0 by $150k); unused losses carry forward. On sale, claimed depreciation is recaptured at up to 25%, and gains may owe capital-gains tax (a 1031 exchange can defer both). Figures are a year-1 estimate at your 24.0% rate — not tax advice; consult a CPA.
Schools (NCES district)
- District
- Minneapolis Public School District
- NCES district ID
- 2721240
- Math proficiency
- 35% ▼ -7.00%
- Reading proficiency
- 46% ▼ -1.00%
- Median HH income
- $50,521
- Composite
- 34.92/100
- National rank
- #5067
- State rank
- #217 of 301 in MN
Livability — Minneapolis
- Score
- 78/100
- State rank
- #110
- US rank
- #2525
Category grades
Schools grade is shown separately in the Schools card above.
Census & demographics
- Census place
- Minneapolis, MN
- County
- Hennepin County · 1,150,272 people
- City population
- 417,555
- Metro
- Minneapolis-St. Paul-Bloomington, MN-WI
- Population (ZIP)
- 36,581
- Household income
- $93,910
- Rent vs Own
- Severe rent burden
- 1026.0
Population outlook (Hennepin County) Hauer SSP2
- Today (2025)
- 1,405,227 people
- By 2030
- 1,492,650 · +6.2%
- By 2040
- 1,660,157 · +18.1%
- By 2050
- 1,823,498 · +29.8%
- By 2075
- 2,221,283 · +58.1%
- By 2100
- 2,509,976 · +78.6%
Race, ethnicity, and origin ACS 2023
- Neighborhood character
- Predominantly White (70%)
- Race & ethnicity
- White 70% Black 12% Two or more races 10% Hispanic / Latino 7% Asian 3%
- Hispanic origin (detail)
- Mexican 4%
- Common ancestry
- Portuguese 11% Romanian 3% Lithuanian 3%
- Foreign-born
- 11% · Canada, South Korea
- Languages at home
- 85% English-only · Spanish 4% Other Indo-European 1% Other Asian/Pacific 1%
Political lean MEDSL · Hennepin
- 2024 margin
- Solid D (+42.6) · D 70.2% · R 27.5% · Other 2.3%
- 2008→2024 swing
- +14.0pp toward D · 2008: 28.6pp · 2024: 42.6pp
- All cycles
- 2024: D+42.6 2020: D+43.2 2016: D+35.3 2012: D+27.1 2008: D+28.6
Not yet ingested
- Civics
- —
Market trends
- HPI YoY
- ▼ -397.38%
- Current HPI
- 266.2546
- Rent YoY
- ▲ 2.99%
- Metro
- Minneapolis-St. Paul-Bloomington, MN-WI
- State GDP YoY
- ▲ 2.41%
- F500 in state
- 34
Industry mix (Fortune 500 HQ in MN)
| Industry | F500 HQs | Revenue |
|---|---|---|
| Healthcare | 2 | $407B |
|
||
| Retail | 2 | $150B |
|
||
| Consumer Goods | 2 | $32B |
|
||
| Industrial Machinery | 2 | $6B |
|
||
| Agriculture | 1 | $40B |
|
||
| Healthcare / Medical Devices | 1 | $32B |
|
||
Price history
+476.4% since first listed34 events — show timeline
- 2026-04-09 Price Changed $229,999 NORTHSTARMLS as Distributed by MLS Grid
- 2026-02-12 Listed $242,000 NORTHSTARMLS as Distributed by MLS Grid
- 2012-04-02 Sold (Public Records) $111,000 Public Records
- 2012-03-23 Sold (MLS) $111,000 NORTHSTARMLS as Distributed by MLS Grid
- 2012-02-20 Listing Removed — NORTHSTARMLS as Distributed by MLS Grid
- 2011-11-29 Listing Removed — NORTHSTARMLS as Distributed by MLS Grid
- 2011-11-29 Listed $119,900 NORTHSTARMLS as Distributed by MLS Grid
- 2011-10-06 Listed $119,900 NORTHSTARMLS as Distributed by MLS Grid
- 2011-07-11 Sold (MLS) $20,000 NORTHSTARMLS as Distributed by MLS Grid
- 2011-06-27 Listing Removed — NORTHSTARMLS as Distributed by MLS Grid
- 2010-11-02 Listed $31,950 NORTHSTARMLS as Distributed by MLS Grid
- 2010-10-21 Listing Removed — NORTHSTARMLS as Distributed by MLS Grid
- 2010-06-23 Listed $68,900 NORTHSTARMLS as Distributed by MLS Grid
- 2010-05-20 Listing Removed — NORTHSTARMLS as Distributed by MLS Grid
- 2009-11-20 Listed $90,000 NORTHSTARMLS as Distributed by MLS Grid
- 2004-04-16 Sold (MLS) $159,900 NORTHSTARMLS as Distributed by MLS Grid
- 2004-03-07 Listing Removed — NORTHSTARMLS as Distributed by MLS Grid
- 2004-01-05 Listed $152,500 NORTHSTARMLS as Distributed by MLS Grid
- 2000-11-05 Sold (MLS) $99,000 NORTHSTARMLS as Distributed by MLS Grid
- 2000-10-06 Sold (Public Records) $36,000 Public Records
- 2000-09-09 Listing Removed — NORTHSTARMLS as Distributed by MLS Grid
- 2000-08-10 Listed $98,900 NORTHSTARMLS as Distributed by MLS Grid
- 2000-06-29 Sold (MLS) $35,900 NORTHSTARMLS as Distributed by MLS Grid
- 2000-06-07 Listing Removed — NORTHSTARMLS as Distributed by MLS Grid
- 2000-06-06 Listed $35,900 NORTHSTARMLS as Distributed by MLS Grid
- 1998-07-08 Listing Removed — NORTHSTARMLS as Distributed by MLS Grid
- 1998-03-08 Listed $46,500 NORTHSTARMLS as Distributed by MLS Grid
- 1997-12-07 Listing Removed — NORTHSTARMLS as Distributed by MLS Grid
- 1997-08-07 Listed $49,900 NORTHSTARMLS as Distributed by MLS Grid
- 1996-09-25 Sold (Public Records) $20,000 Public Records
- 1994-05-19 Listing Removed — NORTHSTARMLS as Distributed by MLS Grid
- 1993-11-19 Listed $34,900 NORTHSTARMLS as Distributed by MLS Grid
- 1993-10-20 Listing Removed — NORTHSTARMLS as Distributed by MLS Grid
- 1993-05-21 Listed $39,900 NORTHSTARMLS as Distributed by MLS Grid
Property tax history
+2.6%/yrLatest (2025): $3,255 · +7.0% YoY. Source: county tax records.
Cash-flow waterfall
monthlySold comps — $/sqft
last 12 mo · ≤1 miLoading sold comps…