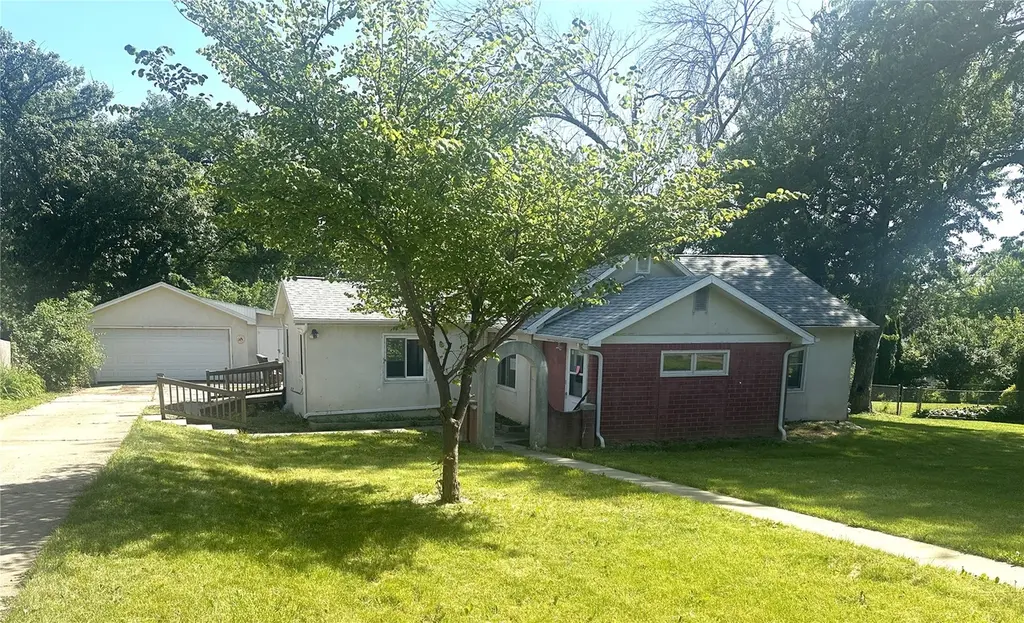
2815 Waveland Dr Dr NW · Cedar Rapids, IA
Flood risk 1/10 · Minimal
- FEMA flood zone
- X (unshaded)
- Chance of flooding over 30 yrs
- 0.0%
- Est. flood insurance / yr
- $473 – $860
Fire risk 1/10 · Minimal
- Est. fire insurance / yr
- $902 – $1,676
Heat risk 3/10 · Minor
- Hot days now (above 103°F)
- 7 days/yr
- Hot days in 30 yrs
- 15 days/yr
Wind risk 2/10 · Minimal
- Chance of severe wind over 30 yrs
- —
Air-quality risk 2/10 · Minimal
- Unhealthy air days now
- 0 days/yr
- Unhealthy air days in 30 yrs
- 1 days/yr
Risk factors via First Street. Map © Google.
Why this score? — see what drove the B grade
The composite is a weighted blend of 9 inputs, each scored 0–100. Each bar is that input's sub-score; the figure is the points it added to the 100-point composite (weight × sub-score).
- Cash flow +25.1/30.0
- ARV discount +15.0/15.0
- DSCR +8.2/10.0
- 1% rule +7.1/10.0
- Rent growth +5.0/5.0
- Schools +4.7/10.0
- Livability +3.9/5.0
- Condition / age +2.5/5.0
- Appreciation +0.0/10.0
$99,900
🖨 Deal sheet (PDF) 📄 Offer letter ✓ Due diligence
Listing remarks
6/11/26_ Offer accepted, waiting on paperwork before marking SP. Investor opportunity! This ranch home offers 3 bedrooms (one currently used as a laundry room), 1 full bath, and plenty of potential. Situated on a nice-sized lot in an established neighborhood with mature trees, the property also features a detached 2-car garage and a deck overlooking the backyard. The home has structual issues, making it a great option for investors, flippers, or buyers looking to build equity through improvements. It is being sold as-is and priced accordingly. Don't miss the chance to unlock this property's potential.
Key facts
- Mature trees
- 0.32 acre lot
- 2 garage spots
Tags
Property features AI
Exterior
- Parking: Detached garage; 2 garage spaces
- Utilities: Public water; Public sewer
- Home design: Single-family residence; Residential property
- Construction: Brick, frame, and stucco construction
- Exterior features: Deck
Interior
- Kitchen: Eat-in kitchen
- Bathrooms: 1 full bathroom
- Heating & cooling: Central air conditioning; Forced air heating
- Interior features: Eat-in kitchen; Full basement
Neighborhood map
What this means for you Summary
Snapshot
- This is a 3-bed/1.0-bath single-family listed at $100k.
Deal economics
- At list price, monthly cash flow is $221 ($3k/yr) — positive.
- The deal already cash-flows at list — no discount required.
- Meets the 1% rule at list price ($1k rent vs $100k).
- Cap rate 8.9% vs local median 3.5% in Cedar Rapids — top-decile yield for the area; either an underpriced asset or a hidden risk that comps aren't pricing in. Stress-test before assuming the spread holds.
Location & tenants
- Location reads 78/100 on livability (#134 in IA, #2,474 nationally) — a middle-class / working-renter tenant base. Strengths: cost of living A+, housing A+, health & safety A+; Watch: crime C-, commute F.
- Cedar Rapids Community School District (urban): math 50% / reading 59% proficiency, ranked #265 of 289 in IA (top 92%) — acceptable for families but not a draw, mixed tenant base, ~2y average lease.
- Zoned schools: Madison Elementary School (math 52% / reading 47%, grade D, #514 of 616 statewide, top 85%, 180 students, 60% FRL); Roosevelt Creative Corridor Business Academy (math 36% / reading 47%, grade F, #235 of 246 statewide, top 96%, 510 students, 69% FRL); John F Kennedy High School (math 63% / reading 77%, grade B+, #146 of 336 statewide, top 45%, 1,714 students, 31% FRL).
- Market conditions: Rents rising fast (+12.4%/yr); 149 active listings in the ZIP; 3 comparable units currently listed for rent nearby; rentals at typical pace (median 15d on market — plan ~3-4 weeks tenant-placement turnaround); 1,023 units permitted in Linn County in 2024 (456 in 5+ unit buildings).
Forward outlook
- Local home prices are declining (-3.0%/yr); year-one equity from $691 of loan paydown is wiped out by about $3k of value loss. Plan a longer hold.
- Linn County population projected at +16% by 2050 — long-run rental-demand tailwind backs the buy-and-hold thesis.
- At projected returns (-3.0% appreciation + 8.0% rent growth), your $28k cash investment doubles in ~8 years — after that, you're playing with house money.
Negotiation context
- Only 9 days on market — expect competitive offers; lowballing is unlikely to land.
- 2 sale attempts since 2y ago with the ask held roughly flat each time — persistent listings suggest the price (not the market) is what's stuck; bring a comps-based counter.
Risks & watch-outs
- Watch-outs: built in 1920 — expect roof / HVAC / electrical / plumbing capex.
Questions for the listing agent
- Built in 1920 — when were the roof, HVAC, electrical panel, plumbing, and water heater last replaced?
- Is there a deadline driving the sale (1031 exchange, divorce, estate, relocation)? That informs how much negotiation room exists.
- Schools are B-rated — typically a magnet for longer-tenancy family renters. What's the average tenant stay here, and is there a school-zone premium baked into asking?
- What's the average days-on-market for RENTAL listings here right now (not sales)? A rising rental-DOM trend means longer vacancies and softer asking-rent achievability than the comps imply.
- What's the recent tenant-quality profile in this submarket — average credit score on applications, eviction rate, late-payment / NSF rate, and stable-employment percentage? A property-management company in the area should have these aggregated.
- How much new for-sale + rental construction is in the pipeline within 1–3 miles? Heavy new supply typically softens prices + rents 12–24 months out; constrained supply supports both.
Investment metrics
- 1% rule
- 1.21% ✓
- Cap rate
- 8.95%
- Cash-on-cash
- 9.48%
- DSCR
- 1.42
- GRM
- 6.9
CMA / ARV
- ARV (on-the-fly)
- $189,888
- Comps found
- 12
Show comp detail 12 sales within ~0.75 mi
| Address | Dist | Beds/Ba | Sqft | Sold | Price | $/sf | Match |
|---|---|---|---|---|---|---|---|
| 631 26th St NW | 0.30mi | 3/1.0 | 1,040 (-6%) | 11mo | $170,000 | $163 | 67 |
| 2630 Westwood Dr NW | 0.16mi | 2/1.0 (-1) | 1,028 (-7%) | 12mo | $126,000 | $123 | 66 |
| 2604 E Ave NW | 0.34mi | 3/2.0 | 1,004 (-9%) | 1mo | $169,900 | $169 | 64 |
| 1112 Woodlark Lane Ln NW | 0.29mi | 3/2.0 | 1,040 (-6%) | 13mo | $203,500 | $196 | 62 |
| 623 27th St St NW | 0.28mi | 3/2.0 | 1,210 (+10%) | 6mo | $169,900 | $140 | 62 |
| 1632 Elaine Dr NW | 0.63mi | 3/1.5 | 1,040 (-6%) | 2mo | $167,000 | $161 | 57 |
| 1600 23rd St St NW | 0.55mi | 3/2.0 | 1,185 (+7%) | 1mo | $215,000 | $181 | 57 |
| 1637 Elaine Dr NW | 0.62mi | 3/1.0 | 1,040 (-6%) | 9mo | $224,900 | $216 | 54 |
| 361 31st St NW | 0.48mi | 3/1.5 | 960 (-13%) | 4mo | $189,000 | $197 | 51 |
| 1625 South Vw NW | 0.58mi | 3/1.0 | 960 (-13%) | 1mo | $194,900 | $203 | 50 |
| 211 Edgewood Rd NW | 0.73mi | 3/1.0 | 960 (-13%) | 5mo | $165,000 | $172 | 40 |
| 1024 Cheyenne Rd Rd NW | 0.72mi | 3/2.0 | 1,246 (+13%) | 2mo | $190,000 | $152 | 39 |
Match score weights: distance 35% · size 25% · config 20% · recency 20%. Top-matched comps best support the ARV.
Projected returns pro-forma
-3.0% appreciation · 8.0% rent growth · sell at horizon
- IRR
- 3.8%
- Equity multiple
- 1.16×
- Total profit
- $4,352
- Equity at exit
- $14,895
- IRR
- 17.8%
- Equity multiple
- 2.83×
- Total profit
- $51,299
- Equity at exit
- $8,638
Cash invested: $27,972 (down + closing). Projections, not guarantees.
Landlord ↔ Tenant lean methodology
- Overall (STATE)
- 83 Strongly Landlord-Friendly
- State Iowa
- 83 Strongly Landlord-Friendly · R+6
- County
- — inherits STATE
- City
- — inherits STATE
ZIP-level market 52405
- Rents YoY
- 12.4%
- Active inventory
- 149
- Price-to-rent
- 6.9×
Monthly cashflow live
- Estimated rent
- $1,213 medium interval (Pro) →
- Mortgage (P&I)
- −$524
- Tax from tax record
- −$172 /mo · $2,064/yr
- Insurance
- −$42
- HOA
- −$0
- Vacancy / Maint / Mgmt
- −$255
- Net cashflow
- $221
Break-even live
Sensitivity live
| Price | -10% $278 | -5% $249 | +0% $221 | +5% $193 | +10% $165 |
|---|---|---|---|---|---|
| Rent | -10% $125 | -5% $173 | +0% $221 | +5% $269 | +10% $317 |
| Rate | -1.0pp $271 | -0.5pp $246 | base $221 | +0.5pp $195 | +1.0pp $169 |
UW: 25.0% down · 7.5% · 30yr · 1.5% tax · 5.0% vac · 8.0% maint · 8.0% mgmt
Financing live
Cash to close
- Down payment
- $24,975
- Closing costs
- $2,997
- Reserves months
- —
- Total cash needed
- —
Loan-product check · same deal, 3 products live
Conventional
25% down · 7.5% · 30yr
- Down + closing
- —
- Monthly P&I
- —
- Monthly cashflow
- —
- DSCR
- —
- Eligible?
- —
Personal DTI + credit; lowest rate.
DSCR
20% down · 8.5% · 30yr
- Down + closing
- —
- Monthly P&I
- —
- Monthly cashflow
- —
- DSCR
- —
- Eligible?
- —
No personal income docs; deal must DSCR.
Hard money
10% down · 12.0% · 12mo
- Down + closing
- —
- Monthly P&I
- —
- Monthly cashflow
- —
- DSCR
- —
- Eligible?
- —
Short-term bridge; refi at stabilization.
Rent comps 3 comps
| Address | Beds | Baths | Sqft | Rent | $/sqft | DOM | Units | Dist |
|---|---|---|---|---|---|---|---|---|
| 1601 30th St NW Unit 1611 6 Cedar Rapids, IA | 2.0 | 1.0 | 847 | $865 | $1.02 | 15d | 1 | 0.46mi |
| 1001 C Ave NW Cedar Rapids, IA | 3.0 | 1.5 | 1446 | $1,500 | $1.04 | 15d | 1 | 1.29mi |
| 417 9th St NW Cedar Rapids, IA | 3.0 | 1.0 | 1061 | $1,300 | $1.23 | 45d | 1 | 1.35mi |
Listing history 9 events
-
2026-06-14statusdays on market $99,900 Pending 9 DOM
-
2026-06-13remarks 608-char remark
-
2026-06-13days on market $99,900 Active 8 DOM
-
2026-06-10days on market $99,900 Active 6 DOM
-
2026-06-09days on market $99,900 Active 5 DOM
-
2026-06-08days on market $99,900 Active 4 DOM
-
2026-06-07days on market $99,900 Active 3 DOM
-
2026-06-05remarks 543-char remark
-
2026-06-05$99,900 Active 1 DOM
ⓘ Source: listings_history table (triggers on properties + properties_extension) + one-shot
backfill from property_details.listing_events for pre-trigger history.
Tax reassessment forecast IA · Partial reset (capped growth)
- Current annual tax
- $2,064 · $172/mo
- Projected year-2 tax
- $2,064 · $172/mo
- Expected delta
- $0/yr ($0/mo · 0.0%)
ⓘ Screening estimate from a state-policy table — verify with the county assessor before closing.
Climate risk First Street
- Flood 1/10 Low FEMA zone X (unshaded) · 0% chance over 30 yrs
- Wildfire 1/10 Low
- Heat 3/10 Moderate 7 d/yr ≥103°F today · 15 d/yr by 30 yrs out
- Wind 2/10 Low
- Air quality 2/10 Low 0 unhealthy d/yr today · 1 by 30 yrs out
Nearby sold comps map
Loading sold comps map…
Walkable amenities ~0.75 mi
Loading nearby amenities…
Taxation est. · year 1
- Rental income
- $14,561
- − Mortgage interest
- −$5,596
- − Property taxes
- −$2,064
- − Insurance
- −$500
- − Repairs & maintenance
- −$1,165
- − Management
- −$1,165
- − Depreciation
- −$2,906
- Taxable income
- $1,165
- Est. tax owed @ 24.0%
- −$280
- After-tax cash flow
- $2,373/yr
For passive investors: Depreciation is non-cash, so a rental often shows a tax loss while cash-flowing — sheltering income. Rental losses are passive: they offset passive income freely, and up to $25,000/yr can offset ordinary (W-2) income if you actively participate and your MAGI is under $100k (phasing out to $0 by $150k); unused losses carry forward. On sale, claimed depreciation is recaptured at up to 25%, and gains may owe capital-gains tax (a 1031 exchange can defer both). Figures are a year-1 estimate at your 24.0% rate — not tax advice; consult a CPA.
Schools (NCES district)
- District
- Cedar Rapids Community School District
- NCES district ID
- 1906540
- Math proficiency
- 50% ▼ -12.00%
- Reading proficiency
- 59% ▼ -6.00%
- Median HH income
- $53,568
- Composite
- 46.82/100
- National rank
- #2378
- State rank
- #265 of 289 in IA
Livability — Cedar Rapids
- Score
- 78/100
- State rank
- #134
- US rank
- #2474
Category grades
Schools grade is shown separately in the Schools card above.
Census & demographics
- Census place
- Cedar Rapids, IA
- County
- Linn County · 179,860 people
- City population
- 137,154
- Metro
- Cedar Rapids, IA
- Population (ZIP)
- 26,526
- Household income
- $70,123
- Rent vs Own
- Severe rent burden
- 715.0
Population outlook (Linn County) Hauer SSP2
- Today (2025)
- 239,589 people
- By 2030
- 248,587 · +3.8%
- By 2040
- 264,817 · +10.5%
- By 2050
- 278,685 · +16.3%
- By 2075
- 311,754 · +30.1%
- By 2100
- 336,773 · +40.6%
Race, ethnicity, and origin ACS 2023
- Neighborhood character
- Predominantly White (79%)
- Race & ethnicity
- White 79% Black 9% Two or more races 7% Hispanic / Latino 5% Asian 2%
- Common ancestry
- Portuguese 4% Lithuanian 2% Iranian 1%
- Foreign-born
- 6% · Canada, China
- Languages at home
- 92% English-only · Spanish 3% French/Haitian/Cajun 1% Other Asian/Pacific 1%
Political lean MEDSL · Linn
- 2024 margin
- Lean D (+9.9) · D 54.2% · R 44.3% · Other 1.4%
- 2008→2024 swing
- -11.6pp toward R · 2008: 21.5pp · 2024: 9.9pp
- All cycles
- 2024: D+9.9 2020: D+13.7 2016: D+9.0 2012: D+17.6 2008: D+21.5
Not yet ingested
- Civics
- —
Market trends
- HPI YoY
- ▼ -137.56%
- Current HPI
- 201.6053
- Rent YoY
- ▲ 12.37%
- Metro
- Cedar Rapids, IA
- State GDP YoY
- ▲ 2.48%
- F500 in state
- 4
Industry mix (Fortune 500 HQ in IA)
| Industry | F500 HQs | Revenue |
|---|---|---|
| Financial Services | 1 | $16B |
|
||
| Retail / Convenience | 1 | $15B |
|
||
Price history
-13.1% since first listed3 events — show timeline
- 2026-06-04 Listed $99,900 CRAAR, CDRMLS
- 2024-01-18 Pending — CRAAR, CDRMLS
- 2024-01-09 Listed $115,000 CRAAR, CDRMLS
Property tax history
+0.9%/yrLatest (2025): $2,064 · +3.3% YoY. Source: county tax records.
Cash-flow waterfall
monthlySold comps — $/sqft
last 12 mo · ≤1 miLoading sold comps…