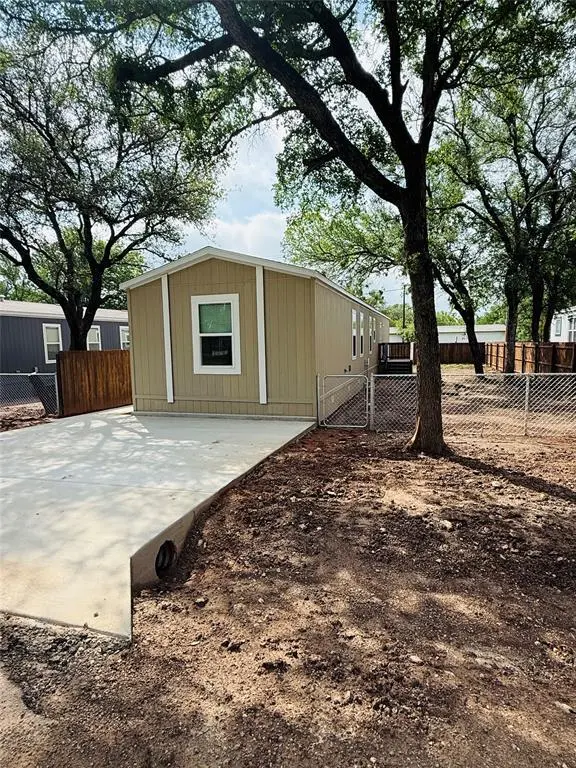
3003 Elmwood Dr · Oak Trail Shores, TX
Flood risk No data
- FEMA flood zone
- —
- Chance of flooding over 30 yrs
- —
- Est. flood insurance / yr
- —
Fire risk No data
- Est. fire insurance / yr
- —
Heat risk No data
- Hot days now (above threshold)
- —
- Hot days in 30 yrs
- —
Wind risk No data
- Chance of severe wind over 30 yrs
- —
Air-quality risk No data
- Unhealthy air days now
- —
- Unhealthy air days in 30 yrs
- —
Risk factors via First Street. Map © Google.
Why this score? — see what drove the C grade
The composite is a weighted blend of 9 inputs, each scored 0–100. Each bar is that input's sub-score; the figure is the points it added to the 100-point composite (weight × sub-score).
- Cash flow +26.7/30.0
- DSCR +9.2/10.0
- 1% rule +7.2/10.0
- Schools +4.0/10.0
- Condition / age +4.0/5.0
- Livability +2.9/5.0
- Rent growth +2.8/5.0
- ARV discount +0.0/15.0
- Appreciation +0.0/10.0
$152,900
🖨 Deal sheet 📄 Offer letter ✓ Due diligence
Listing remarks MLS
Turnkey investment opportunity with tenant in place offering immediate rental income. This well maintained 3 bedroom 2 bathroom home in Granbury Texas is currently leased through January 16 2027 at 1575 per month providing consistent cash flow from day one. This thoughtfully designed home features energy efficient upgrades stainless steel appliances and abundant natural light creating a bright and inviting interior. The open concept layout offers a seamless flow between the living dining and kitchen areas making the home functional for everyday living and appealing for long term tenancy. The spacious primary suite provides comfort and privacy while additional bedrooms offer flexibility for a variety of living needs. Interior highlights include a custom entertainment center with an electric fireplace durable finishes and a layout designed for low maintenance ownership. Exterior features include concrete parking front and rear decks ideal for outdoor use and a fully fenced backyard offering added privacy. The property is conveniently located directly across from the community pool and park with additional nearby parks and a boat ramp contributing to tenant appeal and overall desirability. Close proximity to local shopping dining and area amenities supports continued rental demand. Buyer to verify all information including lease details measurements schools taxes and HOA information.
Key facts
- Front and rear decks
- Electric fireplace
- Concrete parking
Tags
Neighborhood map
What this means for you Summary
Snapshot
- This is a 3-bed/2.0-bath single-family listed at $153k. Condition is rated good.
Deal economics
- At list price, monthly cash flow is $416 ($5k/yr) — positive.
- The deal already cash-flows at list — no discount required.
- Meets the 1% rule at list price ($2k rent vs $153k).
- Recommended offer: $135k (12.0% below list) — sets the bar for market timing.
- Cap rate 9.6% vs local median 5.9% in Oak Trail Shores — top-decile yield for the area; either an underpriced asset or a hidden risk that comps aren't pricing in. Stress-test before assuming the spread holds.
Location & tenants
- Location reads 58/100 on livability (#1,187 in TX) — a working-class tenant base; expect higher turnover. Strengths: cost of living A+, housing A+, crime B+; Watch: health & safety D+, schools F, amenities F.
- Granbury ISD (town): math 46% / reading 46% proficiency, ranked #237 of 826 in TX (top 29%) — families likely to look elsewhere, expect single-tenant / working-renter base with shorter leases.
- Market conditions: Rents rising (+1.1%/yr); 929 active listings in the ZIP; 3 comparable units currently listed for rent nearby; rentals leasing fast (median 1d on market — plan ~1-2 weeks tenant-placement turnaround); 125 units permitted in Hood County in 2024 (0 in 5+ unit buildings).
- This rent runs 32% of the median local income ($70k/yr) — at the standard rent-burdened threshold; future hikes will face affordability resistance.
Forward outlook
- Local home prices are declining (-3.0%/yr); year-one equity from $1k of loan paydown is wiped out by about $5k of value loss. Plan a longer hold.
- Hood County population projected at +29% by 2050 — long-run rental-demand tailwind backs the buy-and-hold thesis.
Negotiation context
- It's been on market 178 days — a 12% lower offer ($135k) is reasonable based on typical stale-listing flexibility.
- 3 sale attempts with the ask held roughly flat each time — persistent listings suggest the price (not the market) is what's stuck; bring a comps-based counter.
Questions for the listing agent
- It's been on market 178 days. Have you received any prior offers? Is the seller open to a 12% concession, seller financing, or rate buy-down credit?
- What does the HOA fee cover, when was the last increase, and are there any pending special assessments or reserve-fund shortfalls?
- Why hasn't it sold? Are there any deal-killer items the seller is aware of (foundation, flood, title, zoning, code violations)?
- Is there a deadline driving the sale (1031 exchange, divorce, estate, relocation)? That informs how much negotiation room exists.
- Schools are F-rated, which usually means shorter tenancies and higher turnover. Who's the typical renter profile here, and what's been the actual vacancy rate?
- What's the average days-on-market for RENTAL listings here right now (not sales)? A rising rental-DOM trend means longer vacancies and softer asking-rent achievability than the comps imply.
- What's the recent tenant-quality profile in this submarket — average credit score on applications, eviction rate, late-payment / NSF rate, and stable-employment percentage? A property-management company in the area should have these aggregated.
- How much new for-sale + rental construction is in the pipeline within 1–3 miles? Heavy new supply typically softens prices + rents 12–24 months out; constrained supply supports both.
Investment metrics
- 1% rule
- 1.22% ✓
- Cap rate
- 9.56%
- Cash-on-cash
- 11.65%
- DSCR
- 1.52
- GRM
- 6.8
CMA / ARV
- ARV (median comp)
- $119,327
- List price
- $152,900
- Delta
- 28.14%
- Verdict
- OVERPRICED
- Comps
- 20 within 1.0 mi
Show comp detail 8 sales within ~0.75 mi
| Address | Dist | Beds/Ba | Sqft | Sold | Price | $/sf | Match |
|---|---|---|---|---|---|---|---|
| 3014 Inwood Trl | 0.14mi | 3/2.0 | 1,232 (+10%) | 8mo | $175,000 | $142 | 70 |
| 3005 Blackjack Ln | 0.13mi | 3/2.0 | 1,279 (+14%) | 5mo | $240,000 | $188 | 66 |
| 2816 Overview Rd | 0.31mi | 2/1.5 (-1) | 1,204 (+7%) | 2mo | $129,000 | $107 | 65 |
| 2906 Cedarhill St | 0.38mi | 3/2.0 | 1,092 (-3%) | 22mo | $110,000 | $101 | 60 |
| 3406 Woodlake Dr | 0.68mi | 3/2.0 | 1,213 (+8%) | 9mo | $217,500 | $179 | 47 |
| 3516 Oak Hill Dr | 0.71mi | 2/2.0 (-1) | 1,056 (-6%) | 19mo | $143,000 | $135 | 36 |
| 4808 Orange Blossom St | 0.71mi | 3/2.0 | 1,216 (+8%) | 22mo | $99,900 | $82 | 34 |
| 2923 Cedarbrush St | 0.42mi | 2/2.0 (-1) | 960 (-14%) | 22mo | $73,000 | $76 | 33 |
Match score weights: distance 35% · size 25% · config 20% · recency 20%. Top-matched comps best support the ARV.
Projected returns pro-forma
-3.0% appreciation · 1.1% rent growth · sell at horizon
- IRR
- -1.1%
- Equity multiple
- 0.96×
- Total profit
- $-1,776
- Equity at exit
- $22,798
- IRR
- 6.4%
- Equity multiple
- 1.44×
- Total profit
- $18,807
- Equity at exit
- $13,220
Cash invested: $42,812 (down + closing). Projections, not guarantees.
Landlord ↔ Tenant lean methodology
- Overall (STATE)
- 87 Strongly Landlord-Friendly
- State Texas
- 87 Strongly Landlord-Friendly · R+5
- County
- — inherits STATE
- City
- — inherits STATE
ZIP-level market 76048
- Home prices YoY
- -23.4%
- Rents YoY
- 1.1%
- Active inventory
- 929
- Price-to-rent
- 6.8×
Monthly cashflow live
- Estimated rent
- $1,873 medium interval (Pro) →
- Mortgage (P&I)
- −$802
- Tax est. 1.5%
- −$191 /mo · $2,294/yr
- Insurance
- −$64
- HOA
- −$7
- Vacancy / Maint / Mgmt
- −$393
- Net cashflow
- $416
Break-even live
UW: 25.0% down · 7.5% · 30yr · 1.5% tax · 5.0% vac · 8.0% maint · 8.0% mgmt
Financing live
Cash to close
- Down payment
- $38,225
- Closing costs
- $4,587
- Reserves months
- —
- Total cash needed
- —
Loan-product check · same deal, 3 products live
Conventional
25% down · 7.5% · 30yr
- Down + closing
- —
- Monthly P&I
- —
- Monthly cashflow
- —
- DSCR
- —
- Eligible?
- —
Personal DTI + credit; lowest rate.
DSCR
20% down · 8.5% · 30yr
- Down + closing
- —
- Monthly P&I
- —
- Monthly cashflow
- —
- DSCR
- —
- Eligible?
- —
No personal income docs; deal must DSCR.
Hard money
10% down · 12.0% · 12mo
- Down + closing
- —
- Monthly P&I
- —
- Monthly cashflow
- —
- DSCR
- —
- Eligible?
- —
Short-term bridge; refi at stabilization.
Rent comps 3 comps
| Address | Beds | Baths | Sqft | Rent | $/sqft | DOM | Units | Dist |
|---|---|---|---|---|---|---|---|---|
| 4321 Terri Lee Ln Granbury, TX | 4.0 | 2.0 | 1387 | $2,075 | $1.50 | 1d | 1 | 0.24mi |
| 3225 Evergreen Dr Granbury, TX | 3.0 | 1.0 | 916 | $1,425 | $1.56 | 1d | 1 | 0.51mi |
| 5418 Lake View Dr Granbury, TX | 3.0 | 2.0 | 1284 | $1,300 | $1.01 | 43d | 1 | 1.42mi |
HOA detail
- Monthly dues
- $7 · $84/yr
- Likely covers
- electricpool
Listing history 31 events
-
2026-06-18days on market $152,900 Active 178 DOM
-
2026-06-17days on market $152,900 Active 177 DOM
-
2026-06-16days on market $152,900 Active 176 DOM
-
2026-06-15days on market $152,900 Active 175 DOM
-
2026-06-13days on market $152,900 Active 173 DOM
-
2026-06-09days on market $152,900 Active 169 DOM
-
2026-06-08days on market $152,900 Active 168 DOM
-
2026-06-07days on market $152,900 Active 167 DOM
-
2026-06-04days on market $152,900 Active 164 DOM
-
2026-06-03days on market $152,900 Active 163 DOM
-
2026-06-02days on market $152,900 Active 162 DOM
-
2026-06-02days on market $152,900 Active 161 DOM
-
2026-05-31days on market $152,900 Active 160 DOM
-
2026-04-01price $152,900 1415-char remark
Show marketing remark (1415 chars)
Turnkey investment opportunity with tenant in place offering immediate rental income. This well maintained 3 bedroom 2 bathroom home in Granbury Texas is currently leased through January 16 2027 at 1575 per month providing consistent cash flow from day one. This thoughtfully designed home features energy efficient upgrades stainless steel appliances and abundant natural light creating a bright and inviting interior. The open concept layout offers a seamless flow between the living dining and kitchen areas making the home functional for everyday living and appealing for long term tenancy. The spacious primary suite provides comfort and privacy while additional bedrooms offer flexibility for a variety of living needs. Interior highlights include a custom entertainment center with an electric fireplace durable finishes and a layout designed for low maintenance ownership. Exterior features include concrete parking front and rear decks ideal for outdoor use and a fully fenced backyard offering added privacy. The property is conveniently located directly across from the community pool and park with additional nearby parks and a boat ramp contributing to tenant appeal and overall desirability. Close proximity to local shopping dining and area amenities supports continued rental demand. Buyer to verify all information including lease details measurements schools taxes and HOA information.
-
2026-01-16historical $1,575
-
2025-12-22$157,500 Active 1415-char remark
Show marketing remark (1415 chars)
Turnkey investment opportunity with tenant in place offering immediate rental income. This well maintained 3 bedroom 2 bathroom home in Granbury Texas is currently leased through January 16 2027 at 1575 per month providing consistent cash flow from day one. This thoughtfully designed home features energy efficient upgrades stainless steel appliances and abundant natural light creating a bright and inviting interior. The open concept layout offers a seamless flow between the living dining and kitchen areas making the home functional for everyday living and appealing for long term tenancy. The spacious primary suite provides comfort and privacy while additional bedrooms offer flexibility for a variety of living needs. Interior highlights include a custom entertainment center with an electric fireplace durable finishes and a layout designed for low maintenance ownership. Exterior features include concrete parking front and rear decks ideal for outdoor use and a fully fenced backyard offering added privacy. The property is conveniently located directly across from the community pool and park with additional nearby parks and a boat ramp contributing to tenant appeal and overall desirability. Close proximity to local shopping dining and area amenities supports continued rental demand. Buyer to verify all information including lease details measurements schools taxes and HOA information.
-
2025-12-20$1,575
-
2025-12-16historical
-
2025-11-25price $167,000
-
2025-11-15price $168,000
-
2025-10-27price $168,500
-
2025-10-08price $169,000
-
2025-09-26price $172,500
-
2025-08-26price $173,000
-
2025-07-22price $174,000
-
2025-07-10price $175,000
-
2025-06-10price $176,500
-
2025-06-10price $166,500
-
2025-05-27price $177,500
-
2025-04-26price $178,500
-
2025-03-20$179,000 Active
ⓘ Source: listings_history table (triggers on properties + properties_extension) + one-shot
backfill from property_details.listing_events for pre-trigger history.
Nearby sold comps map
Loading sold comps map…
Walkable amenities ~0.75 mi
Loading nearby amenities…
Taxation est. · year 1
- Rental income
- $22,473
- − Mortgage interest
- −$8,565
- − Property taxes
- −$2,294
- − Insurance
- −$764
- − Repairs & maintenance
- −$1,798
- − Management
- −$1,798
- − HOA
- −$84
- − Depreciation
- −$4,448
- Taxable income
- $2,722
- Est. tax owed @ 24.0%
- −$653
- After-tax cash flow
- $4,336/yr
For passive investors: Depreciation is non-cash, so a rental often shows a tax loss while cash-flowing — sheltering income. Rental losses are passive: they offset passive income freely, and up to $25,000/yr can offset ordinary (W-2) income if you actively participate and your MAGI is under $100k (phasing out to $0 by $150k); unused losses carry forward. On sale, claimed depreciation is recaptured at up to 25%, and gains may owe capital-gains tax (a 1031 exchange can defer both). Figures are a year-1 estimate at your 24.0% rate — not tax advice; consult a CPA.
Condition & rehab AI · 12 photos
This well-maintained single-family home in Granbury, Texas is currently leased and offers immediate rental income. It features modern appliances, an open concept layout, and energy-efficient upgrades, making it a turnkey investment opportunity.
Value-add opportunities
- Both Painting exterior and interior walls — Fresh paint can enhance curb appeal and interior aesthetics
- Both Landscaping and curb appeal improvements — A well-maintained yard can increase both resale and rental value
- Both Add a small outdoor seating area — This can increase the home's appeal for both buyers and renters
Renovation cost estimate screening
Value-add ROI direction
- Both Painting exterior and interior walls — Fresh paint can enhance curb appeal and interior aesthetics ↑
- Both Landscaping and curb appeal improvements — A well-maintained yard can increase both resale and rental value ↑
- Both Add a small outdoor seating area — This can increase the home's appeal for both buyers and renters ↑
ⓘ Cost ranges are severity-bucket heuristics (US national rule-of-thumb). Get contractor quotes + a written scope before underwriting a rehab budget.
Schools (NCES district)
- District
- Granbury ISD
- NCES district ID
- 4821390
- Math proficiency
- 46% ▬ 0.00%
- Reading proficiency
- 46% ▲ 4.00%
- Median HH income
- $55,856
- Composite
- 40.04/100
- National rank
- #3820
- State rank
- #237 of 826 in TX
Livability — Oak Trail Shores
- Score
- 58/100
- State rank
- #1187
- US rank
- #20758
Category grades
Schools grade is shown separately in the Schools card above.
Census & demographics
- Census place
- Oak Trail Shores, TX
- County
- Hood County · 58,506 people
- Metro
- Granbury, TX
- Population (ZIP)
- 27,000
- Household income
- $70,346
- Rent vs Own
- Severe rent burden
- 612.0
Population outlook (Hood County) Hauer SSP2
- Today (2025)
- 63,502 people
- By 2030
- 67,459 · +6.2%
- By 2040
- 74,958 · +18.0%
- By 2050
- 81,922 · +29.0%
- By 2075
- 98,872 · +55.7%
- By 2100
- 107,796 · +69.8%
Race, ethnicity, and origin ACS 2023
- Neighborhood character
- Predominantly White (80%)
- Race & ethnicity
- White 80% Hispanic / Latino 14% Two or more races 11% Black 1%
- Hispanic origin (detail)
- Mexican 13%
- Common ancestry
- Italian 2% Slovak 2% Portuguese 1%
- Foreign-born
- 4% · Canada
- Languages at home
- 89% English-only · Spanish 10%
Political lean MEDSL · Hood
- 2024 margin
- Solid R (+66.0) · D 16.6% · R 82.6%
- 2008→2024 swing
- -11.9pp toward R · 2008: -54.0pp · 2024: -66.0pp
- All cycles
- 2024: R+66.0 2020: R+64.1 2016: R+66.5 2012: R+64.7 2008: R+54.0
Not yet ingested
- Civics
- —
Market trends
- HPI YoY
- ▼ -83.25%
- Current HPI
- 272.2126
- Rent YoY
- ▲ 1.10%
- Metro
- Granbury, TX
- State GDP YoY
- ▲ 3.95%
- F500 in state
- 110
Industry mix (Fortune 500 HQ in TX)
| Industry | F500 HQs | Revenue |
|---|---|---|
| Energy | 16 | $1,198B |
|
||
| Technology | 5 | $198B |
|
||
| Engineering / Construction | 4 | $72B |
|
||
| Energy Services | 3 | $60B |
|
||
| Utilities | 3 | $41B |
|
||
| Healthcare | 2 | $330B |
|
||
Price history
-14.6% since first listed18 events — show timeline
- 2026-04-01 Price Changed $152,900 NTREIS
- 2026-01-16 Rental Removed $1,575 NTREIS
- 2025-12-22 Listed $157,500 NTREIS
- 2025-12-20 Listed for Rent $1,575 NTREIS
- 2025-12-16 Listing Removed — NTREIS
- 2025-11-25 Price Changed $167,000 NTREIS
- 2025-11-15 Price Changed $168,000 NTREIS
- 2025-10-27 Price Changed $168,500 NTREIS
- 2025-10-08 Price Changed $169,000 NTREIS
- 2025-09-26 Price Changed $172,500 NTREIS
- 2025-08-26 Price Changed $173,000 NTREIS
- 2025-07-22 Price Changed $174,000 NTREIS
- 2025-07-10 Price Changed $175,000 NTREIS
- 2025-06-10 Price Changed $176,500 NTREIS
- 2025-06-10 Price Changed $166,500 NTREIS
- 2025-05-27 Price Changed $177,500 NTREIS
- 2025-04-26 Price Changed $178,500 NTREIS
- 2025-03-20 Listed $179,000 NTREIS
Cash-flow waterfall
monthlySold comps — $/sqft
last 12 mo · ≤1 miLoading sold comps…