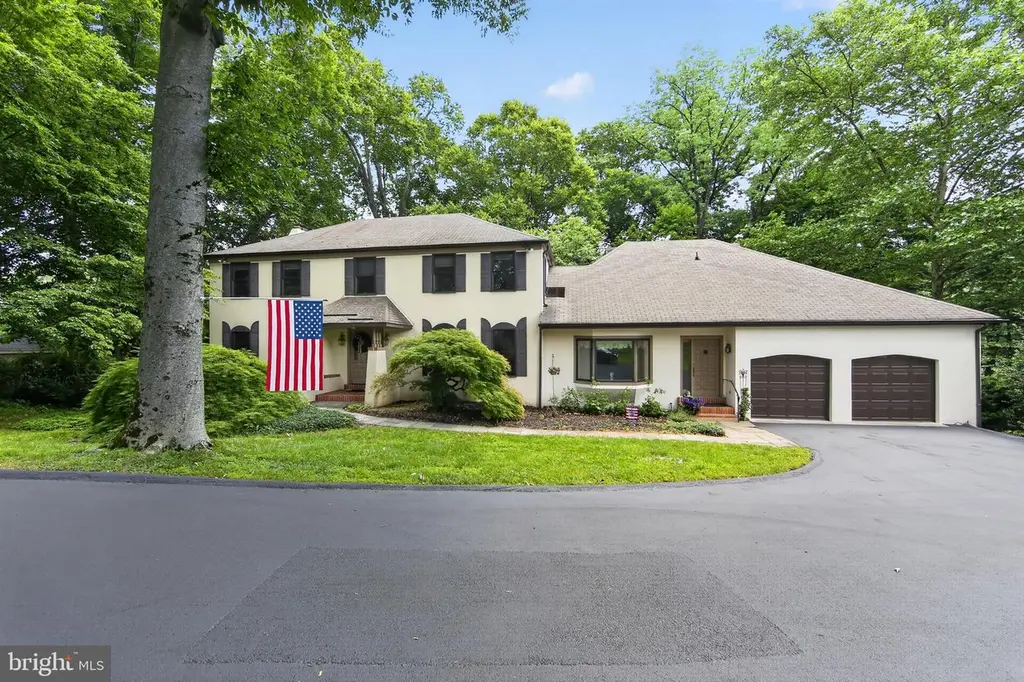
2119 County Line Rd · Lower Merion, PA
Flood risk 1/10 · Minimal
- FEMA flood zone
- X (unshaded)
- Chance of flooding over 30 yrs
- 0.0%
- Est. flood insurance / yr
- $473 – $860
Fire risk 3/10 · Minor
- Est. fire insurance / yr
- $511 – $949
Heat risk 5/10 · Moderate
- Hot days now (above 101°F)
- 7 days/yr
- Hot days in 30 yrs
- 15 days/yr
Wind risk 6/10 · Moderate
- Chance of severe wind over 30 yrs
- 27.0%
Air-quality risk 4/10 · Minor
- Unhealthy air days now
- 5 days/yr
- Unhealthy air days in 30 yrs
- 8 days/yr
Risk factors via First Street. Map © Google.
Why this score? — see what drove the D+ grade
The composite is a weighted blend of 9 inputs, each scored 0–100. Each bar is that input's sub-score; the figure is the points it added to the 100-point composite (weight × sub-score).
- ARV discount +15.0/15.0
- Cash flow +11.9/30.0
- Schools +7.3/10.0
- DSCR +3.5/10.0
- 1% rule +3.4/10.0
- Rent growth +2.5/5.0
- Livability +2.5/5.0
- Condition / age +2.5/5.0
- Appreciation +0.0/10.0
$1,150,000
🖨 Deal sheet 📄 Offer letter ✓ Due diligence
Listing remarks
Set back from the road on a beautifully landscaped lot, this sprawling colonial with first-floor in-law suite combines versatility with privacy and charm in a prime Main Line location just minutes from Villanova University and the renowned Stoneleigh Gardens. A stone pathway leads to the front porch and into a seamless interior where hardwood floors, distinctive moldings and generously sized gathering spaces create a warm, inviting atmosphere throughout. Just off the foyer, a sunlit living room overlooks the lush front and side yards and flows into a family room with beamed ceiling, gas fireplace and sliding glass doors opening to the rear deck and private backyard. The adjoining eat-in kit
Key facts
- 0.77 acre lot
- 2 garage spots
- Built 1978
Property features AI
Exterior
- Parking: Attached garage with front entry and inside access; Garage door opener; Two attached garage spaces; Driveway parking for four cars; Six total garage and parking spaces
- Utilities: Public water; Public sewer; Cable TV available; Hot water: natural gas
- Home design: Detached structure; Shingle roof
- Construction: Built by Bernie Drueding; Stucco exterior; Block foundation
- Exterior features: Deck(s); Outside entrance to basement; Walkout-level basement; Unfinished basement with interior access
Interior
- Kitchen: Eat-in kitchen; Breakfast area; Second kitchen (additional)
- Bedrooms: Four bedrooms on the first upper level; One bedroom on the main level
- Flooring: Hardwood; Carpet; Ceramic tile
- Bathrooms: Three full bathrooms total; Two full bathrooms on the first upper level; One full bathroom on the main level; One half bathroom on the main level
- Heating & cooling: Central heating (natural gas); Central air conditioning (natural gas)
- Interior features: Second kitchen; Walk-in shower in bathroom; Entry-level bedroom; Family room off the kitchen; Formal separate dining room; Eat-in kitchen; Attic; Breakfast area; Ceiling fans; Traditional floor plan; Walk-in closets; Wood floors
- Laundry & utility: Laundry on the main floor
Neighborhood map
What this means for you Summary
Snapshot
- This is a 5-bed/3.5-bath single-family listed at $1.15M.
Deal economics
- At list price, monthly cash flow is $-302 ($-4k/yr) — negative.
- To cash-flow at today's rent, offer at most $1.10M (4.6% below list).
- To meet the 1% rule (rent ≥ 1% of price), the offer needs to be $961k (16.4% below list).
- Recommended offer: $961k (16.4% below list) — sets the bar for 1% rule.
Location & tenants
- Location reads: area grade D — affects rentability + tenant quality, not the cash-flow math above.
- Lower Merion SD (suburban): math 74% / reading 84% proficiency, ranked #3 of 539 in PA (top 1%) — strong family-tenant draw, lease renewals of 3-5y typical; only 7% free/reduced lunch — higher-income household profile.
- Zoned schools: Black Rock Ms (1,032 students, 13% FRL); Harriton Shs (math 85%, 1,261 students, 14% FRL).
- Market conditions: 35 active listings in the ZIP; 3 comparable units currently listed for rent nearby; rentals leasing fast (median 1d on market — plan ~1-2 weeks tenant-placement turnaround); 1,936 units permitted in Montgomery County in 2024 (530 in 5+ unit buildings).
Forward outlook
- Local home prices are declining (-3.0%/yr); year-one equity from $8k of loan paydown is wiped out by about $34k of value loss. Plan a longer hold.
- Montgomery County population projected at +5% by 2050 — modest demand growth; plan on rents tracking national, not racing it.
Negotiation context
- Only 5 days on market — expect competitive offers; lowballing is unlikely to land.
- Current owner paid $690k; list at $1.15M implies a 67% gain — meaningful room to come down on a strong offer.
Risks & watch-outs
- Climate carrying-cost: major wind risk, 27% chance of damaging wind over 30y; extreme-heat days projected 7→15/yr by 2055 (HVAC capex compounding) — expect insurance premiums to compound above CPI over the hold.
Questions for the listing agent
- What do current leases actually rent for vs. the listed asking? Can we see a recent rent roll and the last 12 months of T-12 income?
- Built in 1978 — when were the roof, HVAC, electrical panel, plumbing, and water heater last replaced?
- Is there a deadline driving the sale (1031 exchange, divorce, estate, relocation)? That informs how much negotiation room exists.
- The area grade is low — what's the realistic commute time and amenity access for the typical tenant pool here? Any planned neighborhood developments (good or bad) we should know about?
- What's the average days-on-market for RENTAL listings here right now (not sales)? A rising rental-DOM trend means longer vacancies and softer asking-rent achievability than the comps imply.
- What's the recent tenant-quality profile in this submarket — average credit score on applications, eviction rate, late-payment / NSF rate, and stable-employment percentage? A property-management company in the area should have these aggregated.
- How much new for-sale + rental construction is in the pipeline within 1–3 miles? Heavy new supply typically softens prices + rents 12–24 months out; constrained supply supports both.
Investment metrics
- 1% rule
- 0.84% ✗
- Cap rate
- 5.98%
- Cash-on-cash
- -1.12%
- DSCR
- 0.95
- GRM
- 10.0
CMA / ARV
- ARV (on-the-fly)
- $1,547,312
- Comps found
- 12
Show comp detail 12 sales within ~0.75 mi
| Address | Dist | Beds/Ba | Sqft | Sold | Price | $/sf | Match |
|---|---|---|---|---|---|---|---|
| 515 Candace Ln | 0.18mi | 5/3.5 | 4,310 (-4%) | 19mo | $1,775,000 | $412 | 68 |
| 325 Tory Turn | 0.39mi | 4/3.5 (-1) | 4,487 (-0%) | 12mo | $1,150,000 | $256 | 66 |
| 500 Candace Ln | 0.11mi | 5/3.5 | 3,932 (-13%) | 12mo | $1,350,000 | $343 | 64 |
| 1901 W Montgomery Ave | 0.59mi | 5/4.5 | 4,478 (-0%) | 10mo | $1,600,000 | $357 | 60 |
| 1236 Denbigh Ln | 0.44mi | 4/4.0 (-1) | 3,926 (-13%) | 1mo | $1,350,000 | $344 | 50 |
| 1935 Stone Ridge Ln | 0.41mi | 5/3.0 | 4,018 (-11%) | 21mo | $1,306,000 | $325 | 44 |
| 1239 Denbigh Ln | 0.54mi | 4/5.0 (-1) | 4,245 (-6%) | 13mo | $1,485,000 | $350 | 43 |
| 1222 Denbigh Ln | 0.52mi | 5/4.5 | 4,087 (-9%) | 18mo | $1,650,000 | $404 | 41 |
| 301 Saybrook Rd | 0.26mi | 4/4.5 (-1) | 3,922 (-13%) | 22mo | $1,149,000 | $293 | 40 |
| 1207 Denbigh Ln | 0.58mi | 4/3.5 (-1) | 4,893 (+9%) | 20mo | $1,425,000 | $291 | 36 |
| 601 Spruce Ln | 0.69mi | 5/4.5 | 5,078 (+13%) | 13mo | $2,700,000 | $532 | 32 |
| 401 Clairemont Rd | 0.59mi | 5/4.0 | 3,985 (-11%) | 24mo | $1,225,000 | $307 | 32 |
Match score weights: distance 35% · size 25% · config 20% · recency 20%. Top-matched comps best support the ARV.
Projected returns pro-forma
-3.0% appreciation · 3.0% rent growth · sell at horizon
- IRR
- -18.1%
- Equity multiple
- 0.36×
- Total profit
- $-205,447
- Equity at exit
- $171,469
- IRR
- -10.4%
- Equity multiple
- 0.37×
- Total profit
- $-203,177
- Equity at exit
- $99,431
Cash invested: $322,000 (down + closing). Projections, not guarantees.
Landlord ↔ Tenant lean methodology
- Overall (STATE)
- 62 Landlord-Friendly
- State Pennsylvania
- 62 Landlord-Friendly · EVEN
- County
- — inherits STATE
- City
- — inherits STATE
ZIP-level market 19085
- Active inventory
- 35
- Price-to-rent
- 10.0×
Monthly cashflow live
- Estimated rent
- $9,612 medium interval (Pro) →
- Mortgage (P&I)
- −$6,031
- Tax from tax record
- −$1,385 /mo · $16,619/yr
- Insurance
- −$479
- HOA
- −$0
- Vacancy / Maint / Mgmt
- −$2,018
- Net cashflow
- $-302
Break-even live
UW: 25.0% down · 7.5% · 30yr · 1.5% tax · 5.0% vac · 8.0% maint · 8.0% mgmt
Financing live
Cash to close
- Down payment
- $287,500
- Closing costs
- $34,500
- Reserves months
- —
- Total cash needed
- —
Loan-product check · same deal, 3 products live
Conventional
25% down · 7.5% · 30yr
- Down + closing
- —
- Monthly P&I
- —
- Monthly cashflow
- —
- DSCR
- —
- Eligible?
- —
Personal DTI + credit; lowest rate.
DSCR
20% down · 8.5% · 30yr
- Down + closing
- —
- Monthly P&I
- —
- Monthly cashflow
- —
- DSCR
- —
- Eligible?
- —
No personal income docs; deal must DSCR.
Hard money
10% down · 12.0% · 12mo
- Down + closing
- —
- Monthly P&I
- —
- Monthly cashflow
- —
- DSCR
- —
- Eligible?
- —
Short-term bridge; refi at stabilization.
Rent comps 3 comps
| Address | Beds | Baths | Sqft | Rent | $/sqft | DOM | Units | Dist |
|---|---|---|---|---|---|---|---|---|
| 713 Woodfield Rd Villanova, PA | 5.0 | 3.5 | 3100 | $7,950 | $2.56 | 43d | 1 | 0.66mi |
| 713 Woodfield Rd Villanova, PA | 5.0 | 3.5 | 3100 | $8,000 | $2.58 | 1d | 1 | 0.66mi |
| 841 Mount Moro Rd Villanova, PA | 5.0 | 4.5 | 6087 | $16,500 | $2.71 | 1d | 1 | 1.48mi |
Listing history 6 events
-
2026-06-18days on market $1,150,000 Active 5 DOM
-
2026-06-17days on market $1,150,000 Active 4 DOM
-
2026-06-16days on market $1,150,000 Active 3 DOM
-
2026-06-15days on market $1,150,000 Active 2 DOM
-
2026-06-13remarks 699-char remark
-
2026-06-13$1,150,000 Active 1 DOM
ⓘ Source: listings_history table (triggers on properties + properties_extension) + one-shot
backfill from property_details.listing_events for pre-trigger history.
Tax reassessment forecast PA · Partial reset (capped growth)
- Current annual tax
- $16,619 · $1,385/mo
- Projected year-2 tax
- $17,395 · $1,450/mo
- Expected delta
- +$775/yr (+$65/mo · 4.7%)
ⓘ Screening estimate from a state-policy table — verify with the county assessor before closing.
Climate risk First Street
- Flood 1/10 Low FEMA zone X (unshaded) · 0% chance over 30 yrs
- Wildfire 3/10 Moderate
- Heat 5/10 Major 7 d/yr ≥101°F today · 15 d/yr by 30 yrs out
- Wind 6/10 Major 27% chance of damaging wind over 30 yrs
- Air quality 4/10 Moderate 5 unhealthy d/yr today · 8 by 30 yrs out
Nearby sold comps map
Loading sold comps map…
Walkable amenities ~0.75 mi
Loading nearby amenities…
Taxation est. · year 1
- Rental income
- $115,340
- − Mortgage interest
- −$64,418
- − Property taxes
- −$16,619
- − Insurance
- −$5,750
- − Repairs & maintenance
- −$9,227
- − Management
- −$9,227
- − Depreciation
- −$33,455
- Taxable loss
- −$23,356
- Est. tax savings @ 24.0%
- +$5,605
- After-tax cash flow
- $1,986/yr
For passive investors: Depreciation is non-cash, so a rental often shows a tax loss while cash-flowing — sheltering income. Rental losses are passive: they offset passive income freely, and up to $25,000/yr can offset ordinary (W-2) income if you actively participate and your MAGI is under $100k (phasing out to $0 by $150k); unused losses carry forward. On sale, claimed depreciation is recaptured at up to 25%, and gains may owe capital-gains tax (a 1031 exchange can defer both). Figures are a year-1 estimate at your 24.0% rate — not tax advice; consult a CPA.
Schools (NCES district)
- District
- Lower Merion SD
- NCES district ID
- 4214160
- Math proficiency
- 74% ▼ -5.00%
- Reading proficiency
- 84% ▼ -4.00%
- Median HH income
- $113,035
- Composite
- 72.82/100
- National rank
- #194
- State rank
- #3 of 539 in PA
Livability — Lower Merion
No livability data for this city. (Only ~50 U.S. cities are tracked.)
Census & demographics
- Population (ZIP)
- 10,679
Population outlook (Montgomery County) Hauer SSP2
- Today (2025)
- 856,074 people
- By 2030
- 870,887 · +1.7%
- By 2040
- 891,195 · +4.1%
- By 2050
- 896,417 · +4.7%
- By 2075
- 903,212 · +5.5%
- By 2100
- 843,240 · -1.5%
Race, ethnicity, and origin ACS 2023
- Neighborhood character
- Predominantly White (76%)
- Race & ethnicity
- White 76% Asian 8% Two or more races 6% Hispanic / Latino 5% Black 5%
- Hispanic origin (detail)
- Common ancestry
- Romanian 6% Scotch-Irish 3% Slovak 2%
- Foreign-born
- 9% · Canada, Vietnam, South Korea
- Languages at home
- 84% English-only · Spanish 4% Other Indo-European 3% Vietnamese 2%
Political lean MEDSL · Montgomery
- 2024 margin
- Strong D (+22.8) · D 60.9% · R 38.1% · Other 1.1%
- 2008→2024 swing
- +2.0pp toward D · 2008: 20.8pp · 2024: 22.8pp
- All cycles
- 2024: D+22.8 2020: D+26.3 2016: D+21.1 2012: D+14.3 2008: D+20.8
Not yet ingested
- Civics
- —
Market trends
- HPI YoY
- ▼ -355.53%
- Current HPI
- 286.5602
- Rent YoY
- —
- Metro
- —
- State GDP YoY
- ▲ 1.68%
- F500 in state
- 34
Industry mix (Fortune 500 HQ in PA)
| Industry | F500 HQs | Revenue |
|---|---|---|
| Healthcare | 2 | $309B |
|
||
| Insurance | 2 | $27B |
|
||
| Telecommunications / Media | 1 | $124B |
|
||
| Industrial Distribution | 1 | $22B |
|
||
| Financial Services | 1 | $20B |
|
||
| Chemicals / Materials | 1 | $18B |
|
||
Price history
+3223.7% since first listed3 events — show timeline
- 2026-06-13 Listed $1,150,000 BRIGHT MLS
- 2006-06-06 Sold (Public Records) $690,000 Public Records
- 1985-03-19 Sold (Public Records) $34,600 Public Records
Property tax history
+3.0%/yrLatest (2026): $16,619 · +4.6% YoY. Source: county tax records.
Cash-flow waterfall
monthlySold comps — $/sqft
last 12 mo · ≤1 miLoading sold comps…