 Fourplex
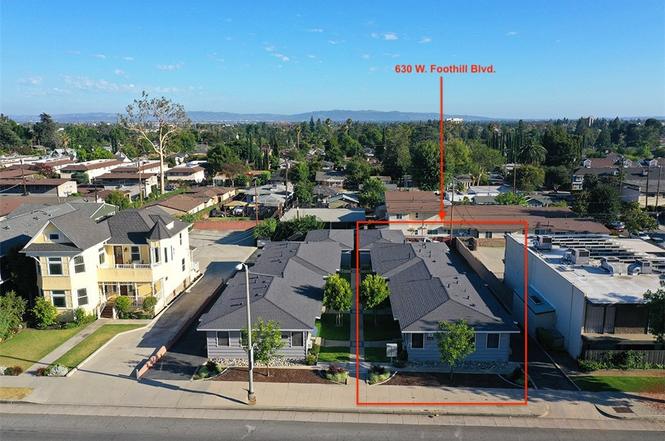
630 W Foothill · Monrovia, CA
Flood risk 1/10 · Minimal
- FEMA flood zone
- X (unshaded)
- Chance of flooding over 30 yrs
- 0.0%
- Est. flood insurance / yr
- $507 – $1,088
Fire risk 6/10 · Moderate
- Est. fire insurance / yr
- $659 – $1,223
Heat risk 7/10 · Major
- Hot days now (above 98°F)
- 7 days/yr
- Hot days in 30 yrs
- 20 days/yr
Wind risk 1/10 · Minimal
- Chance of severe wind over 30 yrs
- —
Air-quality risk 9/10 · Severe
- Unhealthy air days now
- 21 days/yr
- Unhealthy air days in 30 yrs
- 23 days/yr
Risk factors via First Street. Map © Google.
Why this score? — see what drove the D- grade
The composite is a weighted blend of 9 inputs, each scored 0–100. Each bar is that input's sub-score; the figure is the points it added to the 100-point composite (weight × sub-score).
- ARV discount +9.9/15.0
- Cash flow +8.7/30.0
- Schools +3.9/10.0
- Rent growth +3.3/5.0
- Livability +2.6/5.0
- Condition / age +2.5/5.0
- DSCR +2.4/10.0
- 1% rule +2.2/10.0
- Appreciation +0.0/10.0
$1,250,000
🖨 Deal sheet 📄 Offer letter ✓ Due diligence
Multi-family units
County records classify this as Multi-Family (2-4 Unit). Listing-text estimate: 4 units. confirmed
Listing remarks MLS
I am pleased to exclusively offer for sale this 8 Unit multi-family investment property in the city of Monrovia. It consists of two 4 unit apartment buildings with two separate APN (8505-012-034 & 035) numbers. However, they must be sold together as one property. The both buildings rest on a large approx. 15,000 sq. ft. lot. Each unit is separately metered for electric and gas services and tenants pay their own utilities. Each building has four 1bed/1bath units with a private one car garage for each unit. The property shows pride of the ownership and has been owned by the same family for about 40 years! The Property is conveniently located close to grocery stores, restaurants, schools, Old Town Monrovia, Metro and a short drive to the 210 and 605 freeways. These 2 fourplexes are primed for any savvy investor for upside potential. Please check with the city regarding requirements. Buyers to do their due diligence.
Key facts
- Newer appliances
- Custom tiled showers
- New light fixtures
Tags
Property features AI
Finance
- Other: Total expenses listed: $15,171; Insurance expense approximately $2,183; Water/sewer expense approximately $3,200; Electric expense approximately $999; Trash expense approximately $4,117; Gardener expense approximately $1,362
- Financial info: Gross scheduled income approximately $91,824; Gross income approximately $91,824; Total actual rent reported $7,475 (current rents); Laundry income approximately $2,124; Net operating income approximately $76,653; Operating expenses approximately $15,171 (includes insurance, water/sewer, electric, trash, gardener)
Exterior
- Parking: Total of 8 parking spaces; Four garage spaces (one garage space allocated per unit); Four additional uncovered parking spaces
- Utilities: Public sewer; District/public water
- Home design: Single-story multifamily building; Four total units in one building; No accessory dwelling unit (ADU)
- Construction: Year built reported from assessor; Total building area approximately 2,200
- Exterior features: No pool; Lot size reported between 6,500 and 9,999 sq ft
Interior
- Kitchen: Each unit includes range/oven (4 units reported with range)
- Bedrooms: Four 1-bedroom units (each unit listed as 1 bed)
- Bathrooms: Four full bathrooms (one per unit)
- Heating & cooling: Wall/window air conditioning units
- Interior features: One-level entry; One story; No shared/common walls; Sidewalks in the community
- Laundry & utility: On-site community laundry; One separate water meter for the property; Four separate gas meters; Four separate electric meters
Neighborhood map
What this means for you Summary
Snapshot
- This is a 4 × 1-bed/1.0-bath units multifamily listed at $1.25M.
Deal economics
- At list price, monthly cash flow is $-1k ($-13k/yr) — negative. Per door: $-263/mo.
- To cash-flow at today's rent, offer at most $1.06M (14.8% below list).
- To meet the 1% rule (rent ≥ 1% of price), the offer needs to be $896k (28.3% below list).
- Recommended offer: $896k (28.3% below list) — sets the bar for 1% rule.
- Cap rate 5.3% vs local median 2.1% in Monrovia — top-decile yield for the area; either an underpriced asset or a hidden risk that comps aren't pricing in. Stress-test before assuming the spread holds.
Location & tenants
- Location reads 52/100 on livability (#993 in CA) — a working-class tenant base; expect higher turnover. Strengths: employment A+, health & safety A-; Watch: schools C-, crime C-, amenities F.
- Monrovia Unified (suburban): math 39% / reading 48% proficiency, ranked #182 of 517 in CA (top 35%) — families likely to look elsewhere, expect single-tenant / working-renter base with shorter leases.
- Market conditions: Rents rising (+3.4%/yr); 71 active listings in the ZIP; 22 comparable units currently listed for rent nearby; rentals at typical pace (median 19d on market — plan ~3-4 weeks tenant-placement turnaround); solid renter incomes; 19,697 units permitted in Los Angeles County in 2024 (9,426 in 5+ unit buildings).
- At $8,957/mo this rent would consume 111% of the median local household income ($97k/yr) (locally 2134% of renters already pay >50% of income on rent) — very limited rent-growth headroom before tenants either downsize or default.
Forward outlook
- Local home prices are declining (-3.0%/yr); year-one equity from $9k of loan paydown is wiped out by about $38k of value loss. Plan a longer hold.
- Los Angeles County population projected at +9% by 2050 — modest demand growth; plan on rents tracking national, not racing it.
Negotiation context
- Only 1 days on market — expect competitive offers; lowballing is unlikely to land.
- 4 sale attempts since 6y ago with the ask held roughly flat each time — persistent listings suggest the price (not the market) is what's stuck; bring a comps-based counter.
- Current owner paid $800k; list at $1.25M implies a 56% gain — meaningful room to come down on a strong offer.
Risks & watch-outs
- Watch-outs: built in 1951 — expect roof / HVAC / electrical / plumbing capex.
- Climate carrying-cost: major wildfire risk; extreme-heat days projected 7→20/yr by 2055 (HVAC capex compounding) — expect insurance premiums to compound above CPI over the hold.
Questions for the listing agent
- What do current leases actually rent for vs. the listed asking? Can we see a recent rent roll and the last 12 months of T-12 income?
- Can we see the unit-by-unit rent roll, current vacancy, and any below-market leases? What's the average tenancy length?
- What capital expenditures (roof, boiler, parking lot, exteriors) have been made in the last 5 years, and what's planned in the next 2?
- Built in 1951 — when were the roof, HVAC, electrical panel, plumbing, and water heater last replaced?
- Is there a deadline driving the sale (1031 exchange, divorce, estate, relocation)? That informs how much negotiation room exists.
- The area grade is low — what's the realistic commute time and amenity access for the typical tenant pool here? Any planned neighborhood developments (good or bad) we should know about?
- What's the average days-on-market for RENTAL listings here right now (not sales)? A rising rental-DOM trend means longer vacancies and softer asking-rent achievability than the comps imply.
- What's the recent tenant-quality profile in this submarket — average credit score on applications, eviction rate, late-payment / NSF rate, and stable-employment percentage? A property-management company in the area should have these aggregated.
- How much new apartment / multifamily construction is in the pipeline within 1–3 miles? Heavy new supply (>2% of stock underway) typically softens rents 12–24 months out; light construction supports rent growth.
Investment metrics
- 1% rule
- 0.72% ✗
- Cap rate
- 5.28%
- Cash-on-cash
- -3.60%
- DSCR
- 0.84
- GRM
- 11.6
CMA / ARV
- ARV (on-the-fly)
- $1,320,000
- Comps found
- 5
Show comp detail 5 sales within ~0.75 mi
| Address | Dist | Beds/Ba | Sqft | Sold | Price | $/sf | Match |
|---|---|---|---|---|---|---|---|
| 735 W Lemon Ave | 0.29mi | 5/3.0 (+1) | 2,181 (-1%) | 12mo | $1,492,000 | $684 | 66 |
| 309 S Alta Vista Ave | 0.31mi | 5/2.0 (+1) | 2,209 (+0%) | 13mo | $1,325,000 | $600 | 61 |
| 327 S Lincoln Pl | 0.47mi | 4/2.0 | 2,284 (+4%) | 4mo | $1,067,000 | $467 | 60 |
| 527 W Olive Ave | 0.42mi | 4/3.0 | 2,000 (-9%) | 10mo | $1,050,000 | $525 | 53 |
| 717 S Magnolia Ave | 0.62mi | 4/3.0 | 1,964 (-11%) | 5mo | $1,550,000 | $789 | 45 |
Match score weights: distance 35% · size 25% · config 20% · recency 20%. Top-matched comps best support the ARV.
Projected returns pro-forma
-3.0% appreciation · 3.36% rent growth · sell at horizon
- IRR
- -22.0%
- Equity multiple
- 0.24×
- Total profit
- $-266,353
- Equity at exit
- $186,379
- IRR
- -15.2%
- Equity multiple
- 0.13×
- Total profit
- $-305,320
- Equity at exit
- $108,077
Cash invested: $350,000 (down + closing). Projections, not guarantees.
Landlord ↔ Tenant lean methodology
- Overall (STATE)
- 18 Strongly Tenant-Friendly
- State California
- 18 Strongly Tenant-Friendly · D+13
- County
- — inherits STATE
- City
- — inherits STATE
ZIP-level market 91016
- Rents YoY
- 3.4%
- Active inventory
- 71
- Price-to-rent
- 46.5×
Monthly cashflow live
- Estimated rent
- $8,957 high interval (Pro) →
- Mortgage (P&I)
- −$6,555
- Tax from tax record
- −$1,050 /mo · $12,601/yr
- Insurance
- −$521
- HOA
- −$0
- Vacancy / Maint / Mgmt
- −$1,881
- Net cashflow
- $-1,050
Break-even live
4-unit breakdown (identical units grouped — click to expand)
| Units | Beds | Baths | Est. rent |
|---|---|---|---|
| 4× units | 1 | 1 | $8,956 |
| #1 | 1 | 1 | $2,239 |
| #2 | 1 | 1 | $2,239 |
| #3 | 1 | 1 | $2,239 |
| #4 | 1 | 1 | $2,239 |
| Total (4 units) | $8,957 | ||
UW: 25.0% down · 7.5% · 30yr · 1.5% tax · 5.0% vac · 8.0% maint · 8.0% mgmt
Financing live
Cash to close
- Down payment
- $312,500
- Closing costs
- $37,500
- Reserves months
- —
- Total cash needed
- —
Loan-product check · same deal, 3 products live
Conventional
25% down · 7.5% · 30yr
- Down + closing
- —
- Monthly P&I
- —
- Monthly cashflow
- —
- DSCR
- —
- Eligible?
- —
Personal DTI + credit; lowest rate.
DSCR
20% down · 8.5% · 30yr
- Down + closing
- —
- Monthly P&I
- —
- Monthly cashflow
- —
- DSCR
- —
- Eligible?
- —
No personal income docs; deal must DSCR.
Hard money
10% down · 12.0% · 12mo
- Down + closing
- —
- Monthly P&I
- —
- Monthly cashflow
- —
- DSCR
- —
- Eligible?
- —
Short-term bridge; refi at stabilization.
Rent comps 22 comps
| Address | Beds | Baths | Sqft | Rent | $/sqft | DOM | Units | Dist |
|---|---|---|---|---|---|---|---|---|
| 211 Linwood Ave Unit A Monrovia, CA | 3.0 | 3.0 | 1562 | $3,850 | $2.46 | 43d | 1 | 0.54mi |
| 825 S Myrtle Ave Monrovia, CA | 1.0–3.0 | 1.0–2.0 | 1258 | $4,790 | $3.81 | 1d | 1 | 0.87mi |
| 232 May Ave Monrovia, CA | 3.0 | 2.0 | 1484 | $3,800 | $2.56 | 22d | 1 | 0.94mi |
| 61 E Orange Grove Ave Arcadia, CA | 3.0 | 2.5 | 2411 | $6,250 | $2.59 | 1d | 1 | 1.01mi |
| 1351 S Magnolia Ave Monrovia, CA | 4.0 | 2.5 | 1658 | $4,300 | $2.59 | 43d | 1 | 1.05mi |
| 422 California St Unit F Arcadia, CA | 3.0 | 2.5 | 2002 | $4,000 | $2.00 | 1d | 1 | 1.09mi |
| 203 S 3rd Ave Unit B Arcadia, CA | 3.0 | 2.5 | 2350 | $4,200 | $1.79 | 18d | 1 | 1.10mi |
| 1516 Encino Ave Unit B Monrovia, CA | 3.0 | 2.5 | 1662 | $3,775 | $2.27 | 24d | 1 | 1.11mi |
| 18 Woodland Ln Arcadia, CA | 3.0 | 2.0 | 2418 | $6,600 | $2.73 | 1d | 1 | 1.13mi |
| 505 N Santa Anita Ave Unit A Arcadia, CA | 3.0 | 3.0 | 1890 | $4,850 | $2.57 | 24d | 1 | 1.16mi |
| 503 N Santa Anita Ave Arcadia, CA | 3.0 | 3.0 | 1960 | $4,500 | $2.30 | 24d | 1 | 1.16mi |
| 511 N Santa Anita Ave Arcadia, CA | 3.0 | 3.0 | 1690 | $4,400 | $2.60 | 10d | 1 | 1.22mi |
| 162 California St Arcadia, CA | 3.0 | 2.5 | 1589 | $3,700 | $2.33 | 19d | 1 | 1.23mi |
| 1625 S Magnolia Ave Monrovia, CA | 1.0–3.0 | 1.0–2.0 | 1094 | $5,480 | $5.01 | 1d | 48 | 1.23mi |
| 110 Santa Ynez Dr Arcadia, CA | 4.0 | 2.0 | 1855 | $5,900 | $3.18 | 43d | 1 | 1.31mi |
| 809 W Duarte Rd Unit C Monrovia, CA | 4.0 | 2.5 | 1871 | $3,900 | $2.08 | 2d | 1 | 1.31mi |
| 1747 Oakwood Ave Arcadia, CA | 4.0 | 4.0 | 2745 | $6,950 | $2.53 | 16d | 1 | 1.35mi |
| 612 S 2nd Ave Arcadia, CA | 4.0 | 4.0 | 2012 | $4,500 | $2.24 | 43d | 1 | 1.41mi |
| 605 S 2nd Ave Arcadia, CA | 3.0 | 2.5 | 1400 | $3,200 | $2.29 | 24d | 1 | 1.42mi |
| 755 Valley View Ave Unit B Monrovia, CA | 4.0 | 2.5 | 2099 | $4,000 | $1.91 | 43d | 1 | 1.43mi |
| 407 E Duarte Rd Unit C Arcadia, CA | 4.0 | 3.0 | 1968 | $4,600 | $2.34 | 1d | 1 | 1.44mi |
| 137 Genoa St Unit A Arcadia, CA | 3.0 | 2.5 | 2292 | $4,950 | $2.16 | 15d | 1 | 1.49mi |
Listing history 2 events
-
2026-06-18remarks 699-char remark
-
2026-06-18$1,250,000 Active 1 DOM
ⓘ Source: listings_history table (triggers on properties + properties_extension) + one-shot
backfill from property_details.listing_events for pre-trigger history.
Tax reassessment forecast CA · Resets to sale price
- Current annual tax
- $12,601 · $1,050/mo
- Projected year-2 tax
- $12,601 · $1,050/mo
- Expected delta
- $0/yr ($0/mo · 0.0%)
ⓘ Screening estimate from a state-policy table — verify with the county assessor before closing.
Climate risk First Street
- Flood 1/10 Low FEMA zone X (unshaded) · 0% chance over 30 yrs
- Wildfire 6/10 Major
- Heat 7/10 Severe 7 d/yr ≥98°F today · 20 d/yr by 30 yrs out
- Wind 1/10 Low
- Air quality 9/10 Extreme 21 unhealthy d/yr today · 23 by 30 yrs out
Nearby sold comps map
Loading sold comps map…
Walkable amenities ~0.75 mi
Loading nearby amenities…
Taxation est. · year 1
- Rental income
- $107,484
- − Mortgage interest
- −$70,019
- − Property taxes
- −$12,601
- − Insurance
- −$6,250
- − Repairs & maintenance
- −$8,599
- − Management
- −$8,599
- − Depreciation
- −$36,364
- Taxable loss
- −$34,947
- Est. tax savings @ 24.0%
- +$8,387
- After-tax cash flow
- $-4,213/yr
For passive investors: Depreciation is non-cash, so a rental often shows a tax loss while cash-flowing — sheltering income. Rental losses are passive: they offset passive income freely, and up to $25,000/yr can offset ordinary (W-2) income if you actively participate and your MAGI is under $100k (phasing out to $0 by $150k); unused losses carry forward. On sale, claimed depreciation is recaptured at up to 25%, and gains may owe capital-gains tax (a 1031 exchange can defer both). Figures are a year-1 estimate at your 24.0% rate — not tax advice; consult a CPA.
Schools (NCES district)
- District
- Monrovia Unified
- NCES district ID
- 0625320
- Math proficiency
- 39% ▼ -4.00%
- Reading proficiency
- 48% ▼ -10.00%
- Median HH income
- $69,032
- Composite
- 39.18/100
- National rank
- #4022
- State rank
- #182 of 517 in CA
Livability — Monrovia
- Score
- 52/100
- State rank
- #993
- US rank
- #24760
Category grades
Schools grade is shown separately in the Schools card above.
Census & demographics
- Census place
- Monrovia, CA
- County
- Los Angeles County · 9,444,647 people
- City population
- 41,140
- Metro
- Los Angeles-Long Beach-Anaheim, CA
- Population (ZIP)
- 41,140
- Household income
- $96,540
- Rent vs Own
- Severe rent burden
- 2134.0
Population outlook (Los Angeles County) Hauer SSP2
- Today (2025)
- 10,940,515 people
- By 2030
- 11,256,481 · +2.9%
- By 2040
- 11,729,929 · +7.2%
- By 2050
- 11,948,407 · +9.2%
- By 2075
- 11,818,114 · +8.0%
- By 2100
- 10,842,928 · -0.9%
Race, ethnicity, and origin ACS 2023
- Neighborhood character
- Diverse neighborhood (Simpson 0.70)
- Race & ethnicity
- Hispanic / Latino 43% White 30% Two or more races 21% Asian 16% Black 6%
- Hispanic origin (detail)
- Mexican 33% Puerto Rican 1%
- Common ancestry
- Italian 1% Slovak 1% Lithuanian 1%
- Foreign-born
- 24% · Canada, China, Vietnam
- Languages at home
- 58% English-only · Spanish 27% Chinese 7% Tagalog/Filipino 2%
Political lean MEDSL · Los Angeles
- 2024 margin
- Solid D (+32.9) · D 64.8% · R 31.9% · Other 3.3%
- 2008→2024 swing
- -7.4pp toward R · 2008: 40.4pp · 2024: 32.9pp
- All cycles
- 2024: D+32.9 2020: D+44.2 2016: D+48.0 2012: D+40.0 2008: D+40.4
Not yet ingested
- Civics
- —
Market trends
- HPI YoY
- ▼ -1140.27%
- Current HPI
- 390.9169
- Rent YoY
- ▲ 3.36%
- Metro
- Los Angeles-Long Beach-Anaheim, CA
- State GDP YoY
- ▲ 3.21%
- F500 in state
- 116
Industry mix (Fortune 500 HQ in CA)
| Industry | F500 HQs | Revenue |
|---|---|---|
| Technology | 27 | $1,492B |
|
||
| Financial Services | 3 | $174B |
|
||
| Retail | 3 | $44B |
|
||
| Insurance | 3 | $26B |
|
||
| Media / Entertainment | 2 | $115B |
|
||
| Pharmaceuticals / Biotech | 2 | $62B |
|
||
Price history
+1011.1% since first listed10 events — show timeline
- 2026-06-17 Listed $1,250,000 CRMLS
- 2020-10-20 Sold (Public Records) $800,000 Public Records
- 2020-10-20 Sold (MLS) $800,000 CRMLS
- 2020-09-17 Contingent — CRMLS
- 2020-09-01 Relisted — CRMLS
- 2020-08-21 Contingent — CRMLS
- 2020-08-16 Relisted — CRMLS
- 2020-07-09 Contingent — CRMLS
- 2020-07-06 Listed $1,087,000 CRMLS
- 1979-09-27 Sold (Public Records) $112,500 Public Records
Property tax history
+8.1%/yrLatest (2025): $12,601 · +2.3% YoY. Source: county tax records.
Cash-flow waterfall
monthlySold comps — $/sqft
last 12 mo · ≤1 miLoading sold comps…