 Duplex
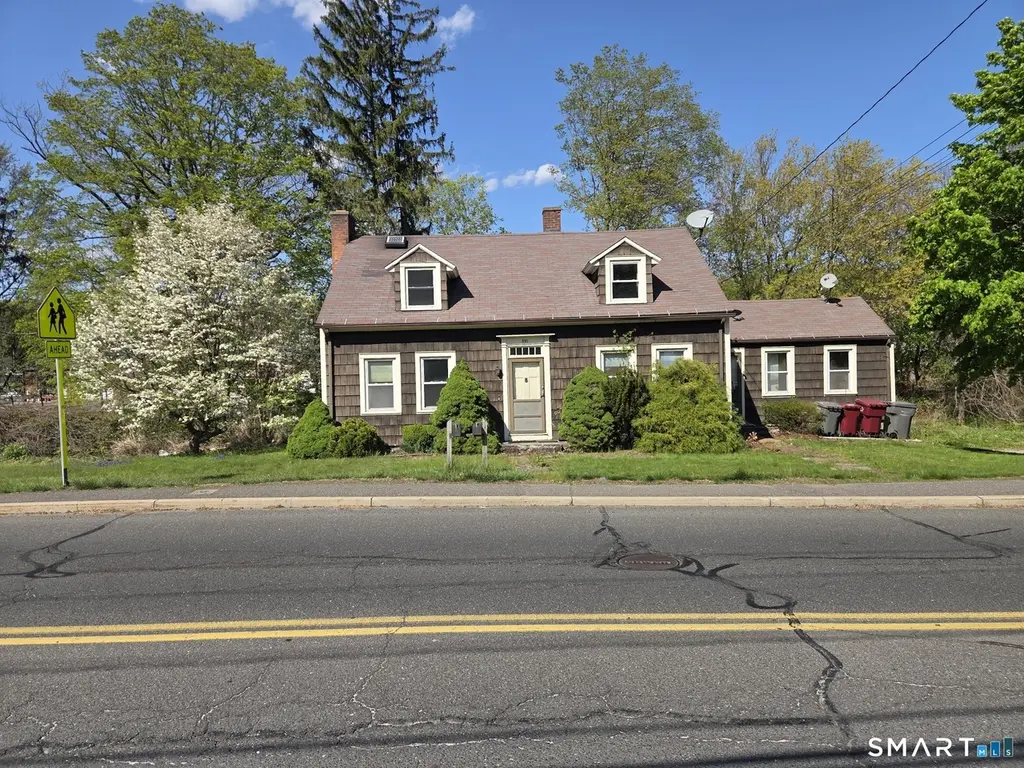
591 Rubber Ave · Naugatuck, CT
Flood risk 9/10 · Severe
- FEMA flood zone
- AE
- Chance of flooding over 30 yrs
- 0.99%
- Est. flood insurance / yr
- $2,026 – $9,024
Fire risk 2/10 · Minimal
- Est. fire insurance / yr
- $829 – $1,539
Heat risk 5/10 · Moderate
- Hot days now (above 97°F)
- 8 days/yr
- Hot days in 30 yrs
- 17 days/yr
Wind risk 6/10 · Moderate
- Chance of severe wind over 30 yrs
- 27.0%
Air-quality risk 3/10 · Minor
- Unhealthy air days now
- 2 days/yr
- Unhealthy air days in 30 yrs
- 4 days/yr
Risk factors via First Street. Map © Google.
Why this score? — see what drove the B grade
The composite is a weighted blend of 9 inputs, each scored 0–100. Each bar is that input's sub-score; the figure is the points it added to the 100-point composite (weight × sub-score).
- Cash flow +30.0/30.0
- DSCR +10.0/10.0
- 1% rule +9.0/10.0
- ARV discount +7.5/15.0
- Rent growth +4.1/5.0
- Livability +3.9/5.0
- Schools +3.3/10.0
- Condition / age +2.5/5.0
- Appreciation +0.0/10.0
$249,900
🖨 Deal sheet 📄 Offer letter ✓ Due diligence
Multi-family units
County records classify this as Multi-Family (2-4 Unit). Listing-text estimate: 2 units. confirmed
Listing remarks
New to market 2 family with commercial possibilities. First floor with 2 brs set up as 1 br & dining room, eat-in kitchen. Living room with fireplace. Wide plank hardwood flooring, bathroom with laundry hookup. Second floor with 2 brs, eat-in kitchen, 1 bathroom. Set on level lot with 2 car garage. "As is" . Cash or rehab loan only. Also listed as commercial MLS #24174514
Key facts
- Level lot
- Eat-in kitchen
- 0.45 acre lot
Tags
Property features AI
Exterior
- Parking: Under-house garage; Two-car garage
- Utilities: Public water connected; Public sewer connected
- Home design: Multi-family 2-family property; Two total residential units
- Construction: Frame construction; Stone foundation; Asphalt shingle roof; Shingle and wood siding; Built with brown exterior finish
- Exterior features: Level lot; Brown exterior
Interior
- Bedrooms: Four bedrooms
- Bathrooms: Two full bathrooms
- Heating & cooling: Hot water heating (oil-fired); Fuel tank located in basement; Hot water heating equipment described as 'Other'
- Interior features: Full, unfinished basement; One fireplace; Eight total rooms
Neighborhood map
What this means for you Summary
Snapshot
- This is a 2 × 2-bed/1.0-bath units multifamily listed at $250k.
Deal economics
- At list price, monthly cash flow is $547 ($7k/yr) — positive. Per door: $274/mo.
- The deal already cash-flows at list — no discount required.
- Meets the 1% rule at list price ($3k rent vs $250k).
- Cap rate 11.1% vs local median 3.4% in Naugatuck — top-decile yield for the area; either an underpriced asset or a hidden risk that comps aren't pricing in. Stress-test before assuming the spread holds.
Location & tenants
- Location reads 77/100 on livability (#42 in CT, #2,997 nationally) — a middle-class / working-renter tenant base. Strengths: crime A+, housing A+, health & safety A+; Watch: amenities F, commute D-.
- Naugatuck School District (suburban): math 32% / reading 43% proficiency, ranked #105 of 153 in CT (top 69%) — families likely to look elsewhere, expect single-tenant / working-renter base with shorter leases.
- Zoned schools: Naugatuck High School (math 20% / reading 44%, grade F, #129 of 194 statewide, top 69%, 1,288 students, 52% FRL) — zoned schools average 52% FRL vs 35% district-wide (18 pts higher); higher-poverty schools than district average — tighter screening recommended.
- Market conditions: Rents rising fast (+6.2%/yr); 112 active listings in the ZIP; 10 comparable units currently listed for rent nearby; rentals at typical pace (median 23d on market — plan ~3-4 weeks tenant-placement turnaround); 40% of comp listings sitting > 30 days — soft ceiling on asking rent; solid renter incomes; 502 units permitted in Naugatuck Valley Planning Region in 2024 (171 in 5+ unit buildings).
- This rent runs 44% of the median local income ($96k/yr) — at the standard rent-burdened threshold; future hikes will face affordability resistance.
Forward outlook
- Local home prices are declining (-3.0%/yr); year-one equity from $2k of loan paydown is wiped out by about $7k of value loss. Plan a longer hold.
- At projected returns (-3.0% appreciation + 6.2% rent growth), your $70k cash investment doubles in ~8 years — after that, you're playing with house money.
Negotiation context
- Only 5 days on market — expect competitive offers; lowballing is unlikely to land.
Risks & watch-outs
- Watch-outs: flood insurance adds $460/mo; built in 1810 — expect roof / HVAC / electrical / plumbing capex.
- Climate carrying-cost: in FEMA flood zone AE (mandatory federal flood insurance); major wind risk, 27% chance of damaging wind over 30y; extreme-heat days projected 8→17/yr by 2055 (HVAC capex compounding) — expect insurance premiums to compound above CPI over the hold.
Questions for the listing agent
- Can we see the unit-by-unit rent roll, current vacancy, and any below-market leases? What's the average tenancy length?
- What capital expenditures (roof, boiler, parking lot, exteriors) have been made in the last 5 years, and what's planned in the next 2?
- Built in 1810 — when were the roof, HVAC, electrical panel, plumbing, and water heater last replaced?
- What's the actual annual flood-insurance premium (NFIP or private), and is the property in a SFHA with mandatory coverage?
- Is there a deadline driving the sale (1031 exchange, divorce, estate, relocation)? That informs how much negotiation room exists.
- What's the average days-on-market for RENTAL listings here right now (not sales)? A rising rental-DOM trend means longer vacancies and softer asking-rent achievability than the comps imply.
- What's the recent tenant-quality profile in this submarket — average credit score on applications, eviction rate, late-payment / NSF rate, and stable-employment percentage? A property-management company in the area should have these aggregated.
- How much new apartment / multifamily construction is in the pipeline within 1–3 miles? Heavy new supply (>2% of stock underway) typically softens rents 12–24 months out; light construction supports rent growth.
Investment metrics
- 1% rule
- 1.40% ✓
- Cap rate
- 11.13%
- Cash-on-cash
- 17.28%
- DSCR
- 1.77
- GRM
- 6.0
CMA / ARV
No comps found within radius.
Projected returns pro-forma
-3.0% appreciation · 6.23% rent growth · sell at horizon
- IRR
- 2.3%
- Equity multiple
- 1.09×
- Total profit
- $6,435
- Equity at exit
- $37,261
- IRR
- 15.4%
- Equity multiple
- 2.48×
- Total profit
- $103,356
- Equity at exit
- $21,607
Cash invested: $69,972 (down + closing). Projections, not guarantees.
Landlord ↔ Tenant lean methodology
- Overall (STATE)
- 27 Tenant-Leaning
- State Connecticut
- 27 Tenant-Leaning · D+7
- County
- — inherits STATE
- City
- — inherits STATE
ZIP-level market 06770
- Home prices YoY
- -33.3%
- Rents YoY
- 6.2%
- Active inventory
- 112
- Price-to-rent
- 11.9×
Monthly cashflow live
- Estimated rent
- $3,497 high interval (Pro) →
- Mortgage (P&I)
- −$1,311
- Tax from tax record
- −$340 /mo · $4,086/yr
- Insurance
- −$104
- Flood insurance flood zone
- −$460 /mo · $5,525/yr
- HOA
- −$0
- Vacancy / Maint / Mgmt
- −$734
- Net cashflow
- $547
Break-even live
2-unit breakdown (identical units grouped — click to expand)
| Units | Beds | Baths | Est. rent |
|---|---|---|---|
| 2× units | 2 | 1 | $3,496 |
| #1 | 2 | 1 | $1,748 |
| #2 | 2 | 1 | $1,748 |
| Total (2 units) | $3,497 | ||
UW: 25.0% down · 7.5% · 30yr · 1.5% tax · 5.0% vac · 8.0% maint · 8.0% mgmt
Financing live
Cash to close
- Down payment
- $62,475
- Closing costs
- $7,497
- Reserves months
- —
- Total cash needed
- —
Loan-product check · same deal, 3 products live
Conventional
25% down · 7.5% · 30yr
- Down + closing
- —
- Monthly P&I
- —
- Monthly cashflow
- —
- DSCR
- —
- Eligible?
- —
Personal DTI + credit; lowest rate.
DSCR
20% down · 8.5% · 30yr
- Down + closing
- —
- Monthly P&I
- —
- Monthly cashflow
- —
- DSCR
- —
- Eligible?
- —
No personal income docs; deal must DSCR.
Hard money
10% down · 12.0% · 12mo
- Down + closing
- —
- Monthly P&I
- —
- Monthly cashflow
- —
- DSCR
- —
- Eligible?
- —
Short-term bridge; refi at stabilization.
Rent comps 10 comps
| Address | Beds | Baths | Sqft | Rent | $/sqft | DOM | Units | Dist |
|---|---|---|---|---|---|---|---|---|
| 684 Field St Naugatuck, CT | 3.0 | 1.5 | 1718 | $2,200 | $1.28 | 23d | 1 | 0.42mi |
| 675 Millville Ave Naugatuck, CT | 2.0 | 1.5 | 1472 | $2,100 | $1.43 | 3d | 1 | 0.44mi |
| 303 Millville Ave Naugatuck, CT | 3.0 | 2.0 | 1518 | $2,500 | $1.65 | 11d | 1 | 0.60mi |
| 303 Millville Ave Naugatuck, CT | 3.0 | 1.5 | 1518 | $2,500 | $1.65 | 43d | 1 | 0.60mi |
| 8 Garden St Naugatuck, CT | 3.0 | 1.0 | 1401 | $2,000 | $1.43 | 43d | 1 | 0.71mi |
| 33 Pond St Naugatuck, CT | 2.0 | 1.0 | 1058 | $1,700 | $1.61 | 43d | 1 | 0.85mi |
| 304 Hillside Ave Naugatuck, CT | 2.0 | 1.0 | 1088 | $1,650 | $1.52 | 21d | 1 | 1.02mi |
| 223 Meadow St Naugatuck, CT | 2.0–3.0 | 1.0–1.5 | 1500 | $1,995 | $1.33 | 2d | 3 | 1.02mi |
| 46 Carroll St Unit left side Naugatuck, CT | 2.0 | 2.0 | 1632 | $1,575 | $0.97 | 23d | 1 | 1.33mi |
| 550 High St Unit 2 Naugatuck, CT | 2.0 | 1.5 | 1100 | $2,500 | $2.27 | 43d | 1 | 1.40mi |
Listing history 2 events
-
2026-05-13status Under Contract
-
2026-05-08$249,900 Active
ⓘ Source: listings_history table (triggers on properties + properties_extension) + one-shot
backfill from property_details.listing_events for pre-trigger history.
Tax reassessment forecast CT · Partial reset (capped growth)
- Current annual tax
- $4,086 · $340/mo
- Projected year-2 tax
- $4,717 · $393/mo
- Expected delta
- +$631/yr (+$53/mo · 15.4%)
ⓘ Screening estimate from a state-policy table — verify with the county assessor before closing.
Climate risk First Street
- Flood 9/10 Extreme FEMA zone AE · 99% chance over 30 yrs
- Wildfire 2/10 Low
- Heat 5/10 Major 8 d/yr ≥97°F today · 17 d/yr by 30 yrs out
- Wind 6/10 Major 27% chance of damaging wind over 30 yrs
- Air quality 3/10 Moderate 2 unhealthy d/yr today · 4 by 30 yrs out
Nearby sold comps map
Loading sold comps map…
Walkable amenities ~0.75 mi
Loading nearby amenities…
Taxation est. · year 1
- Rental income
- $41,964
- − Mortgage interest
- −$13,998
- − Property taxes
- −$4,086
- − Insurance
- −$6,775
- − Repairs & maintenance
- −$3,357
- − Management
- −$3,357
- − Depreciation
- −$7,270
- Taxable income
- $3,121
- Est. tax owed @ 24.0%
- −$749
- After-tax cash flow
- $5,816/yr
For passive investors: Depreciation is non-cash, so a rental often shows a tax loss while cash-flowing — sheltering income. Rental losses are passive: they offset passive income freely, and up to $25,000/yr can offset ordinary (W-2) income if you actively participate and your MAGI is under $100k (phasing out to $0 by $150k); unused losses carry forward. On sale, claimed depreciation is recaptured at up to 25%, and gains may owe capital-gains tax (a 1031 exchange can defer both). Figures are a year-1 estimate at your 24.0% rate — not tax advice; consult a CPA.
Schools (NCES district)
- District
- Naugatuck School District
- NCES district ID
- 0902640
- Math proficiency
- 32% ▼ -13.00%
- Reading proficiency
- 43% ▼ -11.00%
- Median HH income
- $61,060
- Composite
- 33.44/100
- National rank
- #5463
- State rank
- #105 of 153 in CT
Livability — Naugatuck
- Score
- 77/100
- State rank
- #42
- US rank
- #2997
Category grades
Schools grade is shown separately in the Schools card above.
Census & demographics
- Census place
- Naugatuck, CT
- County
- New Haven County · 688,236 people
- City population
- 31,823
- Metro
- New Haven-Milford, CT
- Population (ZIP)
- 31,823
- Household income
- $96,208
- Rent vs Own
- Severe rent burden
- 788.0
Population outlook (Naugatuck Valley County) Hauer SSP2
- By 2040
- 496,846
Race, ethnicity, and origin ACS 2023
- Neighborhood character
- Diverse neighborhood (Simpson 0.59)
- Race & ethnicity
- White 61% Hispanic / Latino 17% Two or more races 12% Black 11% Asian 4%
- Hispanic origin (detail)
- Puerto Rican 10% Dominican 1%
- Common ancestry
- Romanian 7% Russian 6% Lithuanian 4%
- Foreign-born
- 17% · Canada, Jamaica, China
- Languages at home
- 77% English-only · Spanish 10% Other Indo-European 7% Other Asian/Pacific 2%
Political lean MEDSL · Naugatuck Valley
- 2024 margin
- Lean R (+7.4) · D 45.6% · R 53.0% · Other 1.4%
- All cycles
- 2024: R+7.4
Not yet ingested
- Civics
- —
Market trends
- HPI YoY
- ▼ -108.73%
- Current HPI
- 217.6177
- Rent YoY
- ▲ 6.23%
- Metro
- New Haven-Milford, CT
- State GDP YoY
- ▲ 1.06%
- F500 in state
- 38
Industry mix (Fortune 500 HQ in CT)
| Industry | F500 HQs | Revenue |
|---|---|---|
| Industrial Machinery | 4 | $38B |
|
||
| Insurance | 3 | $71B |
|
||
| Financial Services | 2 | $25B |
|
||
| Transportation / Logistics | 2 | $18B |
|
||
| Healthcare | 1 | $247B |
|
||
| Telecommunications | 1 | $55B |
|
||
Price history
2 events — show timeline
- 2026-05-13 Pending — Smart MLS
- 2026-05-08 Listed $249,900 Smart MLS
Property tax history
+2.6%/yrLatest (2022): $4,086 · +0.0% YoY. Source: county tax records.
Cash-flow waterfall
monthlySold comps — $/sqft
last 12 mo · ≤1 miLoading sold comps…