 Triplex
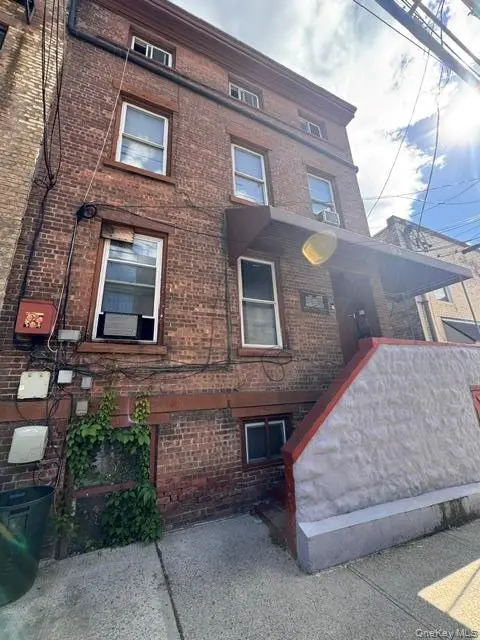
93 Ann St · Newburgh, NY
Flood risk 1/10 · Minimal
- FEMA flood zone
- X (unshaded)
- Chance of flooding over 30 yrs
- 0.0%
- Est. flood insurance / yr
- $473 – $860
Fire risk 1/10 · Minimal
- Est. fire insurance / yr
- $691 – $1,283
Heat risk 5/10 · Moderate
- Hot days now (above 100°F)
- 7 days/yr
- Hot days in 30 yrs
- 16 days/yr
Wind risk 4/10 · Minor
- Chance of severe wind over 30 yrs
- 12.0%
Air-quality risk 3/10 · Minor
- Unhealthy air days now
- 2 days/yr
- Unhealthy air days in 30 yrs
- 3 days/yr
Risk factors via First Street. Map © Google.
Why this score? — see what drove the C grade
The composite is a weighted blend of 9 inputs, each scored 0–100. Each bar is that input's sub-score; the figure is the points it added to the 100-point composite (weight × sub-score).
- Cash flow +24.7/30.0
- DSCR +8.0/10.0
- ARV discount +7.5/15.0
- 1% rule +6.7/10.0
- Schools +3.5/10.0
- Livability +3.1/5.0
- Rent growth +2.7/5.0
- Condition / age +2.5/5.0
- Appreciation +0.0/10.0
$469,000
🖨 Deal sheet 📄 Offer letter ✓ Due diligence
Multi-family units
County records classify this as Multi-Family (2-4 Unit). Listing-text estimate: 3 units. confirmed
Listing remarks
Come check out this brick 3-family home. It consists of 2 two-bedroom apartments and a two-story three-bedroom apartment. Heating and electricity are tenant-paid, and tenants are on leases. Since this property is located in Downtown Newburgh, there are many amenities around the block, including charming shops, restaurants, and cafes on the Liberty St corridor, featuring local eateries such as; Ms. Fairfax, Bivona’s Simply Pasta, The Wherehouse, & Cafe Little Treasure. You'll also find a vibrant nightlife scene with bars like Midnight Ferry, Newburgh Brewing Company, & 190 Bar. Within the downtown area, you can also find Downing Park, built by Central Park architect Calvert V
Key facts
- Downtown newburgh
- Newburgh waterfront
- Great library
Tags
Property features AI
Exterior
- Parking: On-street parking
- Utilities: Electricity connected (Central Hudson); Natural gas connected; Public sewer; Public water connected; Public trash collection
- Home design: Townhouse structure; Triplex property
- Construction: Brick exterior
- Exterior features: Brick construction; Not waterfront
Interior
- Bedrooms: Two 2-bedroom units; One 3-bedroom unit
- Bathrooms: Four full bathrooms (total across units)
- Heating & cooling: Baseboard heating; Electric heating; Natural gas heating; No central air
- Interior features: Original details; Finished basement
Neighborhood map
What this means for you Summary
Snapshot
- This is a 2×2bd/1.3ba + 1×3bd/1.3ba units multifamily listed at $469k.
Deal economics
- At list price, monthly cash flow is $975 ($12k/yr) — positive. Per door: $325/mo.
- The deal already cash-flows at list — no discount required.
- Meets the 1% rule at list price ($5k rent vs $469k).
- Recommended offer: $462k (1.5% below list) — sets the bar for market timing.
- Cap rate 8.8% vs local median 4.4% in Newburgh — top-decile yield for the area; either an underpriced asset or a hidden risk that comps aren't pricing in. Stress-test before assuming the spread holds.
Location & tenants
- Location reads 62/100 on livability (#878 in NY) — a middle-class / working-renter tenant base. Strengths: health & safety A+, housing B+, cost of living B; Watch: employment D+, crime F, amenities F.
- Newburgh City School District (suburban): math 33% / reading 48% proficiency, ranked #500 of 590 in NY (top 85%) — families likely to look elsewhere, expect single-tenant / working-renter base with shorter leases; 61% free/reduced lunch — lower-income household profile, screen leases tightly.
- Zoned schools: Newburgh Free Academy (math 76% / reading 85%, grade A, #506 of 1,100 statewide, top 46%, 3,433 students, 56% FRL).
- Zoned-school proficiency averages 80% at this address vs 40% district-wide (+40 pts) — the actual schools serving this property are materially stronger than the Newburgh City School District average implies; a family-tenant draw the district grade alone would hide.
- Market conditions: Rents flat; 383 active listings in the ZIP; 3 comparable units currently listed for rent nearby; rentals lingering (median 44d on market — plan ~5-8 weeks vacancy on turnover, expect pricing pressure); 67% of comp listings sitting > 30 days — soft ceiling on asking rent; solid renter incomes; 1,746 units permitted in Orange County in 2024 (1,265 in 5+ unit buildings).
- At $5,496/mo this rent would consume 77% of the median local household income ($86k/yr) (locally 2412% of renters already pay >50% of income on rent) — very limited rent-growth headroom before tenants either downsize or default.
Forward outlook
- Local home prices are declining (-3.0%/yr); year-one equity from $3k of loan paydown is wiped out by about $14k of value loss. Plan a longer hold.
Negotiation context
- It's been on market 21 days — a 2% lower offer ($462k) is reasonable based on typical stale-listing flexibility.
- 4 sale attempts since 2y ago with the ask held roughly flat each time — persistent listings suggest the price (not the market) is what's stuck; bring a comps-based counter.
- Current owner paid $54k; list at $469k implies a 769% gain — meaningful room to come down on a strong offer.
Risks & watch-outs
- Watch-outs: built in 1890 — expect roof / HVAC / electrical / plumbing capex.
- Climate carrying-cost: extreme-heat days projected 7→16/yr by 2055 (HVAC capex compounding) — expect insurance premiums to compound above CPI over the hold.
Questions for the listing agent
- Can we see the unit-by-unit rent roll, current vacancy, and any below-market leases? What's the average tenancy length?
- What capital expenditures (roof, boiler, parking lot, exteriors) have been made in the last 5 years, and what's planned in the next 2?
- Built in 1890 — when were the roof, HVAC, electrical panel, plumbing, and water heater last replaced?
- Is there a deadline driving the sale (1031 exchange, divorce, estate, relocation)? That informs how much negotiation room exists.
- Schools are D-rated, which usually means shorter tenancies and higher turnover. Who's the typical renter profile here, and what's been the actual vacancy rate?
- Crime grade is F in this area — have there been break-ins, vandalism, or insurance claims at this property in the last 3 years? What carrier currently insures it and at what premium?
- What's the average days-on-market for RENTAL listings here right now (not sales)? A rising rental-DOM trend means longer vacancies and softer asking-rent achievability than the comps imply.
- What's the recent tenant-quality profile in this submarket — average credit score on applications, eviction rate, late-payment / NSF rate, and stable-employment percentage? A property-management company in the area should have these aggregated.
- How much new apartment / multifamily construction is in the pipeline within 1–3 miles? Heavy new supply (>2% of stock underway) typically softens rents 12–24 months out; light construction supports rent growth.
Investment metrics
- 1% rule
- 1.17% ✓
- Cap rate
- 8.79%
- Cash-on-cash
- 8.91%
- DSCR
- 1.40
- GRM
- 7.1
CMA / ARV
- ARV (on-the-fly)
- $290,400
- Comps found
- 12
Show comp detail 12 sales within ~0.75 mi
| Address | Dist | Beds/Ba | Sqft | Sold | Price | $/sf | Match |
|---|---|---|---|---|---|---|---|
| 50 Carson Ave | 0.36mi | 5/3.0 | 1,688 (+2%) | 10mo | $350,000 | $207 | 69 |
| 113 First St | 0.21mi | 4/2.0 (-1) | 1,800 (+9%) | 7mo | $295,000 | $164 | 58 |
| 22 City Ter | 0.29mi | 6/4.0 (+1) | 1,891 (+15%) | 3mo | $80,000 | $42 | 52 |
| 121 William St | 0.37mi | 4/2.0 (-1) | 1,840 (+12%) | 5mo | $449,900 | $245 | 48 |
| 34 Concord St | 0.45mi | 4/2.0 (-1) | 1,620 (-2%) | 20mo | $270,000 | $167 | 48 |
| 87 Benkard Ave | 0.34mi | 4/2.0 (-1) | 1,762 (+7%) | 18mo | $400,000 | $227 | 47 |
| 72 Hasbrouck St | 0.43mi | 5/3.0 | 1,800 (+9%) | 20mo | $270,000 | $150 | 46 |
| 61 Overlook Pl | 0.43mi | 4/— (-1) | 1,812 (+10%) | 22mo | $325,000 | $179 | 40 |
| 374 1st St | 0.72mi | 4/2.0 (-1) | 1,656 (+0%) | 19mo | $270,000 | $163 | 40 |
| 32 Concord St | 0.45mi | 4/2.0 (-1) | 1,530 (-7%) | 20mo | $290,000 | $190 | 39 |
| 61 Hasbrouck St | 0.42mi | 4/2.0 (-1) | 1,868 (+13%) | 20mo | $270,000 | $145 | 31 |
| 74 Robinson Ave | 0.58mi | 4/2.0 (-1) | 1,816 (+10%) | 23mo | $320,000 | $176 | 26 |
Match score weights: distance 35% · size 25% · config 20% · recency 20%. Top-matched comps best support the ARV.
Projected returns pro-forma
-3.0% appreciation · 0.63% rent growth · sell at horizon
- IRR
- -5.6%
- Equity multiple
- 0.80×
- Total profit
- $-26,528
- Equity at exit
- $69,929
- IRR
- 0.9%
- Equity multiple
- 1.06×
- Total profit
- $7,431
- Equity at exit
- $40,551
Cash invested: $131,320 (down + closing). Projections, not guarantees.
Landlord ↔ Tenant lean methodology
- Overall (STATE)
- 15 Strongly Tenant-Friendly
- State New York
- 15 Strongly Tenant-Friendly · D+10
- County
- — inherits STATE
- City
- — inherits STATE
ZIP-level market 12550
- Home prices YoY
- -33.3%
- Rents YoY
- 0.6%
- Active inventory
- 383
- Price-to-rent
- 22.4×
Monthly cashflow live
- Estimated rent
- $5,496 high interval (Pro) →
- Mortgage (P&I)
- −$2,459
- Tax from tax record
- −$712 /mo · $8,540/yr
- Insurance
- −$195
- HOA
- −$0
- Vacancy / Maint / Mgmt
- −$1,154
- Net cashflow
- $975
Break-even live
3-unit breakdown (identical units grouped — click to expand)
| Units | Beds | Baths | Est. rent |
|---|---|---|---|
| 2× units | 2 | 1.3 | $3,484 |
| #1 | 2 | 1.3 | $1,742 |
| #2 | 2 | 1.3 | $1,742 |
| 1× unit | 3 | 1.3 | $2,012 |
| Total (3 units) | $5,496 | ||
UW: 25.0% down · 7.5% · 30yr · 1.5% tax · 5.0% vac · 8.0% maint · 8.0% mgmt
Financing live
Cash to close
- Down payment
- $117,250
- Closing costs
- $14,070
- Reserves months
- —
- Total cash needed
- —
Loan-product check · same deal, 3 products live
Conventional
25% down · 7.5% · 30yr
- Down + closing
- —
- Monthly P&I
- —
- Monthly cashflow
- —
- DSCR
- —
- Eligible?
- —
Personal DTI + credit; lowest rate.
DSCR
20% down · 8.5% · 30yr
- Down + closing
- —
- Monthly P&I
- —
- Monthly cashflow
- —
- DSCR
- —
- Eligible?
- —
No personal income docs; deal must DSCR.
Hard money
10% down · 12.0% · 12mo
- Down + closing
- —
- Monthly P&I
- —
- Monthly cashflow
- —
- DSCR
- —
- Eligible?
- —
Short-term bridge; refi at stabilization.
Rent comps 3 comps
| Address | Beds | Baths | Sqft | Rent | $/sqft | DOM | Units | Dist |
|---|---|---|---|---|---|---|---|---|
| 4 Grand St Unit 3 Newburgh, NY | 4.0 | 2.0 | 1560 | $3,925 | $2.52 | 23d | 1 | 0.08mi |
| 160 N Miller St #1 Newburgh, NY | 4.0 | 1.0 | 1600 | $2,500 | $1.56 | 44d | 1 | 0.54mi |
| 87 Ellis Ave Newburgh, NY | 5.0 | 2.5 | 2172 | $2,500 | $1.15 | 44d | 1 | 1.33mi |
Listing history 25 events
-
2026-06-18days on market $469,000 Active 21 DOM
-
2026-06-17days on market $469,000 Active 20 DOM
-
2026-06-16days on market $469,000 Active 19 DOM
-
2026-06-15price $469,000 Active 18 DOM
-
2026-06-15days on market $479,000 Active 18 DOM
-
2026-06-14days on market $479,000 Active 16 DOM
-
2026-06-13days on market $479,000 Active 15 DOM
-
2026-06-10days on market $479,000 Active 13 DOM
-
2026-06-09days on market $479,000 Active 12 DOM
-
2026-06-08days on market $479,000 Active 11 DOM
-
2026-06-07days on market $479,000 Active 10 DOM
-
2026-06-03days on market $479,000 Active 6 DOM
-
2026-06-02days on market $479,000 Active 5 DOM
-
2026-06-01days on market $479,000 Active 4 DOM
-
2026-05-31days on market $479,000 Active 3 DOM
-
2026-05-30days on market $479,000 Active 2 DOM
-
2026-05-28$479,000 Active
-
2024-10-04historical $1,100
-
2024-09-20$1,100
-
2024-09-07historical $1,100
-
2024-08-29$1,100
-
2024-08-16historical $1,100
-
2024-08-08$1,100
-
2022-05-31price $1,050
-
1987-11-12soldstatus $54,000
ⓘ Source: listings_history table (triggers on properties + properties_extension) + one-shot
backfill from property_details.listing_events for pre-trigger history.
Tax reassessment forecast NY · Partial reset (capped growth)
- Current annual tax
- $8,540 · $712/mo
- Projected year-2 tax
- $8,540 · $712/mo
- Expected delta
- $0/yr ($0/mo · 0.0%)
ⓘ Screening estimate from a state-policy table — verify with the county assessor before closing.
Climate risk First Street
- Flood 1/10 Low FEMA zone X (unshaded) · 0% chance over 30 yrs
- Wildfire 1/10 Low
- Heat 5/10 Major 7 d/yr ≥100°F today · 16 d/yr by 30 yrs out
- Wind 4/10 Moderate 12% chance of damaging wind over 30 yrs
- Air quality 3/10 Moderate 2 unhealthy d/yr today · 3 by 30 yrs out
Nearby sold comps map
Loading sold comps map…
Walkable amenities ~0.75 mi
Loading nearby amenities…
Taxation est. · year 1
- Rental income
- $65,952
- − Mortgage interest
- −$26,271
- − Property taxes
- −$8,540
- − Insurance
- −$2,345
- − Repairs & maintenance
- −$5,276
- − Management
- −$5,276
- − Depreciation
- −$13,644
- Taxable income
- $4,599
- Est. tax owed @ 24.0%
- −$1,104
- After-tax cash flow
- $10,599/yr
For passive investors: Depreciation is non-cash, so a rental often shows a tax loss while cash-flowing — sheltering income. Rental losses are passive: they offset passive income freely, and up to $25,000/yr can offset ordinary (W-2) income if you actively participate and your MAGI is under $100k (phasing out to $0 by $150k); unused losses carry forward. On sale, claimed depreciation is recaptured at up to 25%, and gains may owe capital-gains tax (a 1031 exchange can defer both). Figures are a year-1 estimate at your 24.0% rate — not tax advice; consult a CPA.
Schools (NCES district)
- District
- Newburgh City School District
- NCES district ID
- 3620700
- Math proficiency
- 33% ▼ -8.00%
- Reading proficiency
- 48% ▲ 10.00%
- Median HH income
- $56,387
- Composite
- 35.46/100
- National rank
- #4927
- State rank
- #500 of 590 in NY
Livability — Newburgh
- Score
- 62/100
- State rank
- #878
- US rank
- #17021
Category grades
Schools grade is shown separately in the Schools card above.
Census & demographics
- Census place
- Newburgh, NY
- County
- Orange County · 267,004 people
- City population
- 55,152
- Metro
- Poughkeepsie-Newburgh-Middletown, NY
- Population (ZIP)
- 55,152
- Household income
- $85,697
- Rent vs Own
- Severe rent burden
- 2412.0
Population outlook (Orange County) Hauer SSP2
- Today (2025)
- 379,830 people
- By 2030
- 378,955 · -0.2%
- By 2040
- 375,444 · -1.2%
- By 2050
- 369,311 · -2.8%
- By 2075
- 354,233 · -6.7%
- By 2100
- 318,150 · -16.2%
Race, ethnicity, and origin ACS 2023
- Neighborhood character
- Diverse neighborhood (Simpson 0.68)
- Race & ethnicity
- Hispanic / Latino 39% White 36% Black 20% Two or more races 12% Asian 2%
- Hispanic origin (detail)
- Mexican 14% Puerto Rican 10% Dominican 2%
- Common ancestry
- Romanian 2% Hispanic 1% Lithuanian 1%
- Foreign-born
- 18% · Canada, Dominican Republic
- Languages at home
- 64% English-only · Spanish 30% French/Haitian/Cajun 1% Other Indo-European 1%
Political lean MEDSL · Orange
- 2024 margin
- Lean R (+8.4) · D 45.8% · R 54.2%
- 2008→2024 swing
- -12.5pp toward R · 2008: 4.1pp · 2024: -8.4pp
- All cycles
- 2024: R+8.4 2020: R+0.2 2016: R+6.5 2012: D+5.2 2008: D+4.1
Not yet ingested
- Civics
- —
Market trends
- HPI YoY
- ▼ -151.93%
- Current HPI
- 304.1046
- Rent YoY
- ▲ 0.63%
- Metro
- Poughkeepsie-Newburgh-Middletown, NY
- State GDP YoY
- ▲ 2.60%
- F500 in state
- 92
Industry mix (Fortune 500 HQ in NY)
| Industry | F500 HQs | Revenue |
|---|---|---|
| Financial Services | 10 | $950B |
|
||
| Consumer Goods | 9 | $162B |
|
||
| Insurance | 4 | $225B |
|
||
| Telecommunications | 2 | $144B |
|
||
| Pharmaceuticals | 2 | $112B |
|
||
| Media / Entertainment | 2 | $69B |
|
||
Price history
+787.0% since first listed9 events — show timeline
- 2026-05-28 Listed $479,000 OneKey® MLS as Distributed by MLS Grid
- 2024-10-04 Rental Removed $1,100 APPFOLIO
- 2024-09-20 Listed for Rent $1,100 APPFOLIO
- 2024-09-07 Rental Removed $1,100 APPFOLIO
- 2024-08-29 Listed for Rent $1,100 APPFOLIO
- 2024-08-16 Rental Removed $1,100 APPFOLIO
- 2024-08-08 Listed for Rent $1,100 APPFOLIO
- 2022-05-31 Price Changed $1,050 RENT.
- 1987-11-12 Sold (Public Records) $54,000 Public Records
Property tax history
+4.8%/yrLatest (2025): $8,540 · -4.2% YoY. Source: county tax records.
Cash-flow waterfall
monthlySold comps — $/sqft
last 12 mo · ≤1 miLoading sold comps…