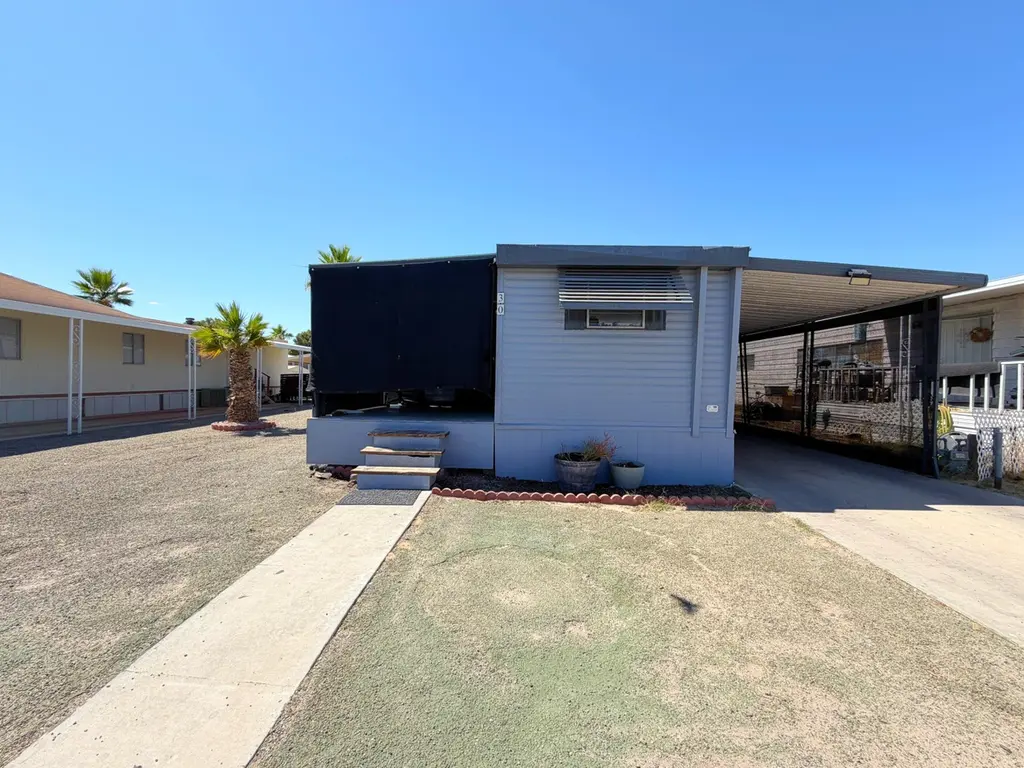
3589 W Wells Rd #30 · Blythe, CA
Flood risk 1/10 · Minimal
- FEMA flood zone
- D
- Chance of flooding over 30 yrs
- 0.0%
- Est. flood insurance / yr
- $544 – $1,084
Fire risk 4/10 · Minor
- Est. fire insurance / yr
- $659 – $1,223
Heat risk 9/10 · Severe
- Hot days now (above 116°F)
- 6 days/yr
- Hot days in 30 yrs
- 14 days/yr
Wind risk 1/10 · Minimal
- Chance of severe wind over 30 yrs
- —
Air-quality risk 2/10 · Minimal
- Unhealthy air days now
- 1 days/yr
- Unhealthy air days in 30 yrs
- 1 days/yr
Risk factors via First Street. Map © Google.
Why this score? — see what drove the D grade
The composite is a weighted blend of 9 inputs, each scored 0–100. Each bar is that input's sub-score; the figure is the points it added to the 100-point composite (weight × sub-score).
- Cash flow +15.0/30.0
- ARV discount +7.5/15.0
- 1% rule +5.0/10.0
- DSCR +5.0/10.0
- Livability +3.7/5.0
- Schools +2.6/10.0
- Rent growth +2.5/5.0
- Condition / age +2.5/5.0
- Appreciation +0.0/10.0
$8,500
🖨 Deal sheet 📄 Offer letter ✓ Due diligence
Listing remarks
Investor Special!!! Full Renovation Opportunity Great value and opportunity for investors or buyers looking to take on a full renovation project. This property offers a functional layout and solid footprint, ready to be reimagined and brought back to life. Located within a mobile home park, residents enjoy access to community amenities including a pool, adding long-term appeal. Excellent potential to add value and customize to your vision.
Key facts
- Excellent potential
- Community amenities
- Functional layout
Tags
Property features AI
Finance
- Other: Listing terms: Cash; Sale type: Standard; Short term rentals: Not allowed; Will not consider lease
- Financial info: Land lease amount $625 annually
- HOA & community: Monthly association fee of $625; Association provides other amenities
Exterior
- Parking: 2 covered spaces (attached carport); 2 carport spaces; 6 total parking spaces; No garage
- Security: No security/safety features
- Utilities: Sewer connected and paid; PUD: No
- Home design: Single-story (ground level); Year built per assessor
- Construction: Year built source: Assessor
- Exterior features: Community in-ground pool; Detached property; Lease land type
Interior
- Bedrooms: Entry; Living Room
- Flooring: Laminate flooring
- Bathrooms: 1 full bathroom
- Heating & cooling: No central heating; Wall/window air conditioning unit(s)
- Interior features: Unfurnished
Neighborhood map
What this means for you Summary
Snapshot
- This is a 2-bed/1.0-bath manufactured listed at $8k.
Deal economics
- At list price, monthly cash flow is $435 ($5k/yr) — positive.
- The deal already cash-flows at list — no discount required.
- Meets the 1% rule at list price ($1k rent vs $8k).
- Recommended offer: $8k (3.0% below list) — sets the bar for market timing.
- Cap rate 67.7% vs local median 4.6% in Blythe — top-decile yield for the area; either an underpriced asset or a hidden risk that comps aren't pricing in. Stress-test before assuming the spread holds.
Location & tenants
- Location reads 74/100 on livability (#143 in CA, #4,910 nationally) — a middle-class / working-renter tenant base. Strengths: commute A+, housing A+, health & safety A+; Watch: employment D, schools F, amenities F.
- Palo Verde Unified (town): math 20% / reading 34% proficiency, ranked #1,133 of 1,400 in CA (top 81%) — low school quality limits family demand, transient renter base, plan for 1-2y turnover; 64% free/reduced lunch — lower-income household profile, screen leases tightly.
- Market conditions: 189 active listings in the ZIP; 9,195 units permitted in Riverside County in 2024 (1,512 in 5+ unit buildings).
Forward outlook
- Local home prices are declining (-3.0%/yr); year-one equity from $59 of loan paydown is wiped out by about $255 of value loss. Plan a longer hold.
- Riverside County population projected at +22% by 2050 — long-run rental-demand tailwind backs the buy-and-hold thesis.
- At projected returns (-3.0% appreciation + 3.0% rent growth), your $2k cash investment doubles in ~1 year — after that, you're playing with house money.
Negotiation context
- It's been on market 49 days — a 3% lower offer ($8k) is reasonable based on typical stale-listing flexibility.
- 2 sale attempts since 4y ago; this cycle's ask has dropped $6k (41%) from the opening price — seller is motivated, your offer sets the floor, not the list.
Risks & watch-outs
- Watch-outs: HOA is 44% of rent.
- Climate carrying-cost: extreme-heat days projected 6→14/yr by 2055 (HVAC capex compounding) — expect insurance premiums to compound above CPI over the hold.
Questions for the listing agent
- It's been on market 49 days. Have you received any prior offers? Is the seller open to a 3% concession, seller financing, or rate buy-down credit?
- Built in 1964 — when were the roof, HVAC, electrical panel, plumbing, and water heater last replaced?
- What does the HOA fee cover, when was the last increase, and are there any pending special assessments or reserve-fund shortfalls?
- Is there a deadline driving the sale (1031 exchange, divorce, estate, relocation)? That informs how much negotiation room exists.
- Schools are F-rated, which usually means shorter tenancies and higher turnover. Who's the typical renter profile here, and what's been the actual vacancy rate?
- The area grade is low — what's the realistic commute time and amenity access for the typical tenant pool here? Any planned neighborhood developments (good or bad) we should know about?
- What's the average days-on-market for RENTAL listings here right now (not sales)? A rising rental-DOM trend means longer vacancies and softer asking-rent achievability than the comps imply.
- What's the recent tenant-quality profile in this submarket — average credit score on applications, eviction rate, late-payment / NSF rate, and stable-employment percentage? A property-management company in the area should have these aggregated.
- How much new for-sale + rental construction is in the pipeline within 1–3 miles? Heavy new supply typically softens prices + rents 12–24 months out; constrained supply supports both.
Investment metrics
- 1% rule
- 16.66% ✓
- Cap rate
- 67.68%
- Cash-on-cash
- 219.24%
- DSCR
- 10.75
- GRM
- 0.5
CMA / ARV
- ARV (median comp)
- $24,630
- List price
- $8,500
- Delta
- -65.49%
- Verdict
- UNDERPRICED
- Comps
- 1 within 2.0 mi
Show comp detail 3 sales within ~0.75 mi
| Address | Dist | Beds/Ba | Sqft | Sold | Price | $/sf | Match |
|---|---|---|---|---|---|---|---|
| 3589 Wells Rd | 0.00mi | 2/2.0 | 896 (+10%) | 10mo | $25,000 | $28 | 71 |
| 3589 Wells Rd #6 | 0.04mi | 2/1.0 | 720 (-11%) | 14mo | $16,000 | $22 | 68 |
| 3589 Wells #31 | 0.00mi | 3/2.0 (+1) | 747 (-8%) | 23mo | $8,500 | $11 | 59 |
Match score weights: distance 35% · size 25% · config 20% · recency 20%. Top-matched comps best support the ARV.
Projected returns pro-forma
-3.0% appreciation · 3.0% rent growth · sell at horizon
- IRR
- —
- Equity multiple
- 12.23×
- Total profit
- $26,722
- Equity at exit
- $1,267
- IRR
- —
- Equity multiple
- 26.45×
- Total profit
- $60,578
- Equity at exit
- $735
Cash invested: $2,380 (down + closing). Projections, not guarantees.
Landlord ↔ Tenant lean methodology
- Overall (STATE)
- 18 Strongly Tenant-Friendly
- State California
- 18 Strongly Tenant-Friendly · D+13
- County
- — inherits STATE
- City
- — inherits STATE
ZIP-level market 92225
- Home prices YoY
- -15.8%
- Active inventory
- 189
- Price-to-rent
- 0.5×
Monthly cashflow live
- Estimated rent
- $1,416 medium interval (Pro) →
- Mortgage (P&I)
- −$45
- Tax est. 1.5%
- −$11 /mo · $128/yr
- Insurance
- −$4
- HOA
- −$625
- Vacancy / Maint / Mgmt
- −$297
- Net cashflow
- $435
Break-even live
UW: 25.0% down · 7.5% · 30yr · 1.5% tax · 5.0% vac · 8.0% maint · 8.0% mgmt
Financing live
Cash to close
- Down payment
- $2,125
- Closing costs
- $255
- Reserves months
- —
- Total cash needed
- —
Loan-product check · same deal, 3 products live
Conventional
25% down · 7.5% · 30yr
- Down + closing
- —
- Monthly P&I
- —
- Monthly cashflow
- —
- DSCR
- —
- Eligible?
- —
Personal DTI + credit; lowest rate.
DSCR
20% down · 8.5% · 30yr
- Down + closing
- —
- Monthly P&I
- —
- Monthly cashflow
- —
- DSCR
- —
- Eligible?
- —
No personal income docs; deal must DSCR.
Hard money
10% down · 12.0% · 12mo
- Down + closing
- —
- Monthly P&I
- —
- Monthly cashflow
- —
- DSCR
- —
- Eligible?
- —
Short-term bridge; refi at stabilization.
HOA detail
- Monthly dues
- $625 · $7,500/yr
- Likely covers
- pool
Listing history 20 events
-
2026-06-19days on market $8,500 Active 49 DOM
-
2026-06-18days on market $8,500 Active 48 DOM
-
2026-06-17days on market $8,500 Active 47 DOM
-
2026-06-16days on market $8,500 Active 46 DOM
-
2026-06-15days on market $8,500 Active 45 DOM
-
2026-06-14days on market $8,500 Active 43 DOM
-
2026-06-12pricedays on market $8,500 Active 42 DOM
-
2026-06-09days on market $10,000 Active 39 DOM
-
2026-06-08days on market $10,000 Active 38 DOM
-
2026-06-07days on market $10,000 Active 37 DOM
-
2026-06-07days on market $10,000 Active 36 DOM
-
2026-06-04days on market $10,000 Active 33 DOM
-
2026-06-02days on market $10,000 Active 32 DOM
-
2026-06-01days on market $10,000 Active 31 DOM
-
2026-05-31days on market $10,000 Active 30 DOM
-
2026-05-31days on market $10,000 Active 29 DOM
-
2026-05-14price $10,000 444-char remark
-
2026-05-01$14,500 Active 444-char remark
-
2022-09-16historical
-
2022-09-09$22,000 Active
ⓘ Source: listings_history table (triggers on properties + properties_extension) + one-shot
backfill from property_details.listing_events for pre-trigger history.
Climate risk First Street
- Flood 1/10 Low FEMA zone D · 0% chance over 30 yrs
- Wildfire 4/10 Moderate
- Heat 9/10 Extreme 6 d/yr ≥116°F today · 14 d/yr by 30 yrs out
- Wind 1/10 Low
- Air quality 2/10 Low 1 unhealthy d/yr today · 1 by 30 yrs out
Nearby sold comps map
Loading sold comps map…
Walkable amenities ~0.75 mi
Loading nearby amenities…
Taxation est. · year 1
- Rental income
- $16,991
- − Mortgage interest
- −$476
- − Property taxes
- −$128
- − Insurance
- −$42
- − Repairs & maintenance
- −$1,359
- − Management
- −$1,359
- − HOA
- −$7,500
- − Depreciation
- −$247
- Taxable income
- $5,879
- Est. tax owed @ 24.0%
- −$1,411
- After-tax cash flow
- $3,807/yr
For passive investors: Depreciation is non-cash, so a rental often shows a tax loss while cash-flowing — sheltering income. Rental losses are passive: they offset passive income freely, and up to $25,000/yr can offset ordinary (W-2) income if you actively participate and your MAGI is under $100k (phasing out to $0 by $150k); unused losses carry forward. On sale, claimed depreciation is recaptured at up to 25%, and gains may owe capital-gains tax (a 1031 exchange can defer both). Figures are a year-1 estimate at your 24.0% rate — not tax advice; consult a CPA.
Schools (NCES district)
- District
- Palo Verde Unified
- NCES district ID
- 0629640
- Math proficiency
- 20% ▲ 3.00%
- Reading proficiency
- 34% ▲ 5.00%
- Median HH income
- $40,808
- Composite
- 25.77/100
- National rank
- #12796
- State rank
- #1133 of 1400 in CA
Livability — Blythe
- Score
- 74/100
- State rank
- #143
- US rank
- #4910
Category grades
Schools grade is shown separately in the Schools card above.
Census & demographics
- Census place
- Blythe, CA
- Population (ZIP)
- 21,101
Population outlook (Riverside County) Hauer SSP2
- Today (2025)
- 2,664,475 people
- By 2030
- 2,802,692 · +5.2%
- By 2040
- 3,050,904 · +14.5%
- By 2050
- 3,256,783 · +22.2%
- By 2075
- 3,655,058 · +37.2%
- By 2100
- 3,766,594 · +41.4%
Race, ethnicity, and origin ACS 2023
- Neighborhood character
- Diverse neighborhood (Simpson 0.58)
- Race & ethnicity
- Hispanic / Latino 59% White 26% Two or more races 13% Black 10% Asian 2% Native American 2%
- Hispanic origin (detail)
- Mexican 54%
- Common ancestry
- Lithuanian 1% Romanian 1% Iranian 1%
- Foreign-born
- 18% · Canada
- Languages at home
- 55% English-only · Spanish 42% Other Indo-European 1% Tagalog/Filipino 0%
Political lean MEDSL · Riverside
- 2024 margin
- Toss-up / Even · D 48.0% · R 49.3% · Other 2.6%
- 2008→2024 swing
- -3.6pp toward R · 2008: 2.3pp · 2024: -1.3pp
- All cycles
- 2024: R+1.3 2020: D+8.0 2016: D+4.3 2012: R+0.4 2008: D+2.3
Not yet ingested
- Civics
- —
Market trends
- HPI YoY
- ▼ -40.53%
- Current HPI
- 215.4794
- Rent YoY
- —
- Metro
- —
- State GDP YoY
- ▲ 3.21%
- F500 in state
- 116
Industry mix (Fortune 500 HQ in CA)
| Industry | F500 HQs | Revenue |
|---|---|---|
| Technology | 27 | $1,492B |
|
||
| Financial Services | 3 | $174B |
|
||
| Retail | 3 | $44B |
|
||
| Insurance | 3 | $26B |
|
||
| Media / Entertainment | 2 | $115B |
|
||
| Pharmaceuticals / Biotech | 2 | $62B |
|
||
Price history
-61.4% since first listed5 events — show timeline
- 2026-06-11 Price Changed $8,500 GPSMLS
- 2026-05-14 Price Changed $10,000 GPSMLS
- 2026-05-01 Listed $14,500 GPSMLS
- 2022-09-16 Listing Removed — CRMLS
- 2022-09-09 Listed $22,000 CRMLS
Cash-flow waterfall
monthlySold comps — $/sqft
last 12 mo · ≤1 miLoading sold comps…