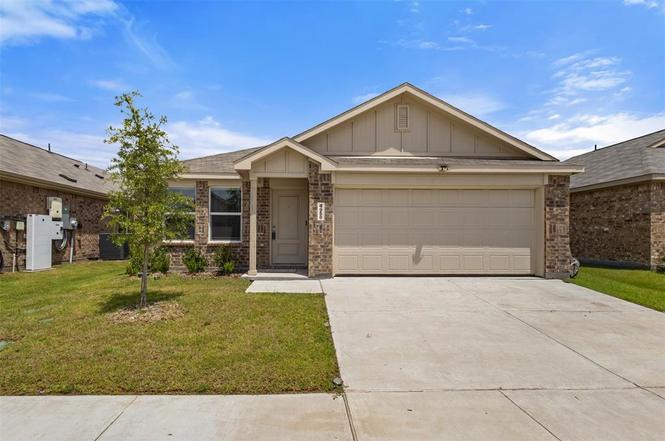
4958 Meadow Glen Dr · Ennis, TX
Flood risk No data
- FEMA flood zone
- —
- Chance of flooding over 30 yrs
- —
- Est. flood insurance / yr
- —
Fire risk No data
- Est. fire insurance / yr
- —
Heat risk No data
- Hot days now (above threshold)
- —
- Hot days in 30 yrs
- —
Wind risk No data
- Chance of severe wind over 30 yrs
- —
Air-quality risk No data
- Unhealthy air days now
- —
- Unhealthy air days in 30 yrs
- —
Risk factors via First Street. Map © Google.
Why this score? — see what drove the D- grade
The composite is a weighted blend of 9 inputs, each scored 0–100. Each bar is that input's sub-score; the figure is the points it added to the 100-point composite (weight × sub-score).
- Cash flow +10.4/30.0
- ARV discount +8.2/15.0
- 1% rule +3.6/10.0
- Livability +3.6/5.0
- Schools +3.4/10.0
- Rent growth +3.2/5.0
- DSCR +3.0/10.0
- Condition / age +2.5/5.0
- Appreciation +0.0/10.0
$264,000
🖨 Deal sheet 📄 Offer letter ✓ Due diligence
Listing remarks MLS
This new single-story design makes smart use of the space available. At the front are all three secondary bedrooms arranged near a convenient full-sized bathroom. Down the foyer is a modern layout connecting a peninsula-style kitchen made for inspired meals, a secluded dining area and a family room ideal for gatherings. Tucked in a quiet corner is the owner’s suite with an attached bathroom and walk-in closet. Prices and features may vary and are subject to change. Photos are for illustrative purposes only.
Key facts
- 5,053 sq ft lot
- 2 garage spots
- Community pool
Property features AI
Finance
- HOA & community: Mandatory HOA; HOA fee $949 annually; HOA covers full use of facilities, internet, grounds maintenance, and management fees; HOA management: SW Legacy
Exterior
- Parking: Driveway; Covered parking for 2 vehicles; Attached 2-car garage
- Utilities: City water; City sewer; No municipal utility district; Energy-efficient features: enhanced attic insulation, HVAC efficiency, insulation, efficient lighting
- Home design: Single-family residence; Residential property; One story; Property is not attached; Subdivision: Prairie View Watermill
- Construction: Shingle roof; Slab foundation; Year built: 2025; Smart home features present
- Exterior features: Sprinkler system; Community amenities: club house, park, playground, pool, sidewalks
Interior
- Kitchen: Dishwasher; Disposal; Electric range; Microwave; Refrigerator
- Bedrooms: 4 bedrooms; Primary bedroom on main level with walk-in closet(s) and linen closet; Additional bedrooms on main level
- Flooring: Ceramic tile; Luxury vinyl plank
- Bathrooms: 2 full bathrooms
- Heating & cooling: Central heating; Central air
- Interior features: Cable TV available; Decorative lighting; Eat-in kitchen; High-speed internet available; Kitchen island; Pantry; Walk-in closet(s); One living area; One dining area; Room count: 3; Levels: One
- Laundry & utility: Utility room
Neighborhood map
What this means for you Summary
Snapshot
- This is a 4-bed/2.0-bath single-family listed at $264k.
Deal economics
- At list price, monthly cash flow is $-138 ($-2k/yr) — negative.
- To cash-flow at today's rent, offer at most $240k (9.3% below list).
- To meet the 1% rule (rent ≥ 1% of price), the offer needs to be $226k (14.3% below list).
- Recommended offer: $226k (14.3% below list) — sets the bar for 1% rule.
- Cap rate 5.7% vs local median 4.5% in Ennis — meaningfully above typical; check what's discounted (condition, days-on-market, listing class) to confirm the premium yield is real.
Location & tenants
- Location reads 71/100 on livability (#304 in TX) — a middle-class / working-renter tenant base. Strengths: cost of living A+, housing A+, crime B+; Watch: amenities F, commute F, health & safety F.
- Ennis ISD (rural): math 41% / reading 39% proficiency, ranked #411 of 826 in TX (top 50%) — families likely to look elsewhere, expect single-tenant / working-renter base with shorter leases; 60% free/reduced lunch — lower-income household profile, screen leases tightly.
- Zoned schools: Houston El (math 37% / reading 37%, grade F, #1,769 of 4,322 statewide, top 44%, 302 students, 77% FRL) — zoned schools average 77% FRL vs 60% district-wide (17 pts higher); higher-poverty schools than district average — tighter screening recommended.
- Market conditions: Rents rising (+3.0%/yr); 363 active listings in the ZIP; 3 comparable units currently listed for rent nearby; rentals leasing fast (median 3d on market — plan ~1-2 weeks tenant-placement turnaround); solid renter incomes; 3,016 units permitted in Ellis County in 2024 (20 in 5+ unit buildings).
- This rent runs 35% of the median local income ($77k/yr) — at the standard rent-burdened threshold; future hikes will face affordability resistance.
Forward outlook
- Local home prices are declining (-3.0%/yr); year-one equity from $2k of loan paydown is wiped out by about $8k of value loss. Plan a longer hold.
- Ellis County population projected at +36% by 2050 — long-run rental-demand tailwind backs the buy-and-hold thesis.
Negotiation context
- Only 1 days on market — expect competitive offers; lowballing is unlikely to land.
- 2 sale attempts with the ask held roughly flat each time — persistent listings suggest the price (not the market) is what's stuck; bring a comps-based counter.
Questions for the listing agent
- What do current leases actually rent for vs. the listed asking? Can we see a recent rent roll and the last 12 months of T-12 income?
- What does the HOA fee cover, when was the last increase, and are there any pending special assessments or reserve-fund shortfalls?
- Is there a deadline driving the sale (1031 exchange, divorce, estate, relocation)? That informs how much negotiation room exists.
- Schools are D-rated, which usually means shorter tenancies and higher turnover. Who's the typical renter profile here, and what's been the actual vacancy rate?
- The area grade is low — what's the realistic commute time and amenity access for the typical tenant pool here? Any planned neighborhood developments (good or bad) we should know about?
- What's the average days-on-market for RENTAL listings here right now (not sales)? A rising rental-DOM trend means longer vacancies and softer asking-rent achievability than the comps imply.
- What's the recent tenant-quality profile in this submarket — average credit score on applications, eviction rate, late-payment / NSF rate, and stable-employment percentage? A property-management company in the area should have these aggregated.
- How much new for-sale + rental construction is in the pipeline within 1–3 miles? Heavy new supply typically softens prices + rents 12–24 months out; constrained supply supports both.
Investment metrics
- 1% rule
- 0.86% ✗
- Cap rate
- 5.66%
- Cash-on-cash
- -2.25%
- DSCR
- 0.90
- GRM
- 9.7
CMA / ARV
- ARV (on-the-fly)
- $268,470
- Comps found
- 12
Show comp detail 12 sales within ~0.75 mi
| Address | Dist | Beds/Ba | Sqft | Sold | Price | $/sf | Match |
|---|---|---|---|---|---|---|---|
| 4977 Meadow Glen Dr | 0.03mi | 4/2.0 | 1,720 (+1%) | 3mo | $243,049 | $141 | 95 |
| 1063 Shady Oaks Dr | 0.11mi | 4/2.0 | 1,720 (+1%) | 0mo | $285,999 | $166 | 94 |
| 1046 Shady Oaks Dr | 0.11mi | 4/2.0 | 1,720 (+1%) | 1mo | $288,359 | $168 | 94 |
| 4730 Paynes Valley Dr | 0.12mi | 3/2.0 (-1) | 1,604 (-6%) | 2mo | $275,299 | $172 | 77 |
| 4755 Paynes Valley Dr | 0.12mi | 3/2.0 (-1) | 1,604 (-6%) | 2mo | $277,899 | $173 | 77 |
| 1047 Neyland Dr | 0.06mi | 3/2.0 (-1) | 1,522 (-11%) | 5mo | $224,474 | $147 | 70 |
| 1004 Neyland Dr | 0.06mi | 3/2.0 (-1) | 1,522 (-11%) | 5mo | $248,099 | $163 | 70 |
| 4754 Paynes Valley Dr | 0.12mi | 3/2.0 (-1) | 1,952 (+14%) | 2mo | $279,799 | $143 | 64 |
| 925 Birkdale Dr | 0.11mi | 3/2.0 (-1) | 1,461 (-15%) | 5mo | $218,899 | $150 | 61 |
| 2040 Shady Oaks Dr | 0.22mi | 3/2.0 (-1) | 1,461 (-15%) | 3mo | $207,549 | $142 | 58 |
| 2119 Neyland Dr | 0.34mi | 3/2.0 (-1) | 1,461 (-15%) | 2mo | $228,999 | $157 | 53 |
| 2100 Neyland Dr | 0.32mi | 3/2.0 (-1) | 1,461 (-15%) | 4mo | $217,249 | $149 | 52 |
Match score weights: distance 35% · size 25% · config 20% · recency 20%. Top-matched comps best support the ARV.
Projected returns pro-forma
-3.0% appreciation · 2.95% rent growth · sell at horizon
- IRR
- -20.0%
- Equity multiple
- 0.30×
- Total profit
- $-51,604
- Equity at exit
- $39,363
- IRR
- -13.0%
- Equity multiple
- 0.24×
- Total profit
- $-56,351
- Equity at exit
- $22,826
Cash invested: $73,920 (down + closing). Projections, not guarantees.
Landlord ↔ Tenant lean methodology
- Overall (STATE)
- 87 Strongly Landlord-Friendly
- State Texas
- 87 Strongly Landlord-Friendly · R+5
- County
- — inherits STATE
- City
- — inherits STATE
ZIP-level market 75119
- Rents YoY
- 3.0%
- Active inventory
- 363
- Price-to-rent
- 9.7×
Monthly cashflow live
- Estimated rent
- $2,263 medium interval (Pro) →
- Mortgage (P&I)
- −$1,384
- Tax from tax record
- −$353 /mo · $4,235/yr
- Insurance
- −$110
- HOA
- −$79
- Vacancy / Maint / Mgmt
- −$475
- Net cashflow
- $-138
Break-even live
UW: 25.0% down · 7.5% · 30yr · 1.5% tax · 5.0% vac · 8.0% maint · 8.0% mgmt
Financing live
Cash to close
- Down payment
- $66,000
- Closing costs
- $7,920
- Reserves months
- —
- Total cash needed
- —
Loan-product check · same deal, 3 products live
Conventional
25% down · 7.5% · 30yr
- Down + closing
- —
- Monthly P&I
- —
- Monthly cashflow
- —
- DSCR
- —
- Eligible?
- —
Personal DTI + credit; lowest rate.
DSCR
20% down · 8.5% · 30yr
- Down + closing
- —
- Monthly P&I
- —
- Monthly cashflow
- —
- DSCR
- —
- Eligible?
- —
No personal income docs; deal must DSCR.
Hard money
10% down · 12.0% · 12mo
- Down + closing
- —
- Monthly P&I
- —
- Monthly cashflow
- —
- DSCR
- —
- Eligible?
- —
Short-term bridge; refi at stabilization.
Rent comps 3 comps
| Address | Beds | Baths | Sqft | Rent | $/sqft | DOM | Units | Dist |
|---|---|---|---|---|---|---|---|---|
| 1215 Knoll Dr Ennis, TX | 4.0 | 2.0 | 1609 | $2,050 | $1.27 | 2d | 1 | 1.14mi |
| 1200 Canterbury Ln Ennis, TX | 3.0 | 2.0 | 1508 | $2,250 | $1.49 | 10d | 1 | 1.29mi |
| 1213 Wildflower St Ennis, TX | 4.0 | 2.0 | 1696 | $2,100 | $1.24 | 2d | 1 | 1.36mi |
HOA detail
- Monthly dues
- $79 · $948/yr
Listing history 1 events
-
2026-06-18$264,000 Active 1 DOM
ⓘ Source: listings_history table (triggers on properties + properties_extension) + one-shot
backfill from property_details.listing_events for pre-trigger history.
Tax reassessment forecast TX · Resets to sale price
- Current annual tax
- $4,235 · $353/mo
- Projected year-2 tax
- $4,831 · $403/mo
- Expected delta
- +$596/yr (+$50/mo · 14.1%)
ⓘ Screening estimate from a state-policy table — verify with the county assessor before closing.
Nearby sold comps map
Loading sold comps map…
Walkable amenities ~0.75 mi
Loading nearby amenities…
Taxation est. · year 1
- Rental income
- $27,161
- − Mortgage interest
- −$14,788
- − Property taxes
- −$4,235
- − Insurance
- −$1,320
- − Repairs & maintenance
- −$2,173
- − Management
- −$2,173
- − HOA
- −$948
- − Depreciation
- −$7,680
- Taxable loss
- −$6,156
- Est. tax savings @ 24.0%
- +$1,478
- After-tax cash flow
- $-182/yr
For passive investors: Depreciation is non-cash, so a rental often shows a tax loss while cash-flowing — sheltering income. Rental losses are passive: they offset passive income freely, and up to $25,000/yr can offset ordinary (W-2) income if you actively participate and your MAGI is under $100k (phasing out to $0 by $150k); unused losses carry forward. On sale, claimed depreciation is recaptured at up to 25%, and gains may owe capital-gains tax (a 1031 exchange can defer both). Figures are a year-1 estimate at your 24.0% rate — not tax advice; consult a CPA.
Schools (NCES district)
- District
- Ennis ISD
- NCES district ID
- 4818540
- Math proficiency
- 41% ▼ -6.00%
- Reading proficiency
- 39% ▼ -3.00%
- Median HH income
- $46,105
- Composite
- 34.14/100
- National rank
- #5283
- State rank
- #411 of 826 in TX
Livability — Ennis
- Score
- 71/100
- State rank
- #304
- US rank
- #6893
Category grades
Schools grade is shown separately in the Schools card above.
Census & demographics
- Census place
- Ennis, TX
- County
- Ellis County · 199,237 people
- City population
- 31,866
- Metro
- Dallas-Fort Worth-Arlington, TX
- Population (ZIP)
- 31,866
- Household income
- $77,053
- Rent vs Own
- Severe rent burden
- 784.0
Population outlook (Ellis County) Hauer SSP2
- Today (2025)
- 194,556 people
- By 2030
- 209,679 · +7.8%
- By 2040
- 238,837 · +22.8%
- By 2050
- 265,451 · +36.4%
- By 2075
- 326,571 · +67.9%
- By 2100
- 362,156 · +86.1%
Race, ethnicity, and origin ACS 2023
- Neighborhood character
- Diverse neighborhood (Simpson 0.60)
- Race & ethnicity
- White 47% Hispanic / Latino 41% Two or more races 13% Black 9%
- Hispanic origin (detail)
- Mexican 37%
- Common ancestry
- Slovak 1% Serbian 1% Italian 1%
- Foreign-born
- 15% · Canada
- Languages at home
- 69% English-only · Spanish 29% Other Indo-European 1%
Political lean MEDSL · Ellis
- 2024 margin
- Solid R (+31.1) · D 34.0% · R 65.1%
- 2008→2024 swing
- +11.2pp toward D · 2008: -42.2pp · 2024: -31.1pp
- All cycles
- 2024: R+31.1 2020: R+34.1 2016: R+45.4 2012: R+47.5 2008: R+42.2
Not yet ingested
- Civics
- —
Market trends
- HPI YoY
- ▼ -207.30%
- Current HPI
- 253.0134
- Rent YoY
- ▲ 2.95%
- Metro
- Dallas-Fort Worth-Arlington, TX
- State GDP YoY
- ▲ 3.95%
- F500 in state
- 110
Industry mix (Fortune 500 HQ in TX)
| Industry | F500 HQs | Revenue |
|---|---|---|
| Energy | 16 | $1,198B |
|
||
| Technology | 5 | $198B |
|
||
| Engineering / Construction | 4 | $72B |
|
||
| Energy Services | 3 | $60B |
|
||
| Utilities | 3 | $41B |
|
||
| Healthcare | 2 | $330B |
|
||
Price history
-0.8% since first listed6 events — show timeline
- 2026-06-18 Listed $264,000 NTREIS
- 2025-03-24 Sold (MLS) — NTREIS
- 2025-02-27 Pending — NTREIS
- 2025-02-26 Price Changed $246,999 NTREIS
- 2025-02-12 Price Changed $255,999 NTREIS
- 2025-02-06 Listed $265,999 NTREIS
Cash-flow waterfall
monthlySold comps — $/sqft
last 12 mo · ≤1 miLoading sold comps…