222 Limehouse Rd · Cranberry, PA
Flood risk 1/10 · Minimal
- FEMA flood zone
- X (unshaded)
- Chance of flooding over 30 yrs
- 0.0%
- Est. flood insurance / yr
- $507 – $1,088
Fire risk 1/10 · Minimal
- Est. fire insurance / yr
- $511 – $949
Heat risk 3/10 · Minor
- Hot days now (above 96°F)
- 6 days/yr
- Hot days in 30 yrs
- 15 days/yr
Wind risk 1/10 · Minimal
- Chance of severe wind over 30 yrs
- —
Air-quality risk 3/10 · Minor
- Unhealthy air days now
- 3 days/yr
- Unhealthy air days in 30 yrs
- 5 days/yr
Risk factors via First Street. Map © Google.
Why this score? — see what drove the C- grade
The composite is a weighted blend of 9 inputs, each scored 0–100. Each bar is that input's sub-score; the figure is the points it added to the 100-point composite (weight × sub-score).
- Cash flow +18.1/30.0
- ARV discount +9.3/15.0
- DSCR +5.7/10.0
- Schools +5.2/10.0
- 1% rule +4.5/10.0
- Condition / age +4.0/5.0
- Livability +2.5/5.0
- Rent growth +2.0/5.0
- Appreciation +0.0/10.0
$515,000
🖨 Deal sheet (PDF) 📄 Offer letter ✓ Due diligence
Listing remarks
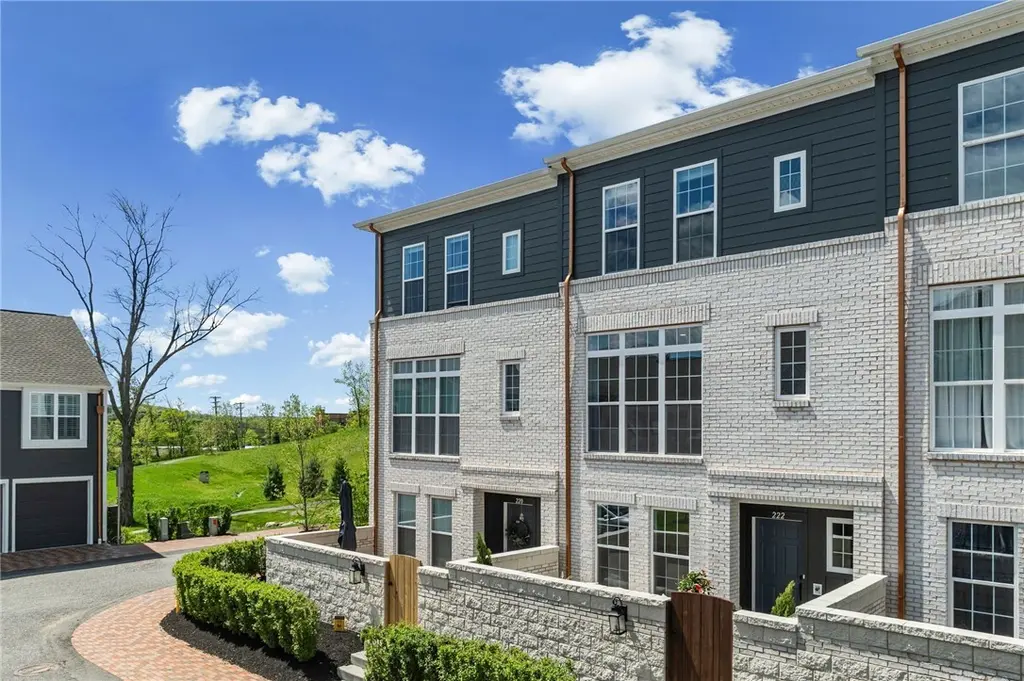
Welcome home to 222 Limehouse Road in the highly desirable Crescent neighborhood in Cranberry Township—located next to the Lemieux Sports Complex, future Wegmans, Cranberry Springs, shopping, dining, and major highways. Crescent offers a rare blend of urban convenience and natural beauty with preserved green spaces, scenic walking trails, a stunning 2-acre lake, future boutique shoppes, fitness amenities, and thoughtfully designed gathering spaces throughout the neighborhood. Perfectly positioned on a private cul-de-sac in Limehouse backing to over 40 acres of mature trees, this stunning brick and Hardie Board home offers exceptional privacy, timeless curb appeal, and direct trail acc
Key facts
- Direct trail access
- Gated entry
- Private cul-de-sac
Tags
Property features AI
Finance
- HOA & community: Association fee $135 per month
Exterior
- Parking: Attached garage with built-in parking and garage door opener; 2 parking spaces (total)
- Utilities: Public water; Public sewer
- Home design: 3 stories; Resale property; Asphalt roof; Brick and HardiPlank-type exterior
- Construction: Brick and HardiPlank-type construction
- Exterior features: Lot dimensions approximately 21x62x20x61
Interior
- Kitchen: Dishwasher; Disposal; Microwave; Refrigerator; Stove; Some gas appliances
- Bedrooms: Main level bedroom (11x12); Upper level bedroom (13x12); Additional bedroom
- Flooring: Hardwood; Tile; Carpet
- Bathrooms: 3 full bathrooms
- Heating & cooling: Forced air heating (gas); Central air conditioning
- Interior features: Kitchen island; Pantry; Window treatments; Multi-pane windows; Screens
- Laundry & utility: Washer; Dryer
Neighborhood map
What this means for you Summary
Snapshot
- This is a 3-bed/2.5-bath townhouse listed at $515k. Condition is rated good.
Deal economics
- At list price, monthly cash flow is $450 ($5k/yr) — positive.
- The deal already cash-flows at list — no discount required.
- To meet the 1% rule (rent ≥ 1% of price), the offer needs to be $489k (5.1% below list).
- Recommended offer: $489k (5.1% below list) — sets the bar for 1% rule.
Location & tenants
- Location reads: area grade C — affects rentability + tenant quality, not the cash-flow math above.
- Seneca Valley SD (rural): math 48% / reading 67% proficiency, ranked #73 of 539 in PA (top 14%) — acceptable for families but not a draw, mixed tenant base, ~2y average lease; only 12% free/reduced lunch — higher-income household profile.
- Market conditions: Rents soft (-1.9%/yr); 288 active listings in the ZIP; 15 comparable units currently listed for rent nearby; rentals at typical pace (median 15d on market — plan ~3-4 weeks tenant-placement turnaround); high-income renter base; 987 units permitted in Butler County in 2024 (0 in 5+ unit buildings).
- At $4,886/mo this rent would consume 47% of the median local household income ($124k/yr) (locally 536% of renters already pay >50% of income on rent) — very limited rent-growth headroom before tenants either downsize or default.
Forward outlook
- Local home prices are declining (-3.0%/yr); year-one equity from $4k of loan paydown is wiped out by about $15k of value loss. Plan a longer hold.
- Butler County population projected to shrink 5% by 2050 — rents likely to lag national; underwrite the cash flow, not the appreciation.
Negotiation context
- It's been on market 34 days — a 3% lower offer ($500k) is reasonable based on typical stale-listing flexibility.
- 2 sale attempts; this cycle's ask is 14614% above the opening price — seller raised mid-cycle; expect resistance to lowballs.
Questions for the listing agent
- It's been on market 34 days. Have you received any prior offers? Is the seller open to a 5% concession, seller financing, or rate buy-down credit?
- What does the HOA fee cover, when was the last increase, and are there any pending special assessments or reserve-fund shortfalls?
- Is there a deadline driving the sale (1031 exchange, divorce, estate, relocation)? That informs how much negotiation room exists.
- What's the average days-on-market for RENTAL listings here right now (not sales)? A rising rental-DOM trend means longer vacancies and softer asking-rent achievability than the comps imply.
- What's the recent tenant-quality profile in this submarket — average credit score on applications, eviction rate, late-payment / NSF rate, and stable-employment percentage? A property-management company in the area should have these aggregated.
- How much new for-sale + rental construction is in the pipeline within 1–3 miles? Heavy new supply typically softens prices + rents 12–24 months out; constrained supply supports both.
Investment metrics
- 1% rule
- 0.95% ✗
- Cap rate
- 7.34%
- Cash-on-cash
- 3.74%
- DSCR
- 1.17
- GRM
- 8.8
CMA / ARV
- ARV (median comp)
- $536,438
- List price
- $515,000
- Delta
- -4.00%
- Verdict
- FAIR
- Comps
- 20 within 1.0 mi
Show comp detail 6 sales within ~0.75 mi
| Address | Dist | Beds/Ba | Sqft | Sold | Price | $/sf | Match |
|---|---|---|---|---|---|---|---|
| 118 Founders St | 0.27mi | 2/2.5 (-1) | 1,650 (-2%) | 13mo | $569,990 | $345 | 69 |
| 101 Founders St | 0.23mi | 3/3.0 | 1,887 (+12%) | 11mo | $489,990 | $260 | 58 |
| 113 Founders St | 0.25mi | 3/3.0 | 1,887 (+12%) | 10mo | $484,990 | $257 | 57 |
| 111 Founders St | 0.24mi | 3/3.0 | 1,887 (+12%) | 12mo | $484,990 | $257 | 56 |
| 105 Founders St | 0.21mi | 3/3.0 | 1,887 (+12%) | 20mo | $449,990 | $238 | 51 |
| 109 Founders St | 0.24mi | 3/3.0 | 1,887 (+12%) | 20mo | $463,990 | $246 | 50 |
Match score weights: distance 35% · size 25% · config 20% · recency 20%. Top-matched comps best support the ARV.
Projected returns pro-forma
-3.0% appreciation · 0.0% rent growth · sell at horizon
- IRR
- -13.7%
- Equity multiple
- 0.52×
- Total profit
- $-69,156
- Equity at exit
- $76,788
- IRR
- -10.3%
- Equity multiple
- 0.45×
- Total profit
- $-78,761
- Equity at exit
- $44,528
Cash invested: $144,200 (down + closing). Projections, not guarantees.
Landlord ↔ Tenant lean methodology
- Overall (STATE)
- 62 Landlord-Friendly
- State Pennsylvania
- 62 Landlord-Friendly · EVEN
- County
- — inherits STATE
- City
- — inherits STATE
ZIP-level market 16066
- Rents YoY
- -1.9%
- Active inventory
- 288
- Price-to-rent
- 8.8×
Monthly cashflow live
- Estimated rent
- $4,886 high interval (Pro) →
- Mortgage (P&I)
- −$2,701
- Tax from tax record
- −$360 /mo · $4,323/yr
- Insurance
- −$215
- HOA
- −$135
- Vacancy / Maint / Mgmt
- −$1,026
- Net cashflow
- $450
Break-even live
Sensitivity live
| Price | -10% $741 | -5% $595 | +0% $450 | +5% $304 | +10% $158 |
|---|---|---|---|---|---|
| Rent | -10% $64 | -5% $257 | +0% $450 | +5% $643 | +10% $836 |
| Rate | -1.0pp $709 | -0.5pp $581 | base $450 | +0.5pp $316 | +1.0pp $180 |
UW: 25.0% down · 7.5% · 30yr · 1.5% tax · 5.0% vac · 8.0% maint · 8.0% mgmt
Financing live
Cash to close
- Down payment
- $128,750
- Closing costs
- $15,450
- Reserves months
- —
- Total cash needed
- —
Loan-product check · same deal, 3 products live
Conventional
25% down · 7.5% · 30yr
- Down + closing
- —
- Monthly P&I
- —
- Monthly cashflow
- —
- DSCR
- —
- Eligible?
- —
Personal DTI + credit; lowest rate.
DSCR
20% down · 8.5% · 30yr
- Down + closing
- —
- Monthly P&I
- —
- Monthly cashflow
- —
- DSCR
- —
- Eligible?
- —
No personal income docs; deal must DSCR.
Hard money
10% down · 12.0% · 12mo
- Down + closing
- —
- Monthly P&I
- —
- Monthly cashflow
- —
- DSCR
- —
- Eligible?
- —
Short-term bridge; refi at stabilization.
Rent comps 15 comps
| Address | Beds | Baths | Sqft | Rent | $/sqft | DOM | Units | Dist |
|---|---|---|---|---|---|---|---|---|
| 228 Limehouse Rd Cranberry Township, PA | 3.0 | 3.0 | 2000 | $6,500 | $3.25 | 44d | 1 | 0.03mi |
| 219 Limehouse Rd Cranberry Township, PA | 3.0 | 2.5 | 2200 | $7,500 | $3.41 | 44d | 1 | 0.04mi |
| 1000 Creekview Cir Cranberry Township, PA | 2.0 | 1.0–2.0 | 1244 | $2,767 | $2.22 | 2d | 16 | 0.65mi |
| 5001 Pendleton Way Cranberry Twp, PA | 1.0–3.0 | 1.0–3.0 | 1459 | $4,673 | $3.20 | 2d | 27 | 0.73mi |
| 8000 Brandt Dr Cranberry Twp, PA | 1.0–3.0 | 1.0–2.0 | 1193 | $2,776 | $2.33 | 2d | 26 | 1.04mi |
| 8131 Rowan Rd Cranberry Township, PA | 3.0 | 2.5 | 1474 | $2,800 | $1.90 | 44d | 1 | 1.09mi |
| 15000 Metropolitan WAY Cranberry Twp, PA | 2.0 | 2.0 | 1202 | $1,805 | $1.50 | 3d | 4 | 1.22mi |
| 227 Oliver Way Cranberry Twp, PA | 2.0 | 2.5 | 1561 | $2,750 | $1.76 | 44d | 1 | 1.23mi |
| 1000 Strand Rd Cranberry Township, PA | 1.0–3.0 | 1.0–2.0 | 1117 | $3,048 | $2.73 | 2d | 13 | 1.23mi |
| 305 Frederick Way Cranberry Twp, PA | 3.0 | 3.5 | 1748 | $3,200 | $1.83 | 44d | 1 | 1.24mi |
| 3022 Mahican Cir Mars, PA | 3.0 | 3.5 | 2232 | $3,250 | $1.46 | 16d | 1 | 1.28mi |
| 233 Main St Cranberry Township, PA | 3.0 | 2.5 | 1778 | $2,995 | $1.68 | 5d | 1 | 1.32mi |
| 300 Osona Ln Mars, PA | 3.0 | 2.5 | 2220 | $3,200 | $1.44 | 19d | 1 | 1.40mi |
| 401 Collingwood Ct Cranberry Twp, PA | 1.0–3.0 | 1.0–2.0 | 950 | $1,865 | $1.96 | 2d | 1 | 1.42mi |
| 411 Sussex Dr Cranberry Township, PA | 4.0 | 2.0 | 1352 | $2,500 | $1.85 | 15d | 1 | 1.44mi |
HOA detail
- Monthly dues
- $135 · $1,620/yr
Listing history 16 events
-
2026-06-18days on market $515,000 Active 34 DOM
-
2026-06-17days on market $515,000 Active 33 DOM
-
2026-06-16days on market $515,000 Active 32 DOM
-
2026-06-15days on market $515,000 Active 31 DOM
-
2026-06-13days on market $515,000 Active 29 DOM
-
2026-06-13days on market $515,000 Active 28 DOM
-
2026-06-09days on market $515,000 Active 25 DOM
-
2026-06-08days on market $515,000 Active 24 DOM
-
2026-06-07days on market $515,000 Active 23 DOM
-
2026-06-05days on market $515,000 Active 20 DOM
-
2026-06-03days on market $515,000 Active 19 DOM
-
2026-06-02days on market $515,000 Active 18 DOM
-
2026-06-01days on market $515,000 Active 17 DOM
-
2026-05-31days on market $515,000 Active 16 DOM
-
2026-05-15$515,000 Active 2545-char remark
-
2024-05-01soldstatus $449,990
ⓘ Source: listings_history table (triggers on properties + properties_extension) + one-shot
backfill from property_details.listing_events for pre-trigger history.
Tax reassessment forecast PA · Partial reset (capped growth)
- Current annual tax
- $4,323 · $360/mo
- Projected year-2 tax
- $6,230 · $519/mo
- Expected delta
- +$1,907/yr (+$159/mo · 44.1%)
ⓘ Screening estimate from a state-policy table — verify with the county assessor before closing.
Climate risk First Street
- Flood 1/10 Low FEMA zone X (unshaded) · 0% chance over 30 yrs
- Wildfire 1/10 Low
- Heat 3/10 Moderate 6 d/yr ≥96°F today · 15 d/yr by 30 yrs out
- Wind 1/10 Low
- Air quality 3/10 Moderate 3 unhealthy d/yr today · 5 by 30 yrs out
Nearby sold comps map
Loading sold comps map…
Walkable amenities ~0.75 mi
Loading nearby amenities…
Taxation est. · year 1
- Rental income
- $58,635
- − Mortgage interest
- −$28,848
- − Property taxes
- −$4,323
- − Insurance
- −$2,575
- − Repairs & maintenance
- −$4,691
- − Management
- −$4,691
- − HOA
- −$1,620
- − Depreciation
- −$14,982
- Taxable loss
- −$3,095
- Est. tax savings @ 24.0%
- +$743
- After-tax cash flow
- $6,138/yr
For passive investors: Depreciation is non-cash, so a rental often shows a tax loss while cash-flowing — sheltering income. Rental losses are passive: they offset passive income freely, and up to $25,000/yr can offset ordinary (W-2) income if you actively participate and your MAGI is under $100k (phasing out to $0 by $150k); unused losses carry forward. On sale, claimed depreciation is recaptured at up to 25%, and gains may owe capital-gains tax (a 1031 exchange can defer both). Figures are a year-1 estimate at your 24.0% rate — not tax advice; consult a CPA.
Condition & rehab AI · 12 photos
This well-maintained townhouse in the Crescent neighborhood offers a blend of modern amenities and natural beauty, with no immediate repairs needed.
Value-add opportunities
- Both Paint exterior and interior walls — Fresh paint enhances curb appeal and interior aesthetics
- Resale Replace kitchen faucet — Modern faucet improves kitchen functionality and appearance
- Both Install smart home devices — Smart home devices increase convenience and property value
Renovation cost estimate screening
Value-add ROI direction
- Both Paint exterior and interior walls — Fresh paint enhances curb appeal and interior aesthetics ↑
- Resale Replace kitchen faucet — Modern faucet improves kitchen functionality and appearance ↑
- Both Install smart home devices — Smart home devices increase convenience and property value ↑
ⓘ Cost ranges are severity-bucket heuristics (US national rule-of-thumb). Get contractor quotes + a written scope before underwriting a rehab budget.
Schools (NCES district)
- District
- Seneca Valley SD
- NCES district ID
- 4222440
- Math proficiency
- 48% ▼ -15.00%
- Reading proficiency
- 67% ▼ -12.00%
- Median HH income
- $80,381
- Composite
- 51.84/100
- National rank
- #1666
- State rank
- #73 of 539 in PA
Livability — Cranberry
No livability data for this city. (Only ~50 U.S. cities are tracked.)
Census & demographics
- County
- Butler County · 73,107 people
- Metro
- Pittsburgh, PA
- Population (ZIP)
- 33,873
- Household income
- $124,189
- Rent vs Own
- Severe rent burden
- 536.0
Population outlook (Butler County) Hauer SSP2
- Today (2025)
- 190,777 people
- By 2030
- 191,476 · +0.4%
- By 2040
- 189,474 · -0.7%
- By 2050
- 182,050 · -4.6%
- By 2075
- 159,526 · -16.4%
- By 2100
- 129,028 · -32.4%
Race, ethnicity, and origin ACS 2023
- Neighborhood character
- Predominantly White (90%)
- Race & ethnicity
- White 90% Asian 4% Two or more races 3% Hispanic / Latino 2% Black 1%
- Common ancestry
- Romanian 10% Slovak 1% Italian 1%
- Foreign-born
- 5% · Canada, China
- Languages at home
- 93% English-only · Other Indo-European 2% Spanish 1% Other Asian/Pacific 1%
Political lean MEDSL · Butler
- 2024 margin
- Solid R (+32.2) · D 33.5% · R 65.7%
- 2008→2024 swing
- -4.8pp toward R · 2008: -27.4pp · 2024: -32.2pp
- All cycles
- 2024: R+32.2 2020: R+32.5 2016: R+37.5 2012: R+34.9 2008: R+27.4
Not yet ingested
- Civics
- —
Market trends
- HPI YoY
- ▼ -154.35%
- Current HPI
- 276.4597
- Rent YoY
- ▼ -1.93%
- Metro
- Pittsburgh, PA
- State GDP YoY
- ▲ 1.68%
- F500 in state
- 34
Industry mix (Fortune 500 HQ in PA)
| Industry | F500 HQs | Revenue |
|---|---|---|
| Healthcare | 2 | $309B |
|
||
| Insurance | 2 | $27B |
|
||
| Telecommunications / Media | 1 | $124B |
|
||
| Industrial Distribution | 1 | $22B |
|
||
| Financial Services | 1 | $20B |
|
||
| Chemicals / Materials | 1 | $18B |
|
||
Price history
-99.2% since first listed4 events — show timeline
- 2026-06-15 Rental Removed $3,500 WPMLS
- 2026-06-05 Listed for Rent $3,500 WPMLS
- 2026-05-15 Listed $515,000 West Penn MLS
- 2024-05-01 Sold (Public Records) $449,990 Public Records
Property tax history
+810.3%/yrLatest (2026): $4,323 · +4.5% YoY. Source: county tax records.
Cash-flow waterfall
monthlySold comps — $/sqft
last 12 mo · ≤1 miLoading sold comps…