201 Wyatt St · Kingsland, TX
Flood risk 1/10 · Minimal
- FEMA flood zone
- X (unshaded)
- Chance of flooding over 30 yrs
- 0.0%
- Est. flood insurance / yr
- $507 – $1,088
Fire risk 4/10 · Minor
- Est. fire insurance / yr
- $1,222 – $2,270
Heat risk 8/10 · Major
- Hot days now (above 107°F)
- 7 days/yr
- Hot days in 30 yrs
- 23 days/yr
Wind risk 6/10 · Moderate
- Chance of severe wind over 30 yrs
- 48.0%
Air-quality risk 1/10 · Minimal
- Unhealthy air days now
- 0 days/yr
- Unhealthy air days in 30 yrs
- 0 days/yr
Risk factors via First Street. Map © Google.
Why this score? — see what drove the C- grade
The composite is a weighted blend of 9 inputs, each scored 0–100. Each bar is that input's sub-score; the figure is the points it added to the 100-point composite (weight × sub-score).
- Cash flow +21.6/30.0
- ARV discount +7.5/15.0
- DSCR +6.9/10.0
- 1% rule +4.9/10.0
- Schools +3.0/10.0
- Livability +3.0/5.0
- Rent growth +2.5/5.0
- Condition / age +2.5/5.0
- Appreciation +0.0/10.0
$210,000
🖨 Deal sheet 📄 Offer letter ✓ Due diligence
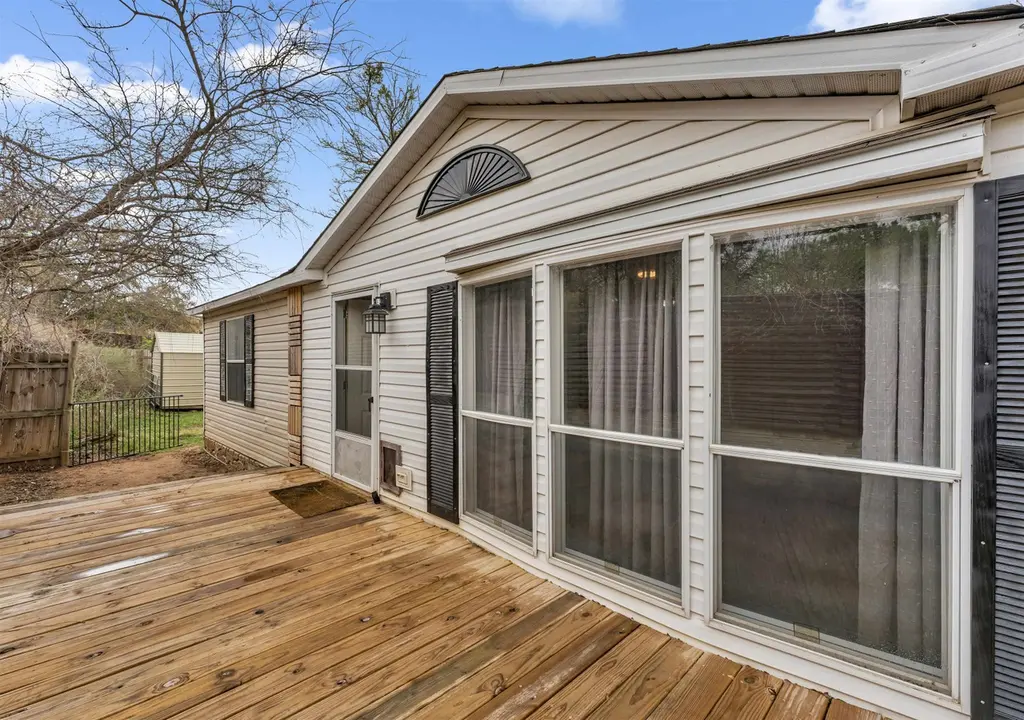
Listing remarks
Nice 3 bedroom 2 bath with bonus room. Split Bedroom plan. Huge back deck. Lot is . 43 acres with 5 yes 5 out buildings some with electricity. Neighborhood has Lake access. Just minutes form Kingsland or 20 minutes for "Big City" shopping in Marble Falls
Key facts
- Bonus room
- Huge back deck
- 5 out buildings
Tags
Property features AI
Finance
- Other: Lot roughly 0.45 acres with irregular dimensions (185 x 120 x 144 x 127); Located in Harwell Point subdivision; Directions: From 1431 turn CR 136A, 3rd driveway on right; entrance off 136A (mailbox shows street number on Wyatt)
Exterior
- Utilities: Private water source; Public sewer
- Home design: Manufactured home on land; Single-story
- Exterior features: Chain link and wood fencing
Interior
- Kitchen: Electric range; Refrigerator
- Flooring: Carpet; Vinyl
- Bathrooms: Two full bathrooms
- Heating & cooling: Central heating; Wall/window air conditioning units
- Interior features: Electric water heater; Carpet and vinyl flooring
- Laundry & utility: Washer hookup; Electric dryer hookup
Neighborhood map
What this means for you Summary
Snapshot
- This is a 3-bed/2.0-bath manufactured listed at $210k.
Deal economics
- At list price, monthly cash flow is $320 ($4k/yr) — positive.
- The deal already cash-flows at list — no discount required.
- To meet the 1% rule (rent ≥ 1% of price), the offer needs to be $209k (0.7% below list).
- Recommended offer: $207k (1.5% below list) — sets the bar for market timing.
Location & tenants
- Location reads 59/100 on livability (#1,161 in TX) — a working-class tenant base; expect higher turnover. Strengths: cost of living A+, housing A+; Watch: schools F, amenities F, commute F.
- Marble Falls ISD (town): math 32% / reading 38% proficiency, ranked #511 of 826 in TX (top 62%) — families likely to look elsewhere, expect single-tenant / working-renter base with shorter leases.
- Market conditions: 435 active listings in the ZIP; 2 comparable units currently listed for rent nearby; 891 units permitted in Burnet County in 2024 (76 in 5+ unit buildings).
- This rent runs 43% of the median local income ($58k/yr) — at the standard rent-burdened threshold; future hikes will face affordability resistance.
Forward outlook
- Local home prices are declining (-3.0%/yr); year-one equity from $1k of loan paydown is wiped out by about $6k of value loss. Plan a longer hold.
- Burnet County population projected at +22% by 2050 — long-run rental-demand tailwind backs the buy-and-hold thesis.
Negotiation context
- It's been on market 22 days — a 2% lower offer ($207k) is reasonable based on typical stale-listing flexibility.
Risks & watch-outs
- Climate carrying-cost: major wind risk, 48% chance of damaging wind over 30y; extreme-heat days projected 7→23/yr by 2055 (HVAC capex compounding) — expect insurance premiums to compound above CPI over the hold.
Questions for the listing agent
- Is there a deadline driving the sale (1031 exchange, divorce, estate, relocation)? That informs how much negotiation room exists.
- Schools are F-rated, which usually means shorter tenancies and higher turnover. Who's the typical renter profile here, and what's been the actual vacancy rate?
- What's the average days-on-market for RENTAL listings here right now (not sales)? A rising rental-DOM trend means longer vacancies and softer asking-rent achievability than the comps imply.
- What's the recent tenant-quality profile in this submarket — average credit score on applications, eviction rate, late-payment / NSF rate, and stable-employment percentage? A property-management company in the area should have these aggregated.
- How much new for-sale + rental construction is in the pipeline within 1–3 miles? Heavy new supply typically softens prices + rents 12–24 months out; constrained supply supports both.
Investment metrics
- 1% rule
- 0.99% ✗
- Cap rate
- 8.12%
- Cash-on-cash
- 6.53%
- DSCR
- 1.29
- GRM
- 8.4
CMA / ARV
- ARV (on-the-fly)
- $647,920
- Comps found
- 1
Show comp detail 1 sale within ~0.75 mi
| Address | Dist | Beds/Ba | Sqft | Sold | Price | $/sf | Match |
|---|---|---|---|---|---|---|---|
| 717 County Road 136b | 0.46mi | 3/2.0 | 1,672 (-8%) | 18mo | $595,000 | $356 | 50 |
Match score weights: distance 35% · size 25% · config 20% · recency 20%. Top-matched comps best support the ARV.
Projected returns pro-forma
-3.0% appreciation · 3.0% rent growth · sell at horizon
- IRR
- -6.3%
- Equity multiple
- 0.77×
- Total profit
- $-13,693
- Equity at exit
- $31,312
- IRR
- 3.3%
- Equity multiple
- 1.24×
- Total profit
- $14,137
- Equity at exit
- $18,157
Cash invested: $58,800 (down + closing). Projections, not guarantees.
Landlord ↔ Tenant lean methodology
- Overall (STATE)
- 87 Strongly Landlord-Friendly
- State Texas
- 87 Strongly Landlord-Friendly · R+5
- County
- — inherits STATE
- City
- — inherits STATE
ZIP-level market 78639
- Active inventory
- 435
- Price-to-rent
- 8.4×
Monthly cashflow live
- Estimated rent
- $2,085 medium interval (Pro) →
- Mortgage (P&I)
- −$1,101
- Tax from tax record
- −$139 /mo · $1,662/yr
- Insurance
- −$88
- HOA
- −$0
- Vacancy / Maint / Mgmt
- −$438
- Net cashflow
- $320
Break-even live
UW: 25.0% down · 7.5% · 30yr · 1.5% tax · 5.0% vac · 8.0% maint · 8.0% mgmt
Financing live
Cash to close
- Down payment
- $52,500
- Closing costs
- $6,300
- Reserves months
- —
- Total cash needed
- —
Loan-product check · same deal, 3 products live
Conventional
25% down · 7.5% · 30yr
- Down + closing
- —
- Monthly P&I
- —
- Monthly cashflow
- —
- DSCR
- —
- Eligible?
- —
Personal DTI + credit; lowest rate.
DSCR
20% down · 8.5% · 30yr
- Down + closing
- —
- Monthly P&I
- —
- Monthly cashflow
- —
- DSCR
- —
- Eligible?
- —
No personal income docs; deal must DSCR.
Hard money
10% down · 12.0% · 12mo
- Down + closing
- —
- Monthly P&I
- —
- Monthly cashflow
- —
- DSCR
- —
- Eligible?
- —
Short-term bridge; refi at stabilization.
Rent comps 2 comps
| Address | Beds | Baths | Sqft | Rent | $/sqft | DOM | Units | Dist |
|---|---|---|---|---|---|---|---|---|
| 352 Lookout Mtn Kingsland, TX | 3.0 | 2.0 | 1896 | $2,700 | $1.42 | 44d | 1 | 0.71mi |
| 1305 County Road 132B Unit B Kingsland, TX | 3.0 | 2.0 | 1410 | $1,800 | $1.28 | 2d | 1 | 1.45mi |
Listing history 15 events
-
2026-06-18days on market $210,000 Active 22 DOM
-
2026-06-17days on market $210,000 Active 21 DOM
-
2026-06-16days on market $210,000 Active 20 DOM
-
2026-06-15days on market $210,000 Active 19 DOM
-
2026-06-13days on market $210,000 Active 17 DOM
-
2026-06-13days on market $210,000 Active 16 DOM
-
2026-06-09days on market $210,000 Active 13 DOM
-
2026-06-08days on market $210,000 Active 12 DOM
-
2026-06-07days on market $210,000 Active 11 DOM
-
2026-06-05days on market $210,000 Active 8 DOM
-
2026-06-03days on market $210,000 Active 7 DOM
-
2026-06-02days on market $210,000 Active 6 DOM
-
2026-06-01days on market $210,000 Active 5 DOM
-
2026-05-31days on market $210,000 Active 4 DOM
-
2026-05-27$210,000 Active
ⓘ Source: listings_history table (triggers on properties + properties_extension) + one-shot
backfill from property_details.listing_events for pre-trigger history.
Tax reassessment forecast TX · Resets to sale price
- Current annual tax
- $1,662 · $139/mo
- Projected year-2 tax
- $3,843 · $320/mo
- Expected delta
- +$2,181/yr (+$182/mo · 131.2%)
ⓘ Screening estimate from a state-policy table — verify with the county assessor before closing.
Climate risk First Street
- Flood 1/10 Low FEMA zone X (unshaded) · 0% chance over 30 yrs
- Wildfire 4/10 Moderate
- Heat 8/10 Severe 7 d/yr ≥107°F today · 23 d/yr by 30 yrs out
- Wind 6/10 Major 48% chance of damaging wind over 30 yrs
- Air quality 1/10 Low 0 unhealthy d/yr today · 0 by 30 yrs out
Nearby sold comps map
Loading sold comps map…
Walkable amenities ~0.75 mi
Loading nearby amenities…
Taxation est. · year 1
- Rental income
- $25,022
- − Mortgage interest
- −$11,763
- − Property taxes
- −$1,662
- − Insurance
- −$1,050
- − Repairs & maintenance
- −$2,002
- − Management
- −$2,002
- − Depreciation
- −$6,109
- Taxable income
- $434
- Est. tax owed @ 24.0%
- −$104
- After-tax cash flow
- $3,736/yr
For passive investors: Depreciation is non-cash, so a rental often shows a tax loss while cash-flowing — sheltering income. Rental losses are passive: they offset passive income freely, and up to $25,000/yr can offset ordinary (W-2) income if you actively participate and your MAGI is under $100k (phasing out to $0 by $150k); unused losses carry forward. On sale, claimed depreciation is recaptured at up to 25%, and gains may owe capital-gains tax (a 1031 exchange can defer both). Figures are a year-1 estimate at your 24.0% rate — not tax advice; consult a CPA.
Schools (NCES district)
- District
- Marble Falls ISD
- NCES district ID
- 4829010
- Math proficiency
- 32% ▼ -8.00%
- Reading proficiency
- 38% ▼ -4.00%
- Median HH income
- $49,663
- Composite
- 30.3/100
- National rank
- #6278
- State rank
- #511 of 826 in TX
Livability — Kingsland
- Score
- 59/100
- State rank
- #1161
- US rank
- #20293
Category grades
Schools grade is shown separately in the Schools card above.
Census & demographics
- County
- Llano County · 16,310 people
- City population
- 8,719
- Metro
- nan
- Population (ZIP)
- 8,719
- Household income
- $57,742
- Rent vs Own
- Severe rent burden
- 202.0
Population outlook (Burnet County) Hauer SSP2
- Today (2025)
- 50,492 people
- By 2030
- 52,995 · +5.0%
- By 2040
- 57,528 · +13.9%
- By 2050
- 61,444 · +21.7%
- By 2075
- 71,098 · +40.8%
- By 2100
- 74,634 · +47.8%
Race, ethnicity, and origin ACS 2023
- Neighborhood character
- Predominantly White (73%)
- Race & ethnicity
- White 73% Hispanic / Latino 23% Two or more races 14% Black 1%
- Hispanic origin (detail)
- Mexican 19%
- Common ancestry
- Italian 4% Slovak 3% Serbian 3%
- Foreign-born
- 7% · Canada
- Languages at home
- 84% English-only · Spanish 15%
Political lean MEDSL · Burnet
- 2024 margin
- Solid R (+55.7) · D 21.7% · R 77.4%
- 2008→2024 swing
- -11.6pp toward R · 2008: -44.1pp · 2024: -55.7pp
- All cycles
- 2024: R+55.7 2020: R+53.1 2016: R+56.8 2012: R+54.6 2008: R+44.1
Not yet ingested
- Civics
- —
Market trends
- HPI YoY
- ▼ -123.30%
- Current HPI
- 219.8651
- Rent YoY
- —
- Metro
- nan
- State GDP YoY
- ▲ 3.95%
- F500 in state
- 110
Industry mix (Fortune 500 HQ in TX)
| Industry | F500 HQs | Revenue |
|---|---|---|
| Energy | 16 | $1,198B |
|
||
| Technology | 5 | $198B |
|
||
| Engineering / Construction | 4 | $72B |
|
||
| Energy Services | 3 | $60B |
|
||
| Utilities | 3 | $41B |
|
||
| Healthcare | 2 | $330B |
|
||
Price history
1 event — show timeline
- 2026-05-27 Listed $210,000 HLMLS as distributed by MLS GRID
Property tax history
+5.0%/yrLatest (2026): $1,662 · +6.6% YoY. Source: county tax records.
Cash-flow waterfall
monthlySold comps — $/sqft
last 12 mo · ≤1 miLoading sold comps…