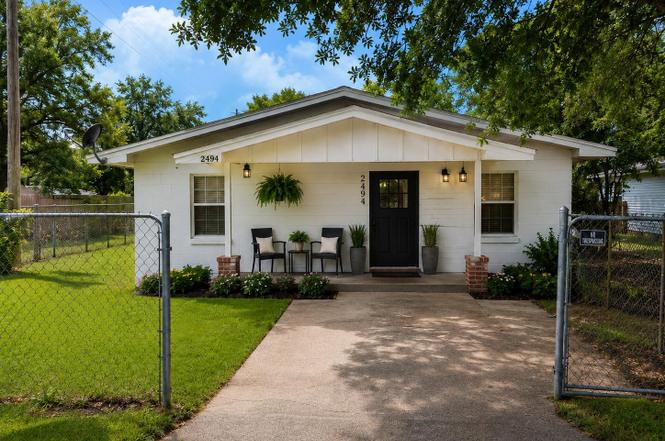
2494 Holton St · Tallahassee, FL
Flood risk 1/10 · Minimal
- FEMA flood zone
- X (unshaded)
- Chance of flooding over 30 yrs
- 0.0%
- Est. flood insurance / yr
- $507 – $1,088
Fire risk 3/10 · Minor
- Est. fire insurance / yr
- $947 – $1,759
Heat risk 8/10 · Major
- Hot days now (above 108°F)
- 7 days/yr
- Hot days in 30 yrs
- 20 days/yr
Wind risk 9/10 · Severe
- Chance of severe wind over 30 yrs
- 99.0%
Air-quality risk 4/10 · Minor
- Unhealthy air days now
- 5 days/yr
- Unhealthy air days in 30 yrs
- 6 days/yr
Risk factors via First Street. Map © Google.
Why this score? — see what drove the B grade
The composite is a weighted blend of 9 inputs, each scored 0–100. Each bar is that input's sub-score; the figure is the points it added to the 100-point composite (weight × sub-score).
- Cash flow +24.8/30.0
- ARV discount +15.0/15.0
- DSCR +8.0/10.0
- 1% rule +6.3/10.0
- Appreciation +4.7/10.0
- Schools +4.3/10.0
- Livability +4.3/5.0
- Rent growth +2.5/5.0
- Condition / age +2.5/5.0
$170,000
🖨 Deal sheet (PDF) 📄 Offer letter ✓ Due diligence
Listing remarks MLS
This block ranch home on corner lot would make a great starter or rental. 4 bedrooms and 2 full bathrooms, open floor plan, fenced yard, big inside laundry,
Key facts
- 2024 water heater
- 2022 roof
- 4,791 sq ft lot
Tags
Property features AI
Finance
- Other: Property listed for sale
Exterior
- Parking: Driveway
- Security: Fenced property
- Utilities: Electric heating and cooling
- Home design: Single-story; Block and concrete construction
- Construction: Block construction; Concrete construction
- Exterior features: Fully fenced yard; Publicly maintained road access
Interior
- Kitchen: Refrigerator; Stove
- Bedrooms: Bedroom 2 (12x12); Bedroom 3 (12x10); Bedroom 4 (12x10)
- Flooring: Tile flooring
- Bathrooms: 2 full bathrooms
- Heating & cooling: Central heating (electric); Central air conditioning (electric)
- Interior features: Utility room; Living room; Family room; Dining room
- Laundry & utility: Utility room (laundry/utility space)
Neighborhood map
What this means for you Summary
Snapshot
- This is a 4-bed/2.0-bath single-family listed at $170k.
Deal economics
- At list price, monthly cash flow is $359 ($4k/yr) — positive.
- The deal already cash-flows at list — no discount required.
- Meets the 1% rule at list price ($2k rent vs $170k).
- Cap rate 8.8% vs local median 4.2% in Tallahassee — top-decile yield for the area; either an underpriced asset or a hidden risk that comps aren't pricing in. Stress-test before assuming the spread holds.
Location & tenants
- Location reads 86/100 on livability (#19 in FL, #429 nationally) — a professional / high-income tenant draw. Strengths: amenities A+, commute A+, health & safety A+; Watch: employment D.
- Leon (urban): math 48% / reading 53% proficiency, ranked #33 of 73 in FL (top 45%) — acceptable for families but not a draw, mixed tenant base, ~2y average lease.
- Market conditions: 94 active listings in the ZIP; 11 comparable units currently listed for rent nearby; rentals at typical pace (median 22d on market — plan ~3-4 weeks tenant-placement turnaround); lower-income renter base — watch delinquency; 1,765 units permitted in Leon County in 2024 (975 in 5+ unit buildings).
- At $1,920/mo this rent would consume 60% of the median local household income ($38k/yr) (locally 1272% of renters already pay >50% of income on rent) — very limited rent-growth headroom before tenants either downsize or default.
Forward outlook
- In year one you build about $255 of equity ($1k loan paydown + $-920 appreciation (-0.5% local appreciation)).
- Leon County population projected at +23% by 2050 — long-run rental-demand tailwind backs the buy-and-hold thesis.
- At projected returns (-0.5% appreciation + 3.0% rent growth), your $48k cash investment doubles in ~8 years — after that, you're playing with house money.
Negotiation context
- Only 1 days on market — expect competitive offers; lowballing is unlikely to land.
- 2 sale attempts since 12y ago with the ask held roughly flat each time — persistent listings suggest the price (not the market) is what's stuck; bring a comps-based counter.
- Current owner paid $30k; list at $170k implies a 467% gain — meaningful room to come down on a strong offer.
Risks & watch-outs
- Climate carrying-cost: severe wind risk, 99% chance of damaging wind over 30y; extreme-heat days projected 7→20/yr by 2055 (HVAC capex compounding) — expect insurance premiums to compound above CPI over the hold.
Questions for the listing agent
- Is there a deadline driving the sale (1031 exchange, divorce, estate, relocation)? That informs how much negotiation room exists.
- Schools are B-rated — typically a magnet for longer-tenancy family renters. What's the average tenant stay here, and is there a school-zone premium baked into asking?
- What's the average days-on-market for RENTAL listings here right now (not sales)? A rising rental-DOM trend means longer vacancies and softer asking-rent achievability than the comps imply.
- What's the recent tenant-quality profile in this submarket — average credit score on applications, eviction rate, late-payment / NSF rate, and stable-employment percentage? A property-management company in the area should have these aggregated.
- How much new for-sale + rental construction is in the pipeline within 1–3 miles? Heavy new supply typically softens prices + rents 12–24 months out; constrained supply supports both.
Investment metrics
- 1% rule
- 1.13% ✓
- Cap rate
- 8.83%
- Cash-on-cash
- 9.05%
- DSCR
- 1.40
- GRM
- 7.4
CMA / ARV
- ARV (on-the-fly)
- $272,580
- Comps found
- 10
Show comp detail 10 sales within ~0.75 mi
| Address | Dist | Beds/Ba | Sqft | Sold | Price | $/sf | Match |
|---|---|---|---|---|---|---|---|
| 2800 Walnut St | 0.35mi | 3/2.0 (-1) | 1,483 (-4%) | 6mo | $220,000 | $148 | 68 |
| 2032 Warwick St | 0.60mi | 3/2.0 (-1) | 1,574 (+2%) | 2mo | $180,000 | $114 | 62 |
| 2207 Holton St | 0.21mi | 3/2.0 (-1) | 1,328 (-14%) | 14mo | $250,000 | $188 | 51 |
| 509 Emory Ct | 0.65mi | 3/2.0 (-1) | 1,543 (+0%) | 18mo | $165,000 | $107 | 50 |
| 3113 Rackley Dr | 0.72mi | 3/1.5 (-1) | 1,482 (-4%) | 9mo | $150,000 | $101 | 45 |
| 2205 Holton St | 0.22mi | 3/2.0 (-1) | 1,328 (-14%) | 22mo | $260,000 | $196 | 44 |
| 516 Famcee Ave | 0.34mi | 3/2.0 (-1) | 1,328 (-14%) | 18mo | $274,900 | $207 | 42 |
| 703 Osceola St | 0.37mi | 3/2.0 (-1) | 1,746 (+13%) | 18mo | $179,000 | $103 | 40 |
| 621 Brookridge Dr | 0.69mi | 3/2.0 (-1) | 1,442 (-6%) | 19mo | $255,500 | $177 | 36 |
| 1421 Callen St | 0.74mi | 3/2.0 (-1) | 1,645 (+7%) | 20mo | $358,000 | $218 | 32 |
Match score weights: distance 35% · size 25% · config 20% · recency 20%. Top-matched comps best support the ARV.
Projected returns pro-forma
-0.54% appreciation · 3.0% rent growth · sell at horizon
- IRR
- 6.2%
- Equity multiple
- 1.29×
- Total profit
- $13,638
- Equity at exit
- $44,812
- IRR
- 12.0%
- Equity multiple
- 2.24×
- Total profit
- $58,987
- Equity at exit
- $50,357
Cash invested: $47,600 (down + closing). Projections, not guarantees.
Landlord ↔ Tenant lean methodology
- Overall (STATE)
- 87 Strongly Landlord-Friendly
- State Florida
- 87 Strongly Landlord-Friendly · R+3
- County
- — inherits STATE
- City
- — inherits STATE
ZIP-level market 32310
- Home prices YoY
- -0.2%
- Active inventory
- 94
- Price-to-rent
- 7.4×
Monthly cashflow live
- Estimated rent
- $1,920 high interval (Pro) →
- Mortgage (P&I)
- −$891
- Tax from tax record
- −$195 /mo · $2,345/yr
- Insurance
- −$71
- HOA
- −$0
- Vacancy / Maint / Mgmt
- −$403
- Net cashflow
- $359
Break-even live
Sensitivity live
| Price | -10% $455 | -5% $407 | +0% $359 | +5% $311 | +10% $263 |
|---|---|---|---|---|---|
| Rent | -10% $207 | -5% $283 | +0% $359 | +5% $435 | +10% $511 |
| Rate | -1.0pp $445 | -0.5pp $402 | base $359 | +0.5pp $315 | +1.0pp $270 |
UW: 25.0% down · 7.5% · 30yr · 1.5% tax · 5.0% vac · 8.0% maint · 8.0% mgmt
Financing live
Cash to close
- Down payment
- $42,500
- Closing costs
- $5,100
- Reserves months
- —
- Total cash needed
- —
Loan-product check · same deal, 3 products live
Conventional
25% down · 7.5% · 30yr
- Down + closing
- —
- Monthly P&I
- —
- Monthly cashflow
- —
- DSCR
- —
- Eligible?
- —
Personal DTI + credit; lowest rate.
DSCR
20% down · 8.5% · 30yr
- Down + closing
- —
- Monthly P&I
- —
- Monthly cashflow
- —
- DSCR
- —
- Eligible?
- —
No personal income docs; deal must DSCR.
Hard money
10% down · 12.0% · 12mo
- Down + closing
- —
- Monthly P&I
- —
- Monthly cashflow
- —
- DSCR
- —
- Eligible?
- —
Short-term bridge; refi at stabilization.
Rent comps 11 comps
| Address | Beds | Baths | Sqft | Rent | $/sqft | DOM | Units | Dist |
|---|---|---|---|---|---|---|---|---|
| 509 Famcee Ave Tallahassee, FL | 3.0 | 2.0 | 1079 | $1,700 | $1.58 | 22d | 1 | 0.34mi |
| 3111 Rackley Dr Tallahassee, FL | 4.0 | 2.5 | 1802 | $3,800 | $2.11 | 22d | 1 | 0.68mi |
| 1240 Levy Ave Tallahassee, FL | 3.0 | 1.0 | 1290 | $1,350 | $1.05 | 22d | 1 | 0.72mi |
| 3000 S Adams St Tallahassee, FL | 1.0–3.0 | 1.0–3.0 | 884 | $1,850 | $2.09 | 22d | 8 | 0.84mi |
| 2506 Sir Williams St Tallahassee, FL | 3.0 | 2.0 | 1662 | $2,050 | $1.23 | 22d | 1 | 0.88mi |
| 1315 Pinellas St Tallahassee, FL | 3.0 | 3.0 | 1197 | $1,450 | $1.21 | 22d | 1 | 0.98mi |
| 402 Perkins St Tallahassee, FL | 4.0 | 2.0 | 1686 | $1,850 | $1.10 | 22d | 1 | 1.16mi |
| 418 Perkins St Tallahassee, FL | 4.0 | 2.0 | 1497 | $1,850 | $1.24 | 22d | 1 | 1.19mi |
| 1615 Sharkey St Tallahassee, FL | 4.0 | 2.0 | 1278 | $1,600 | $1.25 | 22d | 1 | 1.26mi |
| 1327 Jackson Bluff Rd Tallahassee, FL | 2.0–4.0 | 2.0 | 1450 | $895 | $0.62 | 22d | 1 | 1.36mi |
| 735 Putnam Dr #2 Tallahassee, FL | 3.0 | 2.5 | 1396 | $1,650 | $1.18 | 14d | 1 | 1.45mi |
Listing history 2 events
-
2026-06-18remarks 693-char remark
-
2026-06-18$170,000 Active 1 DOM
ⓘ Source: listings_history table (triggers on properties + properties_extension) + one-shot
backfill from property_details.listing_events for pre-trigger history.
Tax reassessment forecast FL · Resets to sale price
- Current annual tax
- $2,345 · $195/mo
- Projected year-2 tax
- $2,345 · $195/mo
- Expected delta
- $0/yr ($0/mo · 0.0%)
ⓘ Screening estimate from a state-policy table — verify with the county assessor before closing.
Climate risk First Street
- Flood 1/10 Low FEMA zone X (unshaded) · 0% chance over 30 yrs
- Wildfire 3/10 Moderate
- Heat 8/10 Severe 7 d/yr ≥108°F today · 20 d/yr by 30 yrs out
- Wind 9/10 Extreme 99% chance of damaging wind over 30 yrs
- Air quality 4/10 Moderate 5 unhealthy d/yr today · 6 by 30 yrs out
Nearby sold comps map
Loading sold comps map…
Walkable amenities ~0.75 mi
Loading nearby amenities…
Taxation est. · year 1
- Rental income
- $23,040
- − Mortgage interest
- −$9,523
- − Property taxes
- −$2,345
- − Insurance
- −$850
- − Repairs & maintenance
- −$1,843
- − Management
- −$1,843
- − Depreciation
- −$4,945
- Taxable income
- $1,691
- Est. tax owed @ 24.0%
- −$406
- After-tax cash flow
- $3,903/yr
For passive investors: Depreciation is non-cash, so a rental often shows a tax loss while cash-flowing — sheltering income. Rental losses are passive: they offset passive income freely, and up to $25,000/yr can offset ordinary (W-2) income if you actively participate and your MAGI is under $100k (phasing out to $0 by $150k); unused losses carry forward. On sale, claimed depreciation is recaptured at up to 25%, and gains may owe capital-gains tax (a 1031 exchange can defer both). Figures are a year-1 estimate at your 24.0% rate — not tax advice; consult a CPA.
Schools (NCES district)
- District
- Leon
- NCES district ID
- 1201110
- Math proficiency
- 48% ▼ -13.00%
- Reading proficiency
- 53% ▼ -5.00%
- Median HH income
- $46,339
- Composite
- 42.84/100
- National rank
- #3131
- State rank
- #33 of 73 in FL
Livability — Tallahassee
- Score
- 86/100
- State rank
- #19
- US rank
- #429
Category grades
Schools grade is shown separately in the Schools card above.
Census & demographics
- Census place
- Tallahassee, FL
- County
- Leon County · 294,472 people
- City population
- 294,472
- Metro
- Tallahassee, FL
- Population (ZIP)
- 14,888
- Household income
- $38,288
- Rent vs Own
- Severe rent burden
- 1272.0
Population outlook (Leon County) Hauer SSP2
- Today (2025)
- 315,507 people
- By 2030
- 330,677 · +4.8%
- By 2040
- 358,465 · +13.6%
- By 2050
- 386,804 · +22.6%
- By 2075
- 465,480 · +47.5%
- By 2100
- 519,959 · +64.8%
Race, ethnicity, and origin ACS 2023
- Neighborhood character
- Diverse neighborhood (Simpson 0.61)
- Race & ethnicity
- Black 50% White 36% Hispanic / Latino 9% Two or more races 5%
- Hispanic origin (detail)
- Mexican 3%
- Common ancestry
- Italian 1% Lithuanian 1% Slovak 1%
- Foreign-born
- 4% · Canada
- Languages at home
- 92% English-only · Spanish 6% French/Haitian/Cajun 1% German/W. Germanic 1%
Political lean MEDSL · Leon
- 2024 margin
- Strong D (+21.8) · D 60.3% · R 38.5% · Other 1.2%
- 2008→2024 swing
- -2.5pp toward R · 2008: 24.3pp · 2024: 21.8pp
- All cycles
- 2024: D+21.8 2020: D+28.3 2016: D+25.1 2012: D+23.6 2008: D+24.3
Not yet ingested
- Civics
- —
Market trends
- HPI YoY
- ▼ -0.54%
- Current HPI
- 270.5721
- Rent YoY
- —
- Metro
- Tallahassee, FL
- State GDP YoY
- ▲ 3.28%
- F500 in state
- 36
Industry mix (Fortune 500 HQ in FL)
| Industry | F500 HQs | Revenue |
|---|---|---|
| Industrial Technology | 2 | $29B |
|
||
| Insurance | 2 | $17B |
|
||
| Retail | 1 | $60B |
|
||
| Technology Distribution | 1 | $58B |
|
||
| Homebuilding | 1 | $35B |
|
||
| Technology Manufacturing | 1 | $35B |
|
||
Price history
+1033.3% since first listed6 events — show timeline
- 2026-06-15 Listed $170,000 CATRS
- 2015-05-19 Sold (MLS) $30,000 CATRS
- 2014-11-20 Listed $30,000 CATRS
- 1998-09-24 Sold (Public Records) $44,000 Public Records
- 1998-09-24 Sold (Public Records) $44,000 Public Records
- 1996-01-04 Sold (Public Records) $15,000 Public Records
Property tax history
+5.7%/yrLatest (2025): $2,345 · +8.1% YoY. Source: county tax records.
Cash-flow waterfall
monthlySold comps — $/sqft
last 12 mo · ≤1 miLoading sold comps…