2408 Post Oak Rd · Rockdale, TX
Flood risk 1/10 · Minimal
- FEMA flood zone
- X
- Chance of flooding over 30 yrs
- 0.0%
- Est. flood insurance / yr
- $507 – $1,088
Fire risk 3/10 · Minor
- Est. fire insurance / yr
- $1,222 – $2,270
Heat risk 8/10 · Major
- Hot days now (above 109°F)
- 7 days/yr
- Hot days in 30 yrs
- 24 days/yr
Wind risk 8/10 · Major
- Chance of severe wind over 30 yrs
- 80.0%
Air-quality risk 1/10 · Minimal
- Unhealthy air days now
- 0 days/yr
- Unhealthy air days in 30 yrs
- 0 days/yr
Risk factors via First Street. Map © Google.
Why this score? — see what drove the B- grade
The composite is a weighted blend of 9 inputs, each scored 0–100. Each bar is that input's sub-score; the figure is the points it added to the 100-point composite (weight × sub-score).
- Cash flow +30.0/30.0
- 1% rule +10.0/10.0
- DSCR +10.0/10.0
- ARV discount +7.5/15.0
- Schools +3.5/10.0
- Livability +3.0/5.0
- Rent growth +2.5/5.0
- Condition / age +2.5/5.0
- Appreciation +0.0/10.0
$130,000
🖨 Deal sheet 📄 Offer letter ✓ Due diligence
Listing remarks
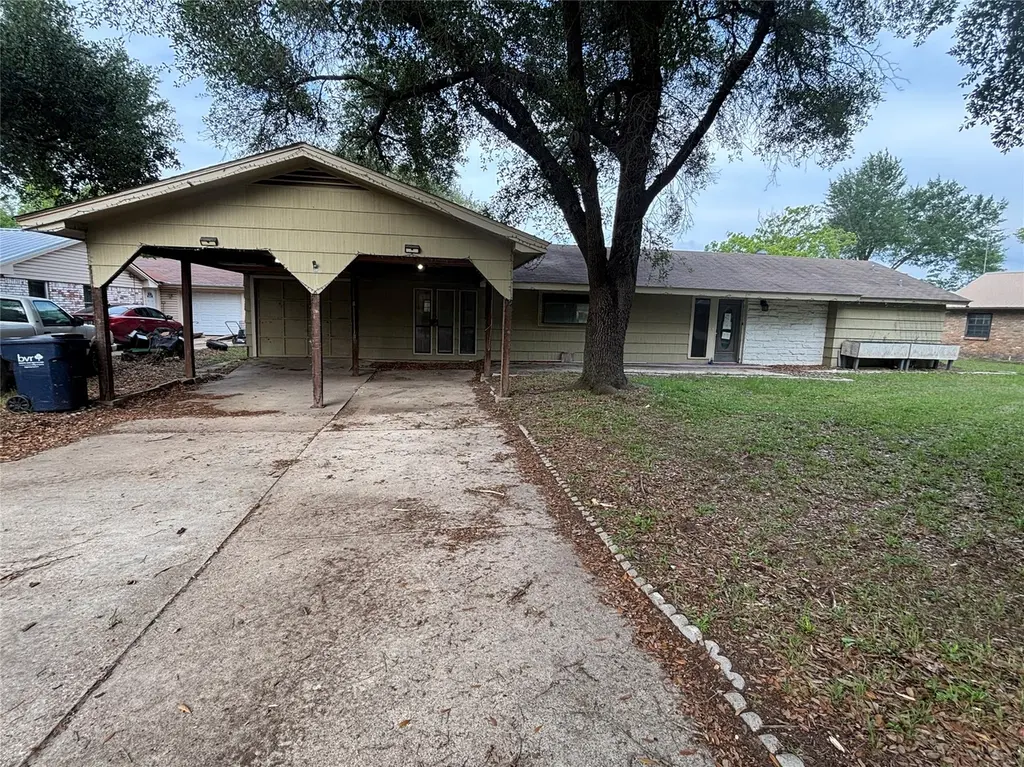
Three bedroom 2 bath home with large fenced back yard in a quaint town. Large covered patio perfect for entertaining. Storage building in the back. Close to Samsung Plant and about an hour from Austin.
Key facts
- Fenced back yard
- Storage building
- Covered patio
Tags
Property features AI
Exterior
- Parking: Carport; 2 total parking spaces
- Utilities: Electricity connected; Natural gas connected; Public sewer; Public water
- Home design: Single-story home; Faces west; Resale property
- Construction: Vinyl siding; Composition roof; Slab foundation; Year built per public records
- Exterior features: Covered patio; Patio; Outbuilding/storage; Wood fencing
Interior
- Kitchen: Breakfast bar; Laminate counters
- Bedrooms: 3 bedrooms on the main level
- Flooring: Laminate; Vinyl; Wood
- Bathrooms: 2 full bathrooms
- Heating & cooling: Central heating; Central air conditioning
- Interior features: Breakfast bar; Laminate counters; Main-level primary bedroom; Fireplace in family room
- Laundry & utility: Laundry inside
Neighborhood map
What this means for you Summary
Snapshot
- This is a 3-bed/2.0-bath single-family listed at $130k.
Deal economics
- At list price, monthly cash flow is $683 ($8k/yr) — positive.
- The deal already cash-flows at list — no discount required.
- Meets the 1% rule at list price ($2k rent vs $130k).
- Recommended offer: $126k (3.0% below list) — sets the bar for market timing.
- Cap rate 12.6% vs local median 3.6% in Rockdale — top-decile yield for the area; either an underpriced asset or a hidden risk that comps aren't pricing in. Stress-test before assuming the spread holds.
Location & tenants
- Location reads 60/100 on livability (#1,040 in TX) — a middle-class / working-renter tenant base. Strengths: cost of living A+, housing A+; Watch: schools D, crime F, amenities F.
- Rockdale ISD (town): math 40% / reading 43% proficiency, ranked #395 of 826 in TX (top 48%) — families likely to look elsewhere, expect single-tenant / working-renter base with shorter leases; 63% free/reduced lunch — lower-income household profile, screen leases tightly.
- Market conditions: 161 active listings in the ZIP; 1 comparable units currently listed for rent nearby; 77 units permitted in Milam County in 2024 (0 in 5+ unit buildings).
Forward outlook
- Local home prices are declining (-3.0%/yr); year-one equity from $899 of loan paydown is wiped out by about $4k of value loss. Plan a longer hold.
- Milam County population projected to shrink 9% by 2050 — rents likely to lag national; underwrite the cash flow, not the appreciation.
- At projected returns (-3.0% appreciation + 3.0% rent growth), your $36k cash investment doubles in ~6 years — after that, you're playing with house money.
Negotiation context
- It's been on market 44 days — a 3% lower offer ($126k) is reasonable based on typical stale-listing flexibility.
- 5 sale attempts since 15y ago; this cycle's ask has dropped $10k (7%) from the opening price — seller is motivated, your offer sets the floor, not the list.
Risks & watch-outs
- Watch-outs: property tax is 3.6% of price; built in 1953 — expect roof / HVAC / electrical / plumbing capex.
- Climate carrying-cost: severe wind risk, 80% chance of damaging wind over 30y; extreme-heat days projected 7→24/yr by 2055 (HVAC capex compounding) — expect insurance premiums to compound above CPI over the hold.
Questions for the listing agent
- It's been on market 44 days. Have you received any prior offers? Is the seller open to a 3% concession, seller financing, or rate buy-down credit?
- Built in 1953 — when were the roof, HVAC, electrical panel, plumbing, and water heater last replaced?
- Property tax is high relative to price — has the assessment been appealed recently, and will the sale trigger a re-assessment?
- Is there a deadline driving the sale (1031 exchange, divorce, estate, relocation)? That informs how much negotiation room exists.
- Schools are D-rated, which usually means shorter tenancies and higher turnover. Who's the typical renter profile here, and what's been the actual vacancy rate?
- Crime grade is F in this area — have there been break-ins, vandalism, or insurance claims at this property in the last 3 years? What carrier currently insures it and at what premium?
- What's the average days-on-market for RENTAL listings here right now (not sales)? A rising rental-DOM trend means longer vacancies and softer asking-rent achievability than the comps imply.
- What's the recent tenant-quality profile in this submarket — average credit score on applications, eviction rate, late-payment / NSF rate, and stable-employment percentage? A property-management company in the area should have these aggregated.
- How much new for-sale + rental construction is in the pipeline within 1–3 miles? Heavy new supply typically softens prices + rents 12–24 months out; constrained supply supports both.
Investment metrics
- 1% rule
- 1.77% ✓
- Cap rate
- 12.60%
- Cash-on-cash
- 22.53%
- DSCR
- 2.00
- GRM
- 4.7
CMA / ARV
- ARV (median comp)
- $270,144
- List price
- $130,000
- Delta
- -51.88%
- Verdict
- UNDERPRICED
- Comps
- 20 within 1.0 mi
Show comp detail 11 sales within ~0.75 mi
| Address | Dist | Beds/Ba | Sqft | Sold | Price | $/sf | Match |
|---|---|---|---|---|---|---|---|
| 2102 Vogel Ave | 0.27mi | 4/2.0 (+1) | 1,816 (-1%) | 13mo | $244,900 | $135 | 69 |
| 2206 N Murray Ave | 0.20mi | 3/2.0 | 1,613 (-12%) | 3mo | $255,000 | $158 | 68 |
| 2205 Murray Ave | 0.18mi | 3/2.0 | 1,635 (-11%) | 13mo | $310,000 | $190 | 62 |
| 2112 Vogel Ave | 0.21mi | 4/2.0 (+1) | 1,691 (-8%) | 13mo | $245,000 | $145 | 61 |
| 401 San Jacinto Rd | 0.05mi | 3/2.0 | 1,575 (-14%) | 17mo | $169,900 | $108 | 60 |
| 2203 Murray Ave | 0.20mi | 4/2.0 (+1) | 1,989 (+8%) | 15mo | $279,999 | $141 | 60 |
| 718 Brazos St | 0.54mi | 3/2.0 | 1,886 (+3%) | 13mo | $199,000 | $106 | 59 |
| 707 Palmer St | 0.58mi | 3/2.0 | 1,730 (-6%) | 13mo | $320,000 | $185 | 52 |
| 1903 Skyles Rd | 0.71mi | 3/2.0 | 1,706 (-7%) | 6mo | $310,000 | $182 | 50 |
| 709 Coffield St | 0.64mi | 3/2.0 | 1,602 (-13%) | 17mo | $290,000 | $181 | 35 |
| 1700 O'kelley Rd | 0.68mi | 3/2.0 | 1,573 (-14%) | 19mo | $249,000 | $158 | 28 |
Match score weights: distance 35% · size 25% · config 20% · recency 20%. Top-matched comps best support the ARV.
Projected returns pro-forma
-3.0% appreciation · 3.0% rent growth · sell at horizon
- IRR
- 15.5%
- Equity multiple
- 1.62×
- Total profit
- $22,635
- Equity at exit
- $19,383
- IRR
- 24.2%
- Equity multiple
- 3.10×
- Total profit
- $76,471
- Equity at exit
- $11,240
Cash invested: $36,400 (down + closing). Projections, not guarantees.
Landlord ↔ Tenant lean methodology
- Overall (STATE)
- 87 Strongly Landlord-Friendly
- State Texas
- 87 Strongly Landlord-Friendly · R+5
- County
- — inherits STATE
- City
- — inherits STATE
ZIP-level market 76567
- Home prices YoY
- -12.9%
- Active inventory
- 161
- Price-to-rent
- 4.7×
Monthly cashflow live
- Estimated rent
- $2,295 medium interval (Pro) →
- Mortgage (P&I)
- −$682
- Tax from tax record
- −$394 /mo · $4,726/yr
- Insurance
- −$54
- HOA
- −$0
- Vacancy / Maint / Mgmt
- −$482
- Net cashflow
- $683
Break-even live
UW: 25.0% down · 7.5% · 30yr · 1.5% tax · 5.0% vac · 8.0% maint · 8.0% mgmt
Financing live
Cash to close
- Down payment
- $32,500
- Closing costs
- $3,900
- Reserves months
- —
- Total cash needed
- —
Loan-product check · same deal, 3 products live
Conventional
25% down · 7.5% · 30yr
- Down + closing
- —
- Monthly P&I
- —
- Monthly cashflow
- —
- DSCR
- —
- Eligible?
- —
Personal DTI + credit; lowest rate.
DSCR
20% down · 8.5% · 30yr
- Down + closing
- —
- Monthly P&I
- —
- Monthly cashflow
- —
- DSCR
- —
- Eligible?
- —
No personal income docs; deal must DSCR.
Hard money
10% down · 12.0% · 12mo
- Down + closing
- —
- Monthly P&I
- —
- Monthly cashflow
- —
- DSCR
- —
- Eligible?
- —
Short-term bridge; refi at stabilization.
Rent comps 1 comps
| Address | Beds | Baths | Sqft | Rent | $/sqft | DOM | Units | Dist |
|---|---|---|---|---|---|---|---|---|
| 1602 Yokley Rd Rockdale, TX | 3.0 | 2.5 | 2549 | $2,295 | $0.90 | 43d | 1 | 0.87mi |
Listing history 27 events
-
2026-06-18days on market $130,000 Active 44 DOM
-
2026-06-17days on market $130,000 Active 43 DOM
-
2026-06-16days on market $130,000 Active 42 DOM
-
2026-06-15days on market $130,000 Active 41 DOM
-
2026-06-15days on market $130,000 Active 40 DOM
-
2026-06-13days on market $130,000 Active 39 DOM
-
2026-06-12days on market $130,000 Active 38 DOM
-
2026-06-09pricedays on market $130,000 Active 35 DOM
-
2026-06-08days on market $140,000 Active 34 DOM
-
2026-06-08days on market $140,000 Active 33 DOM
-
2026-06-07days on market $140,000 Active 32 DOM
-
2026-06-03days on market $140,000 Active 29 DOM
-
2026-06-02days on market $140,000 Active 28 DOM
-
2026-06-01days on market $140,000 Active 27 DOM
-
2026-05-31days on market $140,000 Active 26 DOM
-
2026-05-05$140,000 Active 201-char remark
-
2026-01-23soldstatus
-
2024-05-13Active
-
2024-04-08price
-
2024-02-12Active
-
2017-06-20soldstatus
-
2017-06-16soldstatus
-
2016-09-06$153,000
-
2011-12-06soldstatus
-
2011-04-15$55,769
-
2007-08-31soldstatus
-
2002-05-31soldstatus
ⓘ Source: listings_history table (triggers on properties + properties_extension) + one-shot
backfill from property_details.listing_events for pre-trigger history.
Tax reassessment forecast TX · Resets to sale price
- Current annual tax
- $4,726 · $394/mo
- Projected year-2 tax
- $4,726 · $394/mo
- Expected delta
- $0/yr ($0/mo · 0.0%)
ⓘ Screening estimate from a state-policy table — verify with the county assessor before closing.
Climate risk First Street
- Flood 1/10 Low FEMA zone X · 0% chance over 30 yrs
- Wildfire 3/10 Moderate
- Heat 8/10 Severe 7 d/yr ≥109°F today · 24 d/yr by 30 yrs out
- Wind 8/10 Severe 80% chance of damaging wind over 30 yrs
- Air quality 1/10 Low 0 unhealthy d/yr today · 0 by 30 yrs out
Nearby sold comps map
Loading sold comps map…
Walkable amenities ~0.75 mi
Loading nearby amenities…
Taxation est. · year 1
- Rental income
- $27,540
- − Mortgage interest
- −$7,282
- − Property taxes
- −$4,726
- − Insurance
- −$650
- − Repairs & maintenance
- −$2,203
- − Management
- −$2,203
- − Depreciation
- −$3,782
- Taxable income
- $6,694
- Est. tax owed @ 24.0%
- −$1,607
- After-tax cash flow
- $6,594/yr
For passive investors: Depreciation is non-cash, so a rental often shows a tax loss while cash-flowing — sheltering income. Rental losses are passive: they offset passive income freely, and up to $25,000/yr can offset ordinary (W-2) income if you actively participate and your MAGI is under $100k (phasing out to $0 by $150k); unused losses carry forward. On sale, claimed depreciation is recaptured at up to 25%, and gains may owe capital-gains tax (a 1031 exchange can defer both). Figures are a year-1 estimate at your 24.0% rate — not tax advice; consult a CPA.
Schools (NCES district)
- District
- Rockdale ISD
- NCES district ID
- 4837590
- Math proficiency
- 40% ▼ -1.00%
- Reading proficiency
- 43% ▬ 0.00%
- Median HH income
- $38,586
- Composite
- 34.64/100
- National rank
- #5147
- State rank
- #395 of 826 in TX
Livability — Rockdale
- Score
- 60/100
- State rank
- #1040
- US rank
- #18508
Category grades
Schools grade is shown separately in the Schools card above.
Census & demographics
- Census place
- Rockdale, TX
- Population (ZIP)
- 8,457
Population outlook (Milam County) Hauer SSP2
- Today (2025)
- 24,051 people
- By 2030
- 23,613 · -1.8%
- By 2040
- 22,693 · -5.6%
- By 2050
- 21,879 · -9.0%
- By 2075
- 20,974 · -12.8%
- By 2100
- 19,414 · -19.3%
Race, ethnicity, and origin ACS 2023
- Neighborhood character
- Majority White (63%)
- Race & ethnicity
- White 63% Hispanic / Latino 30% Two or more races 11% Black 5%
- Hispanic origin (detail)
- Mexican 25% Puerto Rican 2%
- Common ancestry
- Slovak 2% Lithuanian 2% Serbian 1%
- Foreign-born
- 11% · Canada, Jamaica
- Languages at home
- 78% English-only · Spanish 21% Korean 1%
Political lean MEDSL · Milam
- 2024 margin
- Solid R (+57.3) · D 21.0% · R 78.3%
- 2008→2024 swing
- -31.3pp toward R · 2008: -26.0pp · 2024: -57.3pp
- All cycles
- 2024: R+57.3 2020: R+51.9 2016: R+49.9 2012: R+34.6 2008: R+26.0
Not yet ingested
- Civics
- —
Market trends
- HPI YoY
- ▼ -32.12%
- Current HPI
- 217.5536
- Rent YoY
- —
- Metro
- —
- State GDP YoY
- ▲ 3.95%
- F500 in state
- 110
Industry mix (Fortune 500 HQ in TX)
| Industry | F500 HQs | Revenue |
|---|---|---|
| Energy | 16 | $1,198B |
|
||
| Technology | 5 | $198B |
|
||
| Engineering / Construction | 4 | $72B |
|
||
| Energy Services | 3 | $60B |
|
||
| Utilities | 3 | $41B |
|
||
| Healthcare | 2 | $330B |
|
||
Price history
+133.1% since first listed13 events — show timeline
- 2026-06-08 Price Changed $130,000 Unlock MLS
- 2026-05-05 Listed $140,000 Unlock MLS
- 2026-01-23 Sold (Public Records) — Public Records
- 2024-05-13 Listed — Unlock MLS
- 2024-04-08 Price Changed — Unlock MLS
- 2024-02-12 Listed — Unlock MLS
- 2017-06-20 Sold (Public Records) — Public Records
- 2017-06-16 Sold (MLS) — Unlock MLS
- 2016-09-06 Listed $153,000 Unlock MLS
- 2011-12-06 Sold (MLS) — Unlock MLS
- 2011-04-15 Listed $55,769 Unlock MLS
- 2007-08-31 Sold (Public Records) — Public Records
- 2002-05-31 Sold (Public Records) — Public Records
Property tax history
+7.2%/yrLatest (2025): $4,726 · -30.0% YoY. Source: county tax records.
Cash-flow waterfall
monthlySold comps — $/sqft
last 12 mo · ≤1 miLoading sold comps…