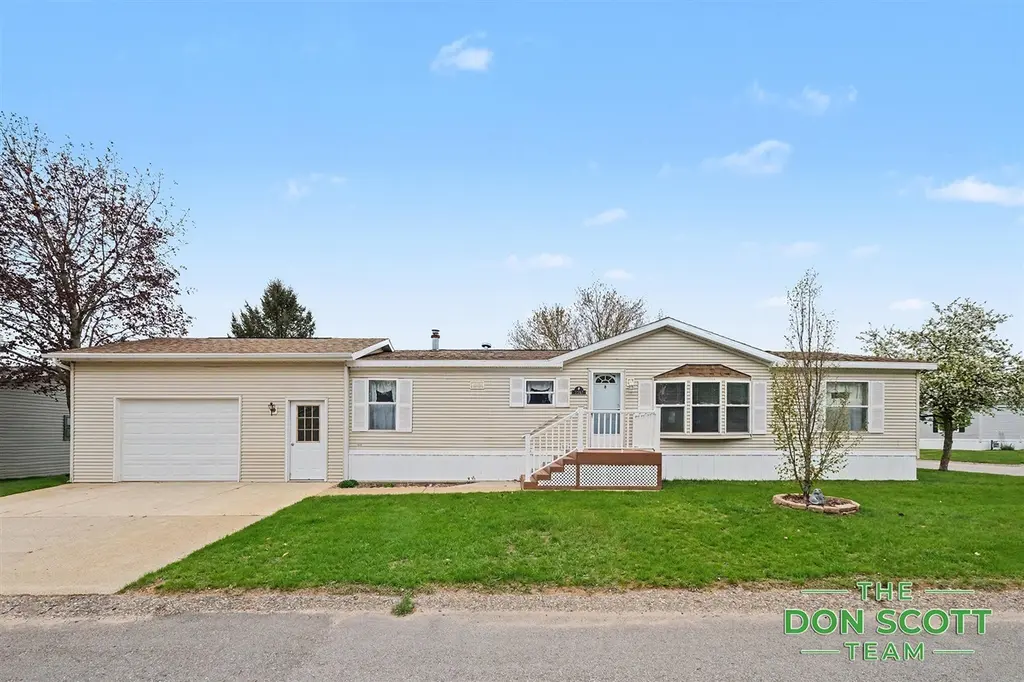
3567 Hollyfield Dr · Cedar Springs, MI
Flood risk No data
- FEMA flood zone
- —
- Chance of flooding over 30 yrs
- —
- Est. flood insurance / yr
- —
Fire risk No data
- Est. fire insurance / yr
- —
Heat risk No data
- Hot days now (above threshold)
- —
- Hot days in 30 yrs
- —
Wind risk No data
- Chance of severe wind over 30 yrs
- —
Air-quality risk No data
- Unhealthy air days now
- —
- Unhealthy air days in 30 yrs
- —
Risk factors via First Street. Map © Google.
Why this score? — see what drove the C grade
The composite is a weighted blend of 9 inputs, each scored 0–100. Each bar is that input's sub-score; the figure is the points it added to the 100-point composite (weight × sub-score).
- Cash flow +19.1/30.0
- 1% rule +10.0/10.0
- ARV discount +7.5/15.0
- DSCR +6.0/10.0
- Livability +3.7/5.0
- Schools +3.6/10.0
- Rent growth +2.5/5.0
- Condition / age +2.5/5.0
- Appreciation +0.0/10.0
$79,900
🖨 Deal sheet (PDF) 📄 Offer letter ✓ Due diligence
Listing remarks MLS
Affordable opportunity in Cedarfield the desirable 55+ community! This spacious 3-bedroom, 2-bath double wide offers approximately 1,500 sq ft of living space and is ready for your personal touch. Built in 1997, with furnace and roof both under 10 years old. Features include a Generac generator, garage, storage shed, and a nice side lot. Great investment potential or affordable living option. Community amenities include walking trails, clubhouse, playground, outdoor patio, and additional storage availability. Conveniently located near Meijer.
Key facts
- Storage availability
- Generac generator
- Clubhouse
Tags
Property features AI
Finance
- Other: Located in the Cedarfield MH Community subdivision; Directions: 17 Mile Rd to Cedarfield Park, south to Hollyfield, west to home
- HOA & community: Homeowners association with monthly fee of $775; HOA amenities include clubhouse, meeting room, playground, and storage; HOA fee includes water, sewer, and trash
Exterior
- Parking: Attached garage with garage door opener; Garage faces front; Paved driveway; 1 garage space
- Utilities: Cable available; Natural gas connected; Public and private water sources available; Public and private sewer available
- Home design: Single-story residential home
- Construction: Vinyl siding exterior; Slab foundation; Built with standard residential construction
- Exterior features: Shingle roof; Paved road access; Private maintained road / private road frontage; Pets allowed
Interior
- Kitchen: Range; Refrigerator
- Bedrooms: Includes multiple bedrooms (total rooms: 8)
- Flooring: Carpet; Linoleum
- Bathrooms: 2 full bathrooms
- Heating & cooling: Forced air heating (natural gas); Central air conditioning; Ceiling fans
- Interior features: Pantry; Vaulted ceilings; Insulated windows; Gas water heater
- Laundry & utility: Main-level laundry room; Washer; Dryer; Generator
Neighborhood map
What this means for you Summary
Snapshot
- This is a 3-bed/2.0-bath other listed at $80k.
Deal economics
- At list price, monthly cash flow is $85 ($1k/yr) — positive.
- The deal already cash-flows at list — no discount required.
- Meets the 1% rule at list price ($2k rent vs $80k).
- Recommended offer: $79k (1.5% below list) — sets the bar for market timing.
- Cap rate 7.6% vs local median 3.6% in Cedar Springs — top-decile yield for the area; either an underpriced asset or a hidden risk that comps aren't pricing in. Stress-test before assuming the spread holds.
Location & tenants
- Location reads 74/100 on livability (#180 in MI, #4,617 nationally) — a middle-class / working-renter tenant base. Strengths: cost of living A+, housing A+, crime A-; Watch: amenities D, commute F, employment D-.
- Cedar Springs Public Schools (town): math 35% / reading 48% proficiency, ranked #175 of 540 in MI (top 32%) — families likely to look elsewhere, expect single-tenant / working-renter base with shorter leases.
- Market conditions: 115 active listings in the ZIP; 2,253 units permitted in Kent County in 2024 (969 in 5+ unit buildings).
Forward outlook
- Local home prices are declining (-3.0%/yr); year-one equity from $552 of loan paydown is wiped out by about $2k of value loss. Plan a longer hold.
- Kent County population projected at +22% by 2050 — long-run rental-demand tailwind backs the buy-and-hold thesis.
Negotiation context
- It's been on market 15 days — a 2% lower offer ($79k) is reasonable based on typical stale-listing flexibility.
- 9 sale attempts with the ask held roughly flat each time — persistent listings suggest the price (not the market) is what's stuck; bring a comps-based counter.
Risks & watch-outs
- Watch-outs: HOA is 43% of rent.
Questions for the listing agent
- What does the HOA fee cover, when was the last increase, and are there any pending special assessments or reserve-fund shortfalls?
- Is there a deadline driving the sale (1031 exchange, divorce, estate, relocation)? That informs how much negotiation room exists.
- Schools are B-rated — typically a magnet for longer-tenancy family renters. What's the average tenant stay here, and is there a school-zone premium baked into asking?
- What's the average days-on-market for RENTAL listings here right now (not sales)? A rising rental-DOM trend means longer vacancies and softer asking-rent achievability than the comps imply.
- What's the recent tenant-quality profile in this submarket — average credit score on applications, eviction rate, late-payment / NSF rate, and stable-employment percentage? A property-management company in the area should have these aggregated.
- How much new for-sale + rental construction is in the pipeline within 1–3 miles? Heavy new supply typically softens prices + rents 12–24 months out; constrained supply supports both.
Investment metrics
- 1% rule
- 2.24% ✓
- Cap rate
- 7.57%
- Cash-on-cash
- 4.58%
- DSCR
- 1.20
- GRM
- 3.7
CMA / ARV
- ARV (median comp)
- $1,136,484
- List price
- $79,900
- Delta
- -92.97%
- Verdict
- UNDERPRICED
- Comps
- 1 within 2.0 mi
Projected returns pro-forma
-3.0% appreciation · 3.0% rent growth · sell at horizon
- IRR
- -8.5%
- Equity multiple
- 0.69×
- Total profit
- $-7,008
- Equity at exit
- $11,913
- IRR
- 1.8%
- Equity multiple
- 1.13×
- Total profit
- $2,942
- Equity at exit
- $6,908
Cash invested: $22,372 (down + closing). Projections, not guarantees.
Landlord ↔ Tenant lean methodology
- Overall (STATE)
- 62 Landlord-Friendly
- State Michigan
- 62 Landlord-Friendly · EVEN
- County
- — inherits STATE
- City
- — inherits STATE
ZIP-level market 49319
- Home prices YoY
- -31.2%
- Active inventory
- 115
- Price-to-rent
- 3.7×
Monthly cashflow live
- Estimated rent
- $1,788 medium interval (Pro) →
- Mortgage (P&I)
- −$419
- Tax est. 1.5%
- −$100 /mo · $1,198/yr
- Insurance
- −$33
- HOA
- −$775
- Vacancy / Maint / Mgmt
- −$375
- Net cashflow
- $85
Break-even live
Sensitivity live
| Price | -10% $141 | -5% $113 | +0% $85 | +5% $58 | +10% $30 |
|---|---|---|---|---|---|
| Rent | -10% $-56 | -5% $15 | +0% $85 | +5% $156 | +10% $227 |
| Rate | -1.0pp $126 | -0.5pp $106 | base $85 | +0.5pp $65 | +1.0pp $44 |
UW: 25.0% down · 7.5% · 30yr · 1.5% tax · 5.0% vac · 8.0% maint · 8.0% mgmt
Financing live
Cash to close
- Down payment
- $19,975
- Closing costs
- $2,397
- Reserves months
- —
- Total cash needed
- —
Loan-product check · same deal, 3 products live
Conventional
25% down · 7.5% · 30yr
- Down + closing
- —
- Monthly P&I
- —
- Monthly cashflow
- —
- DSCR
- —
- Eligible?
- —
Personal DTI + credit; lowest rate.
DSCR
20% down · 8.5% · 30yr
- Down + closing
- —
- Monthly P&I
- —
- Monthly cashflow
- —
- DSCR
- —
- Eligible?
- —
No personal income docs; deal must DSCR.
Hard money
10% down · 12.0% · 12mo
- Down + closing
- —
- Monthly P&I
- —
- Monthly cashflow
- —
- DSCR
- —
- Eligible?
- —
Short-term bridge; refi at stabilization.
HOA detail
- Monthly dues
- $775 · $9,300/yr
Listing history 31 events
-
2026-06-13$79,900 Pending 15 DOM
-
2026-05-04$79,900 Active 549-char remark
Show marketing remark (548 chars)
Affordable opportunity in Cedarfield the desirable 55+ community! This spacious 3-bedroom, 2-bath double wide offers approximately 1,500 sq ft of living space and is ready for your personal touch. Built in 1997, with furnace and roof both under 10 years old. Features include a Generac generator, garage, storage shed, and a nice side lot. Great investment potential or affordable living option. Community amenities include walking trails, clubhouse, playground, outdoor patio, and additional storage availability. Conveniently located near Meijer.
-
2026-05-04$79,900 Active 548-char remark
Show marketing remark (548 chars)
Affordable opportunity in Cedarfield the desirable 55+ community! This spacious 3-bedroom, 2-bath double wide offers approximately 1,500 sq ft of living space and is ready for your personal touch. Built in 1997, with furnace and roof both under 10 years old. Features include a Generac generator, garage, storage shed, and a nice side lot. Great investment potential or affordable living option. Community amenities include walking trails, clubhouse, playground, outdoor patio, and additional storage availability. Conveniently located near Meijer.
-
2026-05-04$79,900 Active
Show marketing remark (548 chars)
Affordable opportunity in Cedarfield the desirable 55+ community! This spacious 3-bedroom, 2-bath double wide offers approximately 1,500 sq ft of living space and is ready for your personal touch. Built in 1997, with furnace and roof both under 10 years old. Features include a Generac generator, garage, storage shed, and a nice side lot. Great investment potential or affordable living option. Community amenities include walking trails, clubhouse, playground, outdoor patio, and additional storage availability. Conveniently located near Meijer.
-
2026-04-15historical
-
2026-04-14historical
-
2026-03-18price $85,000
-
2026-03-17price $85,000
-
2026-03-17price $85,000
-
2026-03-05price $95,000
-
2026-03-04price $95,000
-
2026-03-04price $95,000
-
2026-01-31$105,000 Active
-
2026-01-31$105,000 Active
-
2026-01-22historical
-
2025-12-26status Active
-
2025-12-26status Active
-
2025-12-07status Pending
-
2025-12-07status Pending
-
2025-12-07historical
-
2025-11-29price $105,000
-
2025-11-29price $105,000
-
2025-11-29price $105,000
-
2025-11-22price $112,000
-
2025-11-21price $112,000
-
2025-11-21price $112,000
-
2025-09-16price $115,900
-
2025-09-15price $115,900
-
2025-09-15price $115,900
-
2025-07-21$124,900 Active
-
2025-07-21$124,900 Active
ⓘ Source: listings_history table (triggers on properties + properties_extension) + one-shot
backfill from property_details.listing_events for pre-trigger history.
Nearby sold comps map
Loading sold comps map…
Walkable amenities ~0.75 mi
Loading nearby amenities…
Taxation est. · year 1
- Rental income
- $21,456
- − Mortgage interest
- −$4,476
- − Property taxes
- −$1,198
- − Insurance
- −$400
- − Repairs & maintenance
- −$1,716
- − Management
- −$1,716
- − HOA
- −$9,300
- − Depreciation
- −$2,324
- Taxable income
- $325
- Est. tax owed @ 24.0%
- −$78
- After-tax cash flow
- $946/yr
For passive investors: Depreciation is non-cash, so a rental often shows a tax loss while cash-flowing — sheltering income. Rental losses are passive: they offset passive income freely, and up to $25,000/yr can offset ordinary (W-2) income if you actively participate and your MAGI is under $100k (phasing out to $0 by $150k); unused losses carry forward. On sale, claimed depreciation is recaptured at up to 25%, and gains may owe capital-gains tax (a 1031 exchange can defer both). Figures are a year-1 estimate at your 24.0% rate — not tax advice; consult a CPA.
Schools (NCES district)
- District
- Cedar Springs Public Schools
- NCES district ID
- 2608520
- Math proficiency
- 35% ▼ -11.00%
- Reading proficiency
- 48% ▼ -8.00%
- Median HH income
- $57,632
- Composite
- 36.42/100
- National rank
- #4675
- State rank
- #175 of 540 in MI
Livability — Cedar Springs
- Score
- 74/100
- State rank
- #180
- US rank
- #4617
Category grades
Schools grade is shown separately in the Schools card above.
Census & demographics
- Population (ZIP)
- 18,725
Population outlook (Kent County) Hauer SSP2
- Today (2025)
- 712,484 people
- By 2030
- 748,618 · +5.1%
- By 2040
- 814,777 · +14.4%
- By 2050
- 868,556 · +21.9%
- By 2075
- 966,487 · +35.7%
- By 2100
- 967,975 · +35.9%
Race, ethnicity, and origin ACS 2023
- Neighborhood character
- Predominantly White (89%)
- Race & ethnicity
- White 89% Two or more races 8% Hispanic / Latino 6%
- Hispanic origin (detail)
- Mexican 4% Cuban 1%
- Common ancestry
- Iranian 14% Romanian 9% Slovak 4%
- Foreign-born
- 1% · Canada
- Languages at home
- 98% English-only · Spanish 1%
Political lean MEDSL · Kent
- 2024 margin
- Lean D (+5.4) · D 51.8% · R 46.5% · Other 1.7%
- 2008→2024 swing
- +4.8pp toward D · 2008: 0.5pp · 2024: 5.4pp
- All cycles
- 2024: D+5.4 2020: D+6.1 2016: R+3.1 2012: R+7.9 2008: D+0.5
Not yet ingested
- Civics
- —
Market trends
- HPI YoY
- ▼ -124.04%
- Current HPI
- 273.4453
- Rent YoY
- —
- Metro
- —
- State GDP YoY
- ▲ 1.37%
- F500 in state
- 28
Industry mix (Fortune 500 HQ in MI)
| Industry | F500 HQs | Revenue |
|---|---|---|
| Automotive Parts | 3 | $48B |
|
||
| Automotive | 2 | $372B |
|
||
| Chemicals | 1 | $45B |
|
||
| Automotive Retail | 1 | $29B |
|
||
| Healthcare / Medical Devices | 1 | $23B |
|
||
| Automotive Technology | 1 | $20B |
|
||
Price history
-44.0% since first listed36 events — show timeline
- 2026-06-11 Sold (MLS) $70,000 MiRealSource-MiMLS
- 2026-06-11 Sold (MLS) $70,000 SW Michigan MLS
- 2026-06-11 Sold (MLS) $70,000 REALCOMP
- 2026-05-19 Pending — REALCOMP
- 2026-05-19 Pending — MiRealSource-MiMLS
- 2026-05-19 Pending — SW Michigan MLS
- 2026-05-04 Listed $79,900 MiRealSource-MiMLS
- 2026-05-04 Listed $79,900 SW Michigan MLS
- 2026-05-04 Listed $79,900 REALCOMP
- 2026-04-15 Listing Removed — MiRealSource-MiMLS
- 2026-04-14 Listing Removed — REALCOMP
- 2026-03-18 Price Changed $85,000 MiRealSource-MiMLS
- 2026-03-17 Price Changed $85,000 REALCOMP
- 2026-03-17 Price Changed $85,000 SW Michigan MLS
- 2026-03-05 Price Changed $95,000 MiRealSource-MiMLS
- 2026-03-04 Price Changed $95,000 REALCOMP
- 2026-03-04 Price Changed $95,000 SW Michigan MLS
- 2026-01-31 Listed $105,000 REALCOMP
- 2026-01-31 Listed $105,000 MiRealSource-MiMLS
- 2026-01-22 Listing Removed — MiRealSource-MiMLS
- 2025-12-26 Relisted — MiRealSource-MiMLS
- 2025-12-26 Relisted — REALCOMP
- 2025-12-07 Pending — REALCOMP
- 2025-12-07 Pending — MiRealSource-MiMLS
- 2025-12-07 Listing Removed — REALCOMP
- 2025-11-29 Price Changed $105,000 MiRealSource-MiMLS
- 2025-11-29 Price Changed $105,000 REALCOMP
- 2025-11-29 Price Changed $105,000 SW Michigan MLS
- 2025-11-22 Price Changed $112,000 MiRealSource-MiMLS
- 2025-11-21 Price Changed $112,000 REALCOMP
- 2025-11-21 Price Changed $112,000 SW Michigan MLS
- 2025-09-16 Price Changed $115,900 MiRealSource-MiMLS
- 2025-09-15 Price Changed $115,900 REALCOMP
- 2025-09-15 Price Changed $115,900 SW Michigan MLS
- 2025-07-21 Listed $124,900 REALCOMP
- 2025-07-21 Listed $124,900 MiRealSource-MiMLS
Property tax history
+2.4%/yrLatest (2025): $82 · +2.6% YoY. Source: county tax records.
Cash-flow waterfall
monthlySold comps — $/sqft
last 12 mo · ≤1 miLoading sold comps…