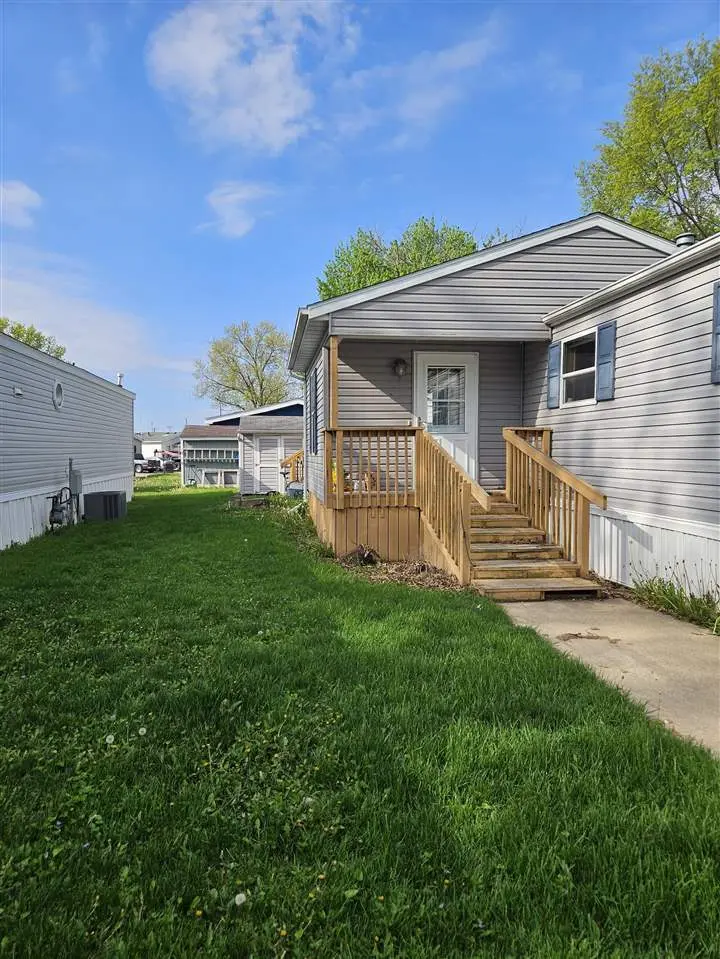
2100 Scott Blvd Lot 35 Blvd · Iowa City, IA
Flood risk 1/10 · Minimal
- FEMA flood zone
- X
- Chance of flooding over 30 yrs
- 0.0%
- Est. flood insurance / yr
- $508 – $851
Fire risk 2/10 · Minimal
- Est. fire insurance / yr
- $902 – $1,676
Heat risk 3/10 · Minor
- Hot days now (above threshold)
- 7 days/yr
- Hot days in 30 yrs
- 16 days/yr
Wind risk No data
- Chance of severe wind over 30 yrs
- —
Air-quality risk 2/10 · Minimal
- Unhealthy air days now
- 1 days/yr
- Unhealthy air days in 30 yrs
- 2 days/yr
Risk factors via First Street. Map © Google.
Why this score? — see what drove the B- grade
The composite is a weighted blend of 9 inputs, each scored 0–100. Each bar is that input's sub-score; the figure is the points it added to the 100-point composite (weight × sub-score).
- Cash flow +30.0/30.0
- 1% rule +10.0/10.0
- DSCR +10.0/10.0
- Schools +5.7/10.0
- Livability +4.3/5.0
- Rent growth +4.1/5.0
- Condition / age +2.8/5.0
- ARV discount +0.0/15.0
- Appreciation +0.0/10.0
$45,000
🖨 Deal sheet 📄 Offer letter ✓ Due diligence
Listing remarks
Welcome to this 3 bedroom 2 bath home with a closed in porch. The home has had new flooring installed in the last couple years and also some new plumbing. It is open concept and has a large primary bedroom with closet. The home is on leased land and is in Sunset Village park. Lot rent is 875 a month per park management and includes water, sewer and trash. The listing agent is not affiliated with the park in anyway. The buyer must get park approval and home is sold asis where is. ..
Key facts
- New plumbing
- Closed in porch
- Open concept
Tags
Property features AI
Finance
- HOA & community: Annual association fee; Association covers water, sewer, and trash; Subdivision: Sunset Village; No community amenities listed
Exterior
- Parking: Off-street parking; Parking pad; 2 parking spaces
- Security: Smoke detector(s)
- Utilities: Shared well water; Public sewer
- Home design: Manufactured house; Residential property; Manufactured home subtype; Built by Schult; Vinyl siding
- Construction: Vinyl siding construction
- Exterior features: Porch; Shed(s)
Interior
- Kitchen: Dishwasher; Refrigerator
- Bathrooms: 2 full bathrooms
- Heating & cooling: Central air; Ceiling fan(s); Forced air heating; Natural gas heating
- Interior features: Other interior features; Smoke detector(s)
- Laundry & utility: Main level laundry room
Neighborhood map
What this means for you Summary
Snapshot
- This is a 3-bed/2.0-bath single-family listed at $45k. Condition is rated average.
Deal economics
- At list price, monthly cash flow is $747 ($9k/yr) — positive.
- The deal already cash-flows at list — no discount required.
- Meets the 1% rule at list price ($1k rent vs $45k).
- Recommended offer: $44k (3.0% below list) — sets the bar for market timing.
- Cap rate 26.2% vs local median 2.7% in Iowa City — top-decile yield for the area; either an underpriced asset or a hidden risk that comps aren't pricing in. Stress-test before assuming the spread holds.
Location & tenants
- Location reads 86/100 on livability (#13 in IA, #450 nationally) — a professional / high-income tenant draw. Strengths: amenities A+, commute A+, cost of living A+.
- Iowa City Community School District (urban): math 65% / reading 70% proficiency, ranked #174 of 289 in IA (top 60%) — acceptable for families but not a draw, mixed tenant base, ~2y average lease.
- Zoned schools: Robert Lucas Elementary School (math 52% / reading 57%, grade C, #462 of 616 statewide, top 79%, 285 students, 44% FRL); Southeast Junior High School (math 64% / reading 68%, grade A-, #152 of 246 statewide, top 62%, 812 students, 50% FRL); Iowa City High School (math 62% / reading 73%, grade B, #186 of 336 statewide, top 57%, 1,599 students, 40% FRL).
- Market conditions: Rents rising fast (+6.3%/yr); 260 active listings in the ZIP; 3 comparable units currently listed for rent nearby; rentals at typical pace (median 21d on market — plan ~3-4 weeks tenant-placement turnaround); 714 units permitted in Johnson County in 2024 (158 in 5+ unit buildings).
- This rent runs 30% of the median local income ($53k/yr) — at the standard rent-burdened threshold; future hikes will face affordability resistance.
Forward outlook
- Local home prices are declining (-3.0%/yr); year-one equity from $311 of loan paydown is wiped out by about $1k of value loss. Plan a longer hold.
- Johnson County population projected at +60% by 2050 — long-run rental-demand tailwind backs the buy-and-hold thesis.
- At projected returns (-3.0% appreciation + 6.3% rent growth), your $13k cash investment doubles in ~2 years — after that, you're playing with house money.
Negotiation context
- It's been on market 49 days — a 3% lower offer ($44k) is reasonable based on typical stale-listing flexibility.
- 3 sale attempts since 3y ago with the ask held roughly flat each time — persistent listings suggest the price (not the market) is what's stuck; bring a comps-based counter.
Questions for the listing agent
- It's been on market 49 days. Have you received any prior offers? Is the seller open to a 3% concession, seller financing, or rate buy-down credit?
- Is there a deadline driving the sale (1031 exchange, divorce, estate, relocation)? That informs how much negotiation room exists.
- Schools are A-rated — typically a magnet for longer-tenancy family renters. What's the average tenant stay here, and is there a school-zone premium baked into asking?
- What's the average days-on-market for RENTAL listings here right now (not sales)? A rising rental-DOM trend means longer vacancies and softer asking-rent achievability than the comps imply.
- What's the recent tenant-quality profile in this submarket — average credit score on applications, eviction rate, late-payment / NSF rate, and stable-employment percentage? A property-management company in the area should have these aggregated.
- How much new for-sale + rental construction is in the pipeline within 1–3 miles? Heavy new supply typically softens prices + rents 12–24 months out; constrained supply supports both.
Investment metrics
- 1% rule
- 2.98% ✓
- Cap rate
- 26.22%
- Cash-on-cash
- 71.17%
- DSCR
- 4.17
- GRM
- 2.8
CMA / ARV
- ARV (median comp)
- $30,000
- List price
- $45,000
- Delta
- 50.00%
- Verdict
- OVERPRICED
- Comps
- 7 within 1.0 mi
Show comp detail 2 sales within ~0.75 mi
| Address | Dist | Beds/Ba | Sqft | Sold | Price | $/sf | Match |
|---|---|---|---|---|---|---|---|
| 2038 Hannah Jo Ct | 0.24mi | 2/2.0 (-1) | 1,338 (+10%) | 4mo | $208,000 | $155 | 64 |
| 1208 Guildford Ct | 0.72mi | 2/2.0 (-1) | 1,349 (+11%) | 20mo | $259,000 | $192 | 27 |
Match score weights: distance 35% · size 25% · config 20% · recency 20%. Top-matched comps best support the ARV.
Projected returns pro-forma
-3.0% appreciation · 6.32% rent growth · sell at horizon
- IRR
- 74.5%
- Equity multiple
- 4.57×
- Total profit
- $44,948
- Equity at exit
- $6,710
- IRR
- 79.2%
- Equity multiple
- 10.59×
- Total profit
- $120,825
- Equity at exit
- $3,891
Cash invested: $12,600 (down + closing). Projections, not guarantees.
Landlord ↔ Tenant lean methodology
- Overall (STATE)
- 83 Strongly Landlord-Friendly
- State Iowa
- 83 Strongly Landlord-Friendly · R+6
- County
- — inherits STATE
- City
- — inherits STATE
ZIP-level market 52240
- Rents YoY
- 6.3%
- Active inventory
- 260
- Price-to-rent
- 2.8×
Monthly cashflow live
- Estimated rent
- $1,340 medium interval (Pro) →
- Mortgage (P&I)
- −$236
- Tax est. 1.5%
- −$56 /mo · $675/yr
- Insurance
- −$19
- HOA
- −$0
- Vacancy / Maint / Mgmt
- −$281
- Net cashflow
- $747
Break-even live
UW: 25.0% down · 7.5% · 30yr · 1.5% tax · 5.0% vac · 8.0% maint · 8.0% mgmt
Financing live
Cash to close
- Down payment
- $11,250
- Closing costs
- $1,350
- Reserves months
- —
- Total cash needed
- —
Loan-product check · same deal, 3 products live
Conventional
25% down · 7.5% · 30yr
- Down + closing
- —
- Monthly P&I
- —
- Monthly cashflow
- —
- DSCR
- —
- Eligible?
- —
Personal DTI + credit; lowest rate.
DSCR
20% down · 8.5% · 30yr
- Down + closing
- —
- Monthly P&I
- —
- Monthly cashflow
- —
- DSCR
- —
- Eligible?
- —
No personal income docs; deal must DSCR.
Hard money
10% down · 12.0% · 12mo
- Down + closing
- —
- Monthly P&I
- —
- Monthly cashflow
- —
- DSCR
- —
- Eligible?
- —
Short-term bridge; refi at stabilization.
Rent comps 3 comps
| Address | Beds | Baths | Sqft | Rent | $/sqft | DOM | Units | Dist |
|---|---|---|---|---|---|---|---|---|
| 2100 S Scott Blvd Unit 66 Iowa City, IA | 3.0 | 2.0 | 1216 | $1,199 | $0.99 | 21d | 1 | 0.05mi |
| 3432 Eastbrook St Iowa City, IA | 3.0 | 2.0–2.5 | 1874 | $2,000 | $1.07 | 13d | 1 | 0.78mi |
| 2300 Catskill Ct Iowa City, IA | 3.0 | 2.0 | 1456 | $1,850 | $1.27 | 43d | 1 | 1.22mi |
Listing history 21 events
-
2026-06-19days on market $45,000 Active 49 DOM
-
2026-06-18days on market $45,000 Active 48 DOM
-
2026-06-17days on market $45,000 Active 47 DOM
-
2026-06-16days on market $45,000 Active 46 DOM
-
2026-06-15days on market $45,000 Active 45 DOM
-
2026-06-14days on market $45,000 Active 43 DOM
-
2026-06-13days on market $45,000 Active 42 DOM
-
2026-06-10days on market $45,000 Active 40 DOM
-
2026-06-09days on market $45,000 Active 39 DOM
-
2026-06-08days on market $45,000 Active 38 DOM
-
2026-06-07days on market $45,000 Active 37 DOM
-
2026-06-05days on market $45,000 Active 34 DOM
-
2026-06-03days on market $45,000 Active 33 DOM
-
2026-06-02days on market $45,000 Active 32 DOM
-
2026-06-01days on market $45,000 Active 31 DOM
-
2026-05-31days on market $45,000 Active 30 DOM
-
2026-05-30days on market $45,000 Active 29 DOM
-
2026-05-01$45,000 Active 486-char remark
-
2023-08-11status Active
-
2023-08-08historical
-
2023-08-04$55,000 Active
ⓘ Source: listings_history table (triggers on properties + properties_extension) + one-shot
backfill from property_details.listing_events for pre-trigger history.
Climate risk First Street
- Flood 1/10 Low FEMA zone X · 0% chance over 30 yrs
- Wildfire 2/10 Low
- Heat 3/10 Moderate
- Air quality 2/10 Low 1 unhealthy d/yr today · 2 by 30 yrs out
Nearby sold comps map
Loading sold comps map…
Walkable amenities ~0.75 mi
Loading nearby amenities…
Taxation est. · year 1
- Rental income
- $16,075
- − Mortgage interest
- −$2,521
- − Property taxes
- −$675
- − Insurance
- −$225
- − Repairs & maintenance
- −$1,286
- − Management
- −$1,286
- − Depreciation
- −$1,309
- Taxable income
- $8,773
- Est. tax owed @ 24.0%
- −$2,106
- After-tax cash flow
- $6,862/yr
For passive investors: Depreciation is non-cash, so a rental often shows a tax loss while cash-flowing — sheltering income. Rental losses are passive: they offset passive income freely, and up to $25,000/yr can offset ordinary (W-2) income if you actively participate and your MAGI is under $100k (phasing out to $0 by $150k); unused losses carry forward. On sale, claimed depreciation is recaptured at up to 25%, and gains may owe capital-gains tax (a 1031 exchange can defer both). Figures are a year-1 estimate at your 24.0% rate — not tax advice; consult a CPA.
Condition & rehab AI · 12 photos
The home requires moderate updates to kitchen cabinets, bathroom fixtures, and interior walls to improve its resale and rental value.
Repairs flagged
- Minor kitchen cabinets — existing cabinets need updating
- Minor bathroom fixtures — existing fixtures need updating
- Minor interior walls — existing wallpaper needs updating
Value-add opportunities
- Both paint interior walls — enhances curb appeal and interior aesthetics
- Both replace kitchen cabinets — modernizes kitchen and increases value
- Both replace bathroom fixtures — modernizes bathroom and increases value
Renovation cost estimate screening
| Repair item | Severity | Est. cost |
|---|---|---|
| kitchen cabinets · existing cabinets need updating | Minor | $500–3,000 |
| bathroom fixtures · existing fixtures need updating | Minor | $500–3,000 |
| interior walls · existing wallpaper needs updating | Minor | $500–3,000 |
| Total estimated repair cost · 3 items | $1,500–9,000 |
Value-add ROI direction
- Both paint interior walls — enhances curb appeal and interior aesthetics ↑
- Both replace kitchen cabinets — modernizes kitchen and increases value ↑
- Both replace bathroom fixtures — modernizes bathroom and increases value ↑
ⓘ Cost ranges are severity-bucket heuristics (US national rule-of-thumb). Get contractor quotes + a written scope before underwriting a rehab budget.
Schools (NCES district)
- District
- Iowa City Community School District
- NCES district ID
- 1914700
- Math proficiency
- 65% ▼ -6.00%
- Reading proficiency
- 70% ▲ 2.00%
- Median HH income
- $50,229
- Composite
- 57.3/100
- National rank
- #1088
- State rank
- #174 of 289 in IA
Livability — Iowa City
- Score
- 86/100
- State rank
- #13
- US rank
- #450
Category grades
Schools grade is shown separately in the Schools card above.
Census & demographics
- County
- Johnson County · 132,710 people
- City population
- 80,235
- Metro
- Iowa City, IA
- Population (ZIP)
- 35,074
- Household income
- $52,960
- Rent vs Own
- Severe rent burden
- 2852.0
Population outlook (Johnson County) Hauer SSP2
- Today (2025)
- 180,405 people
- By 2030
- 200,014 · +10.9%
- By 2040
- 241,428 · +33.8%
- By 2050
- 288,144 · +59.7%
- By 2075
- 420,009 · +132.8%
- By 2100
- 546,596 · +203.0%
Race, ethnicity, and origin ACS 2023
- Neighborhood character
- Predominantly White (71%)
- Race & ethnicity
- White 71% Hispanic / Latino 11% Black 9% Two or more races 8% Asian 5%
- Hispanic origin (detail)
- Mexican 6% Puerto Rican 1%
- Common ancestry
- Portuguese 3% Romanian 2% Iranian 2%
- Foreign-born
- 12% · Canada, Vietnam, China
- Languages at home
- 81% English-only · Spanish 8% French/Haitian/Cajun 2% Arabic 2%
Political lean MEDSL · Johnson
- 2024 margin
- Solid D (+38.1) · D 68.4% · R 30.3% · Other 1.3%
- 2008→2024 swing
- -3.4pp toward R · 2008: 41.5pp · 2024: 38.1pp
- All cycles
- 2024: D+38.1 2020: D+43.2 2016: D+38.3 2012: D+35.4 2008: D+41.5
Not yet ingested
- Civics
- —
Market trends
- HPI YoY
- ▼ -202.53%
- Current HPI
- 170.7491
- Rent YoY
- ▲ 6.32%
- Metro
- Iowa City, IA
- State GDP YoY
- ▲ 2.48%
- F500 in state
- 4
Industry mix (Fortune 500 HQ in IA)
| Industry | F500 HQs | Revenue |
|---|---|---|
| Financial Services | 1 | $16B |
|
||
| Retail / Convenience | 1 | $15B |
|
||
Price history
-18.2% since first listed4 events — show timeline
- 2026-05-01 Listed $45,000 ICAARMLS
- 2023-08-11 Relisted — ICAARMLS
- 2023-08-08 Delisted — ICAARMLS
- 2023-08-04 Listed $55,000 ICAARMLS
Cash-flow waterfall
monthlySold comps — $/sqft
last 12 mo · ≤1 miLoading sold comps…