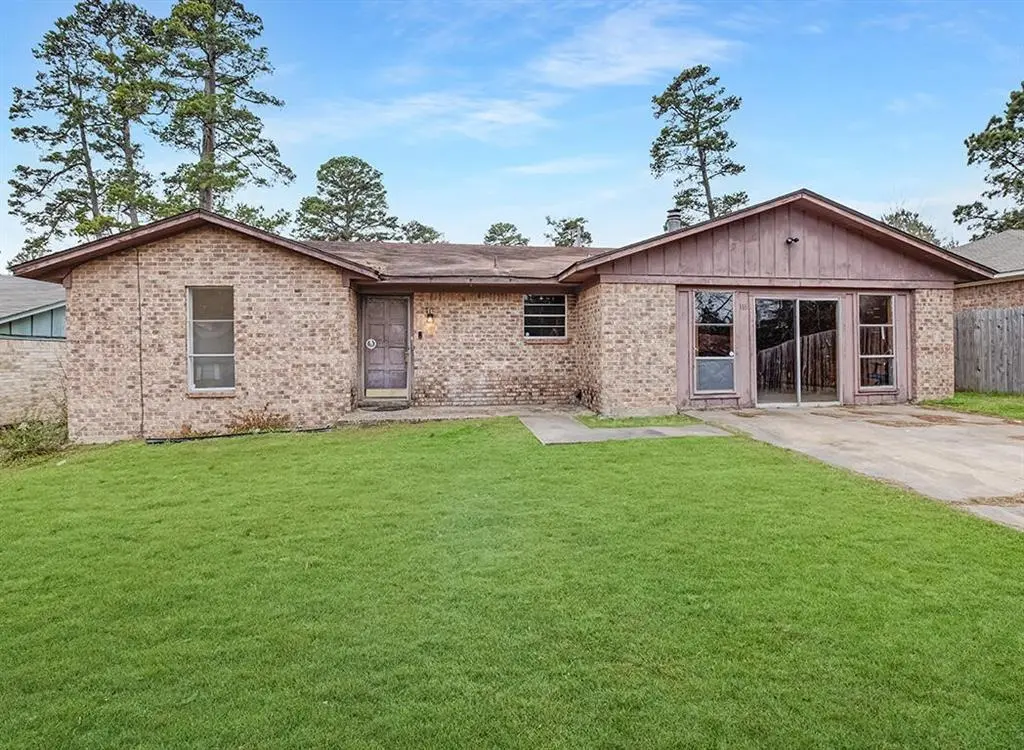
165 Greenforest Trl · Nash, TX
Flood risk 1/10 · Minimal
- FEMA flood zone
- X (unshaded)
- Chance of flooding over 30 yrs
- 0.0%
- Est. flood insurance / yr
- $507 – $1,088
Fire risk 5/10 · Moderate
- Est. fire insurance / yr
- $1,222 – $2,270
Heat risk 7/10 · Major
- Hot days now (above 111°F)
- 7 days/yr
- Hot days in 30 yrs
- 22 days/yr
Wind risk 6/10 · Moderate
- Chance of severe wind over 30 yrs
- 27.0%
Air-quality risk 2/10 · Minimal
- Unhealthy air days now
- 0 days/yr
- Unhealthy air days in 30 yrs
- 1 days/yr
Risk factors via First Street. Map © Google.
Why this score? — see what drove the C- grade
The composite is a weighted blend of 9 inputs, each scored 0–100. Each bar is that input's sub-score; the figure is the points it added to the 100-point composite (weight × sub-score).
- Cash flow +13.7/30.0
- Appreciation +8.7/10.0
- ARV discount +8.1/15.0
- 1% rule +4.2/10.0
- DSCR +4.1/10.0
- Livability +3.5/5.0
- Schools +3.2/10.0
- Rent growth +2.5/5.0
- Condition / age +2.5/5.0
$157,000
🖨 Deal sheet (PDF) 📄 Offer letter ✓ Due diligence
Listing remarks MLS
Double-digit returns don't come ready-to-rent in a quiet, safe neighborhood with top-rated schools — but this one does. Rent-ready 3-bed, 2-bath brick home in Nash, already listed at $1,440-mo. Split-bedroom layout, two living areas, brick fireplace with built-in shelving, durable tile flooring, covered patio, fenced backyard — the features that keep quality tenants renewing year after year. FOR HOMEOWNERS Nash is the kind of neighborhood people move to and stay in — safe, family-friendly, with highly rated schools and a genuine community feel. Move straight into a vacant, well-maintained brick home built to last. Fenced backyard and covered patio. Quick access to shopping, dining, and major highways. Everything you need, none of the city noise. FOR INVESTORS Already listed, zero rehab, zero downtime. This is the rare income asset that's actually ready. Nash's affordability, strong schools, and highway access to Texarkana keep a steady pool of working-family tenants and vacancy risk minimal. Brick construction means lower maintenance and stronger long-term returns. Part of a 20-property SFR portfolio across Texarkana and Nash. Buy one or scale into multiple.
Key facts
- Large backyard
- Dining area
- Modern kitchen
Tags
Neighborhood map
What this means for you Summary
Snapshot
- This is a 3-bed/2.5-bath single-family listed at $157k.
Deal economics
- At list price, monthly cash flow is $10 ($122/yr) — positive.
- The deal already cash-flows at list — no discount required.
- To meet the 1% rule (rent ≥ 1% of price), the offer needs to be $145k (7.6% below list).
- Recommended offer: $145k (7.6% below list) — sets the bar for 1% rule.
Location & tenants
- Location reads 69/100 on livability (#399 in TX) — a middle-class / working-renter tenant base. Strengths: cost of living A+, housing A, crime B+; Watch: commute C-, schools D+, employment D.
- Texarkana ISD (urban): math 36% / reading 41% proficiency, ranked #472 of 826 in TX (top 57%) — families likely to look elsewhere, expect single-tenant / working-renter base with shorter leases; 64% free/reduced lunch — lower-income household profile, screen leases tightly.
- Market conditions: 17 active listings in the ZIP; 2 comparable units currently listed for rent nearby; 137 units permitted in Bowie County in 2024 (5 in 5+ unit buildings).
Forward outlook
- In year one you build about $13k of equity ($1k loan paydown + $11k appreciation (7.3% local appreciation)).
- At projected returns (7.3% appreciation + 3.0% rent growth), your $44k cash investment doubles in ~4 years — after that, you're playing with house money.
- By year 3, paydown + projected appreciation supports a ~$31k cash-out refi (75% LTV) — recoverable capital for the next deal without selling this one.
Negotiation context
- It's been on market 84 days — a 6% lower offer ($148k) is reasonable based on typical stale-listing flexibility.
- 4 sale attempts; this cycle's ask is 10803% above the opening price — seller raised mid-cycle; expect resistance to lowballs.
Risks & watch-outs
- Climate carrying-cost: major wind risk, 27% chance of damaging wind over 30y; moderate wildfire risk; extreme-heat days projected 7→22/yr by 2055 (HVAC capex compounding) — expect insurance premiums to compound above CPI over the hold.
Questions for the listing agent
- It's been on market 84 days. Have you received any prior offers? Is the seller open to a 8% concession, seller financing, or rate buy-down credit?
- Built in 1978 — when were the roof, HVAC, electrical panel, plumbing, and water heater last replaced?
- Why hasn't it sold? Are there any deal-killer items the seller is aware of (foundation, flood, title, zoning, code violations)?
- Is there a deadline driving the sale (1031 exchange, divorce, estate, relocation)? That informs how much negotiation room exists.
- Schools are D-rated, which usually means shorter tenancies and higher turnover. Who's the typical renter profile here, and what's been the actual vacancy rate?
- What's the average days-on-market for RENTAL listings here right now (not sales)? A rising rental-DOM trend means longer vacancies and softer asking-rent achievability than the comps imply.
- What's the recent tenant-quality profile in this submarket — average credit score on applications, eviction rate, late-payment / NSF rate, and stable-employment percentage? A property-management company in the area should have these aggregated.
- How much new for-sale + rental construction is in the pipeline within 1–3 miles? Heavy new supply typically softens prices + rents 12–24 months out; constrained supply supports both.
Investment metrics
- 1% rule
- 0.92% ✗
- Cap rate
- 6.37%
- Cash-on-cash
- 0.28%
- DSCR
- 1.01
- GRM
- 9.0
CMA / ARV
- ARV (median comp)
- $159,098
- List price
- $157,000
- Delta
- -1.32%
- Verdict
- FAIR
- Comps
- 6 within 1.0 mi
Projected returns pro-forma
7.31% appreciation · 3.0% rent growth · sell at horizon
- IRR
- 18.7%
- Equity multiple
- 2.33×
- Total profit
- $58,505
- Equity at exit
- $111,968
- IRR
- 17.7%
- Equity multiple
- 4.85×
- Total profit
- $169,432
- Equity at exit
- $215,624
Cash invested: $43,960 (down + closing). Projections, not guarantees.
Landlord ↔ Tenant lean methodology
- Overall (STATE)
- 87 Strongly Landlord-Friendly
- State Texas
- 87 Strongly Landlord-Friendly · R+5
- County
- — inherits STATE
- City
- — inherits STATE
ZIP-level market 75569
- Home prices YoY
- 5.0%
- Active inventory
- 17
- Price-to-rent
- 9.0×
Monthly cashflow live
- Estimated rent
- $1,450 medium interval (Pro) →
- Mortgage (P&I)
- −$823
- Tax from tax record
- −$247 /mo · $2,959/yr
- Insurance
- −$65
- HOA
- −$0
- Vacancy / Maint / Mgmt
- −$304
- Net cashflow
- $10
Break-even live
Sensitivity live
| Price | -10% $99 | -5% $55 | +0% $10 | +5% $-34 | +10% $-79 |
|---|---|---|---|---|---|
| Rent | -10% $-104 | -5% $-47 | +0% $10 | +5% $67 | +10% $125 |
| Rate | -1.0pp $89 | -0.5pp $50 | base $10 | +0.5pp $-31 | +1.0pp $-72 |
UW: 25.0% down · 7.5% · 30yr · 1.5% tax · 5.0% vac · 8.0% maint · 8.0% mgmt
Financing live
Cash to close
- Down payment
- $39,250
- Closing costs
- $4,710
- Reserves months
- —
- Total cash needed
- —
Loan-product check · same deal, 3 products live
Conventional
25% down · 7.5% · 30yr
- Down + closing
- —
- Monthly P&I
- —
- Monthly cashflow
- —
- DSCR
- —
- Eligible?
- —
Personal DTI + credit; lowest rate.
DSCR
20% down · 8.5% · 30yr
- Down + closing
- —
- Monthly P&I
- —
- Monthly cashflow
- —
- DSCR
- —
- Eligible?
- —
No personal income docs; deal must DSCR.
Hard money
10% down · 12.0% · 12mo
- Down + closing
- —
- Monthly P&I
- —
- Monthly cashflow
- —
- DSCR
- —
- Eligible?
- —
Short-term bridge; refi at stabilization.
Rent comps 2 comps
| Address | Beds | Baths | Sqft | Rent | $/sqft | DOM | Units | Dist |
|---|---|---|---|---|---|---|---|---|
| 330 N Pecan St Nash, TX | 1.0–2.0 | 1.5–2.5 | 1350 | $1,450 | $1.07 | 44d | 2 | 0.23mi |
| 60 Clark St Nash, TX | 2.0–3.0 | 2.0 | 1450 | $1,450 | $1.00 | 44d | 2 | 0.86mi |
Listing history 28 events
-
2026-06-19days on market $157,000 Active 84 DOM
-
2026-06-18days on market $157,000 Active 83 DOM
-
2026-06-17days on market $157,000 Active 82 DOM
-
2026-06-17price $157,000 Active 81 DOM
-
2026-06-16days on market $159,000 Active 81 DOM
-
2026-06-15days on market $159,000 Active 80 DOM
-
2026-06-14days on market $159,000 Active 78 DOM
-
2026-06-13days on market $159,000 Active 77 DOM
-
2026-06-10days on market $159,000 Active 75 DOM
-
2026-06-09days on market $159,000 Active 74 DOM
-
2026-06-08days on market $159,000 Active 73 DOM
-
2026-06-07days on market $159,000 Active 72 DOM
-
2026-06-05days on market $159,000 Active 69 DOM
-
2026-06-02days on market $159,000 Active 67 DOM
-
2026-06-01days on market $159,000 Active 66 DOM
-
2026-05-31days on market $159,000 Active 65 DOM
-
2026-05-30days on market $159,000 Active 64 DOM
-
2026-05-11$1,440
-
2026-04-29historical $1,440
-
2026-03-29$1,440
-
2026-03-27$160,000 Active 1207-char remark
Show marketing remark (1207 chars)
Double-digit returns don't come ready-to-rent in a quiet, safe neighborhood with top-rated schools — but this one does. Rent-ready 3-bed, 2-bath brick home in Nash, already listed at $1,440-mo. Split-bedroom layout, two living areas, brick fireplace with built-in shelving, durable tile flooring, covered patio, fenced backyard — the features that keep quality tenants renewing year after year. FOR HOMEOWNERS Nash is the kind of neighborhood people move to and stay in — safe, family-friendly, with highly rated schools and a genuine community feel. Move straight into a vacant, well-maintained brick home built to last. Fenced backyard and covered patio. Quick access to shopping, dining, and major highways. Everything you need, none of the city noise. FOR INVESTORS Already listed, zero rehab, zero downtime. This is the rare income asset that's actually ready. Nash's affordability, strong schools, and highway access to Texarkana keep a steady pool of working-family tenants and vacancy risk minimal. Brick construction means lower maintenance and stronger long-term returns. Part of a 20-property SFR portfolio across Texarkana and Nash. Buy one or scale into multiple.
-
2026-03-19historical $1,440
-
2026-03-03price $1,440
-
2026-02-26price $1,400
-
2026-02-19price $1,650
-
2026-02-18$1,550
-
2025-07-21soldstatus
-
2000-09-28soldstatus
ⓘ Source: listings_history table (triggers on properties + properties_extension) + one-shot
backfill from property_details.listing_events for pre-trigger history.
Tax reassessment forecast TX · Resets to sale price
- Current annual tax
- $2,959 · $247/mo
- Projected year-2 tax
- $2,959 · $247/mo
- Expected delta
- $0/yr ($0/mo · 0.0%)
ⓘ Screening estimate from a state-policy table — verify with the county assessor before closing.
Climate risk First Street
- Flood 1/10 Low FEMA zone X (unshaded) · 0% chance over 30 yrs
- Wildfire 5/10 Major
- Heat 7/10 Severe 7 d/yr ≥111°F today · 22 d/yr by 30 yrs out
- Wind 6/10 Major 27% chance of damaging wind over 30 yrs
- Air quality 2/10 Low 0 unhealthy d/yr today · 1 by 30 yrs out
Nearby sold comps map
Loading sold comps map…
Walkable amenities ~0.75 mi
Loading nearby amenities…
Taxation est. · year 1
- Rental income
- $17,400
- − Mortgage interest
- −$8,794
- − Property taxes
- −$2,959
- − Insurance
- −$785
- − Repairs & maintenance
- −$1,392
- − Management
- −$1,392
- − Depreciation
- −$4,567
- Taxable loss
- −$2,490
- Est. tax savings @ 24.0%
- +$598
- After-tax cash flow
- $720/yr
For passive investors: Depreciation is non-cash, so a rental often shows a tax loss while cash-flowing — sheltering income. Rental losses are passive: they offset passive income freely, and up to $25,000/yr can offset ordinary (W-2) income if you actively participate and your MAGI is under $100k (phasing out to $0 by $150k); unused losses carry forward. On sale, claimed depreciation is recaptured at up to 25%, and gains may owe capital-gains tax (a 1031 exchange can defer both). Figures are a year-1 estimate at your 24.0% rate — not tax advice; consult a CPA.
Schools (NCES district)
- District
- Texarkana ISD
- NCES district ID
- 4842480
- Math proficiency
- 36% ▼ -7.00%
- Reading proficiency
- 41% ▼ -1.00%
- Median HH income
- $35,692
- Composite
- 31.87/100
- National rank
- #5867
- State rank
- #472 of 826 in TX
Livability — Nash
- Score
- 69/100
- State rank
- #399
- US rank
- #8266
Category grades
Schools grade is shown separately in the Schools card above.
Census & demographics
- Census place
- Nash, TX
- City population
- 3,601
- Population (ZIP)
- 3,601
Population outlook (Bowie County) Hauer SSP2
- Today (2025)
- 94,699 people
- By 2030
- 94,824 · +0.1%
- By 2040
- 94,870 · +0.2%
- By 2050
- 93,686 · -1.1%
- By 2075
- 90,082 · -4.9%
- By 2100
- 76,579 · -19.1%
Race, ethnicity, and origin ACS 2023
- Neighborhood character
- Diverse neighborhood (Simpson 0.61)
- Race & ethnicity
- Black 50% White 36% Hispanic / Latino 11% Two or more races 8%
- Hispanic origin (detail)
- Mexican 10%
- Common ancestry
- Italian 3% Serbian 1%
- Foreign-born
- 3% · Canada
- Languages at home
- 94% English-only · Spanish 6%
Political lean MEDSL · Bowie
- 2024 margin
- Solid R (+48.7) · D 25.3% · R 74.0%
- 2008→2024 swing
- -10.8pp toward R · 2008: -37.9pp · 2024: -48.7pp
- All cycles
- 2024: R+48.7 2020: R+42.8 2016: R+46.6 2012: R+41.5 2008: R+37.9
Not yet ingested
- Civics
- —
Market trends
- HPI YoY
- ▲ 7.31%
- Current HPI
- 152.7927
- Rent YoY
- —
- Metro
- —
- State GDP YoY
- ▲ 3.95%
- F500 in state
- 110
Industry mix (Fortune 500 HQ in TX)
| Industry | F500 HQs | Revenue |
|---|---|---|
| Energy | 16 | $1,198B |
|
||
| Technology | 5 | $198B |
|
||
| Engineering / Construction | 4 | $72B |
|
||
| Energy Services | 3 | $60B |
|
||
| Utilities | 3 | $41B |
|
||
| Healthcare | 2 | $330B |
|
||
Price history
-7.1% since first listed11 events — show timeline
- 2026-05-11 Listed for Rent $1,440 Avail
- 2026-04-29 Rental Removed $1,440 Avail
- 2026-03-29 Listed for Rent $1,440 Avail
- 2026-03-27 Listed $160,000 NTREIS
- 2026-03-19 Rental Removed $1,440 Avail
- 2026-03-03 Price Changed $1,440 Avail
- 2026-02-26 Price Changed $1,400 Avail
- 2026-02-19 Price Changed $1,650 Avail
- 2026-02-18 Listed for Rent $1,550 Avail
- 2025-07-21 Sold (Public Records) — Public Records
- 2000-09-28 Sold (Public Records) — Public Records
Property tax history
+4.1%/yrLatest (2025): $2,959 · +11.5% YoY. Source: county tax records.
Cash-flow waterfall
monthlySold comps — $/sqft
last 12 mo · ≤1 miLoading sold comps…