 Fourplex
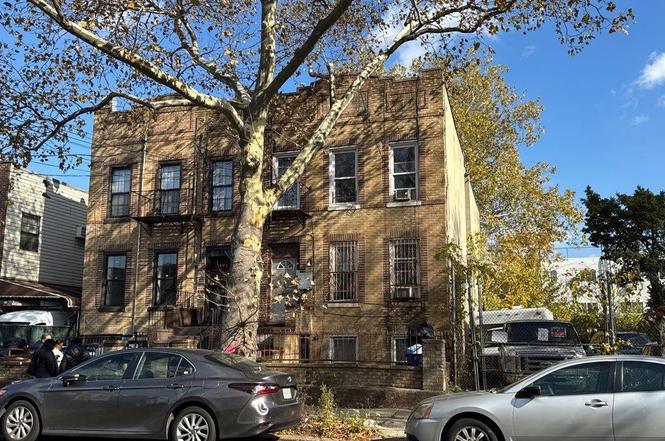
393 Montauk Ave · New York, NY
Flood risk 1/10 · Minimal
- FEMA flood zone
- X (unshaded)
- Chance of flooding over 30 yrs
- 0.0%
- Est. flood insurance / yr
- $507 – $1,088
Fire risk 1/10 · Minimal
- Est. fire insurance / yr
- $691 – $1,283
Heat risk 7/10 · Major
- Hot days now (above 99°F)
- 7 days/yr
- Hot days in 30 yrs
- 15 days/yr
Wind risk 6/10 · Moderate
- Chance of severe wind over 30 yrs
- 65.0%
Air-quality risk 5/10 · Moderate
- Unhealthy air days now
- 6 days/yr
- Unhealthy air days in 30 yrs
- 8 days/yr
Risk factors via First Street. Map © Google.
Why this score? — see what drove the B+ grade
The composite is a weighted blend of 9 inputs, each scored 0–100. Each bar is that input's sub-score; the figure is the points it added to the 100-point composite (weight × sub-score).
- Cash flow +28.3/30.0
- ARV discount +15.0/15.0
- DSCR +10.0/10.0
- 1% rule +7.3/10.0
- Schools +5.0/10.0
- Rent growth +4.0/5.0
- Livability +3.8/5.0
- Condition / age +2.5/5.0
- Appreciation +0.0/10.0
$849,900
🖨 Deal sheet 📄 Offer letter ✓ Due diligence
Multi-family units
County records classify this as Multi-Family (2-4 Unit). Listing-text estimate: 4 units. confirmed
Listing remarks
This four-family home features 8 bedrooms, 4 full baths, and 4 kitchens. The information provided is estimated to the best of our abilities at this time.
Key facts
- 4,100 sq ft lot
- Built 1930
- Listed 168 days
Property features AI
Exterior
- Parking: On-street parking
- Utilities: Sewer: Other; Utilities: See remarks
- Home design: Quadruplex
- Construction: Brick construction
- Exterior features: Brick exterior; Not waterfront
Interior
- Bedrooms: Four 2-bedroom units
- Flooring: Tile flooring
- Bathrooms: Four full bathrooms
- Heating & cooling: Heating: Other; No central cooling
- Interior features: First-floor bedroom; First-floor full bathroom; Soaking tub; Full basement
Neighborhood map
What this means for you Summary
Snapshot
- This is a 4 × 2-bed/1.0-bath units multifamily listed at $850k.
Deal economics
- At list price, monthly cash flow is $3k ($33k/yr) — positive. Per door: $682/mo.
- The deal already cash-flows at list — no discount required.
- Meets the 1% rule at list price ($10k rent vs $850k).
- Recommended offer: $748k (12.0% below list) — sets the bar for market timing.
- Cap rate 10.1% vs local median 2.6% in New York — top-decile yield for the area; either an underpriced asset or a hidden risk that comps aren't pricing in. Stress-test before assuming the spread holds.
Location & tenants
- Location reads 75/100 on livability (#268 in NY, #4,188 nationally) — a middle-class / working-renter tenant base. Strengths: amenities A+, commute A+, health & safety A; Watch: crime F, cost of living F.
- Market conditions: Rents rising fast (+6.1%/yr); 192 active listings in the ZIP; 10,063 units permitted in Kings County in 2024 (9,789 in 5+ unit buildings).
- At $10,423/mo this rent would consume 201% of the median local household income ($62k/yr) (locally 7574% of renters already pay >50% of income on rent) — very limited rent-growth headroom before tenants either downsize or default.
Forward outlook
- Local home prices are declining (-3.0%/yr); year-one equity from $6k of loan paydown is wiped out by about $25k of value loss. Plan a longer hold.
- Kings County population projected at +13% by 2050 — modest demand growth; plan on rents tracking national, not racing it.
- At projected returns (-3.0% appreciation + 6.1% rent growth), your $238k cash investment doubles in ~7 years — after that, you're playing with house money.
Negotiation context
- It's been on market 168 days — a 12% lower offer ($748k) is reasonable based on typical stale-listing flexibility.
- 3 sale attempts since 17y ago; this cycle's ask has dropped $65k (7%) from the opening price — seller is motivated, your offer sets the floor, not the list.
- Current owner paid $713k; 19% above their basis — modest negotiation headroom, anchor on the comps not their cost.
Risks & watch-outs
- Watch-outs: built in 1930 — expect roof / HVAC / electrical / plumbing capex.
- Climate carrying-cost: major wind risk, 65% chance of damaging wind over 30y; extreme-heat days projected 7→15/yr by 2055 (HVAC capex compounding) — expect insurance premiums to compound above CPI over the hold.
Questions for the listing agent
- It's been on market 168 days. Have you received any prior offers? Is the seller open to a 12% concession, seller financing, or rate buy-down credit?
- Can we see the unit-by-unit rent roll, current vacancy, and any below-market leases? What's the average tenancy length?
- What capital expenditures (roof, boiler, parking lot, exteriors) have been made in the last 5 years, and what's planned in the next 2?
- Built in 1930 — when were the roof, HVAC, electrical panel, plumbing, and water heater last replaced?
- Why hasn't it sold? Are there any deal-killer items the seller is aware of (foundation, flood, title, zoning, code violations)?
- Is there a deadline driving the sale (1031 exchange, divorce, estate, relocation)? That informs how much negotiation room exists.
- Schools are B-rated — typically a magnet for longer-tenancy family renters. What's the average tenant stay here, and is there a school-zone premium baked into asking?
- Crime grade is F in this area — have there been break-ins, vandalism, or insurance claims at this property in the last 3 years? What carrier currently insures it and at what premium?
- What's the average days-on-market for RENTAL listings here right now (not sales)? A rising rental-DOM trend means longer vacancies and softer asking-rent achievability than the comps imply.
- What's the recent tenant-quality profile in this submarket — average credit score on applications, eviction rate, late-payment / NSF rate, and stable-employment percentage? A property-management company in the area should have these aggregated.
- How much new apartment / multifamily construction is in the pipeline within 1–3 miles? Heavy new supply (>2% of stock underway) typically softens rents 12–24 months out; light construction supports rent growth.
Investment metrics
- 1% rule
- 1.23% ✓
- Cap rate
- 10.15%
- Cash-on-cash
- 13.76%
- DSCR
- 1.61
- GRM
- 6.8
CMA / ARV
- ARV (on-the-fly)
- $1,064,912
- Comps found
- 6
Show comp detail 6 sales within ~0.75 mi
| Address | Dist | Beds/Ba | Sqft | Sold | Price | $/sf | Match |
|---|---|---|---|---|---|---|---|
| 894 New Lots Ave | 0.09mi | 8/4.0 | 2,600 (+10%) | 10mo | $744,000 | $286 | 70 |
| 919 Dumont Ave | 0.44mi | 7/4.0 (-1) | 2,320 (-2%) | 18mo | $1,050,000 | $453 | 57 |
| 762 Belmont Ave | 0.39mi | 7/3.0 (-1) | 2,520 (+7%) | 7mo | $1,140,000 | $452 | 56 |
| 304 Sheridan Ave | 0.67mi | 7/5.0 (-1) | 2,340 (-1%) | 19mo | $1,100,000 | $470 | 43 |
| 434 Warwick St | 0.58mi | 7/2.0 (-1) | 2,108 (-10%) | 14mo | $950,000 | $451 | 30 |
| 306 Sheridan Ave | 0.66mi | 8/5.0 | 2,652 (+13%) | 19mo | $1,000,000 | $377 | 28 |
Match score weights: distance 35% · size 25% · config 20% · recency 20%. Top-matched comps best support the ARV.
Projected returns pro-forma
-3.0% appreciation · 6.14% rent growth · sell at horizon
- IRR
- 7.3%
- Equity multiple
- 1.29×
- Total profit
- $69,946
- Equity at exit
- $126,723
- IRR
- 19.1%
- Equity multiple
- 2.82×
- Total profit
- $433,054
- Equity at exit
- $73,484
Cash invested: $237,972 (down + closing). Projections, not guarantees.
Landlord ↔ Tenant lean methodology
- Overall (CITY)
- 0 Strongly Tenant-Friendly
- State New York
- 15 Strongly Tenant-Friendly · D+10
- County
- — inherits STATE
- City New York
- 0 Strongly Tenant-Friendly · D+34
ZIP-level market 11208
- Rents YoY
- 6.1%
- Active inventory
- 192
- Price-to-rent
- 27.2×
Monthly cashflow live
- Estimated rent
- $10,423 medium interval (Pro) →
- Mortgage (P&I)
- −$4,457
- Tax from tax record
- −$695 /mo · $8,337/yr
- Insurance
- −$354
- HOA
- −$0
- Vacancy / Maint / Mgmt
- −$2,189
- Net cashflow
- $2,728
Break-even live
4-unit breakdown (identical units grouped — click to expand)
| Units | Beds | Baths | Est. rent |
|---|---|---|---|
| 4× units | 2 | 1 | $10,424 |
| #1 | 2 | 1 | $2,606 |
| #2 | 2 | 1 | $2,606 |
| #3 | 2 | 1 | $2,606 |
| #4 | 2 | 1 | $2,606 |
| Total (4 units) | $10,423 | ||
UW: 25.0% down · 7.5% · 30yr · 1.5% tax · 5.0% vac · 8.0% maint · 8.0% mgmt
Financing live
Cash to close
- Down payment
- $212,475
- Closing costs
- $25,497
- Reserves months
- —
- Total cash needed
- —
Loan-product check · same deal, 3 products live
Conventional
25% down · 7.5% · 30yr
- Down + closing
- —
- Monthly P&I
- —
- Monthly cashflow
- —
- DSCR
- —
- Eligible?
- —
Personal DTI + credit; lowest rate.
DSCR
20% down · 8.5% · 30yr
- Down + closing
- —
- Monthly P&I
- —
- Monthly cashflow
- —
- DSCR
- —
- Eligible?
- —
No personal income docs; deal must DSCR.
Hard money
10% down · 12.0% · 12mo
- Down + closing
- —
- Monthly P&I
- —
- Monthly cashflow
- —
- DSCR
- —
- Eligible?
- —
Short-term bridge; refi at stabilization.
Listing history 19 events
-
2026-06-18days on market $849,900 Active 168 DOM
-
2026-06-17days on market $849,900 Active 167 DOM
-
2026-06-15days on market $849,900 Active 165 DOM
-
2026-06-13days on market $849,900 Active 163 DOM
-
2026-06-10days on market $849,900 Active 159 DOM
-
2026-06-08days on market $849,900 Active 158 DOM
-
2026-06-04days on market $849,900 Active 154 DOM
-
2026-06-03days on market $849,900 Active 153 DOM
-
2026-06-01days on market $849,900 Active 151 DOM
-
2026-05-31days on market $849,900 Active 150 DOM
-
2026-04-24status Active
-
2026-03-04status Pending
-
2026-01-19price $849,900
-
2025-12-18price $899,900
-
2025-11-10$914,900 Active
-
2010-09-20historical
-
2009-10-28Under Contract
-
2007-08-14soldstatus $713,000
-
2006-10-26soldstatus $466,500
ⓘ Source: listings_history table (triggers on properties + properties_extension) + one-shot
backfill from property_details.listing_events for pre-trigger history.
Tax reassessment forecast NY · Partial reset (capped growth)
- Current annual tax
- $8,337 · $695/mo
- Projected year-2 tax
- $11,350 · $946/mo
- Expected delta
- +$3,013/yr (+$251/mo · 36.1%)
ⓘ Screening estimate from a state-policy table — verify with the county assessor before closing.
Climate risk First Street
- Flood 1/10 Low FEMA zone X (unshaded) · 0% chance over 30 yrs
- Wildfire 1/10 Low
- Heat 7/10 Severe 7 d/yr ≥99°F today · 15 d/yr by 30 yrs out
- Wind 6/10 Major 65% chance of damaging wind over 30 yrs
- Air quality 5/10 Major 6 unhealthy d/yr today · 8 by 30 yrs out
Nearby sold comps map
Loading sold comps map…
Walkable amenities ~0.75 mi
Loading nearby amenities…
Taxation est. · year 1
- Rental income
- $125,076
- − Mortgage interest
- −$47,608
- − Property taxes
- −$8,337
- − Insurance
- −$4,250
- − Repairs & maintenance
- −$10,006
- − Management
- −$10,006
- − Depreciation
- −$24,724
- Taxable income
- $20,146
- Est. tax owed @ 24.0%
- −$4,835
- After-tax cash flow
- $27,905/yr
For passive investors: Depreciation is non-cash, so a rental often shows a tax loss while cash-flowing — sheltering income. Rental losses are passive: they offset passive income freely, and up to $25,000/yr can offset ordinary (W-2) income if you actively participate and your MAGI is under $100k (phasing out to $0 by $150k); unused losses carry forward. On sale, claimed depreciation is recaptured at up to 25%, and gains may owe capital-gains tax (a 1031 exchange can defer both). Figures are a year-1 estimate at your 24.0% rate — not tax advice; consult a CPA.
Schools (NCES district)
No district data.
Livability — New York
- Score
- 75/100
- State rank
- #268
- US rank
- #4188
Category grades
Schools grade is shown separately in the Schools card above.
Census & demographics
- Census place
- New York, NY
- County
- Kings County · 2,614,986 people
- City population
- 7,731,280
- Metro
- New York-Newark-Jersey City, NY-NJ-PA
- Population (ZIP)
- 105,428
- Household income
- $62,077
- Rent vs Own
- Severe rent burden
- 7574.0
Population outlook (Kings County) Hauer SSP2
- Today (2025)
- 2,847,441 people
- By 2030
- 2,937,006 · +3.1%
- By 2040
- 3,095,491 · +8.7%
- By 2050
- 3,228,968 · +13.4%
- By 2075
- 3,321,723 · +16.7%
- By 2100
- 3,111,387 · +9.3%
Race, ethnicity, and origin ACS 2023
- Neighborhood character
- Diverse neighborhood (Simpson 0.66)
- Race & ethnicity
- Black 42% Hispanic / Latino 39% Asian 10% Two or more races 8% White 3%
- Hispanic origin (detail)
- Mexican 2% Puerto Rican 9% Dominican 16%
- Common ancestry
- Hispanic 1%
- Foreign-born
- 40% · Canada, China, Mexico
- Languages at home
- 48% English-only · Spanish 36% Other Indo-European 11% French/Haitian/Cajun 1%
Political lean MEDSL · Kings
- 2024 margin
- Solid D (+44.0) · D 72.0% · R 28.0%
- 2008→2024 swing
- -15.5pp toward R · 2008: 59.4pp · 2024: 44.0pp
- All cycles
- 2024: D+44.0 2020: D+54.8 2016: D+61.8 2012: D+63.9 2008: D+59.4
Not yet ingested
- Civics
- —
Market trends
- HPI YoY
- ▼ -546.38%
- Current HPI
- 376.1489
- Rent YoY
- ▲ 6.14%
- Metro
- New York-Newark-Jersey City, NY-NJ-PA
- State GDP YoY
- ▲ 2.60%
- F500 in state
- 92
Industry mix (Fortune 500 HQ in NY)
| Industry | F500 HQs | Revenue |
|---|---|---|
| Financial Services | 10 | $950B |
|
||
| Consumer Goods | 9 | $162B |
|
||
| Insurance | 4 | $225B |
|
||
| Telecommunications | 2 | $144B |
|
||
| Pharmaceuticals | 2 | $112B |
|
||
| Media / Entertainment | 2 | $69B |
|
||
Price history
+82.2% since first listed9 events — show timeline
- 2026-04-24 Relisted — OneKey® MLS as Distributed by MLS Grid
- 2026-03-04 Pending — OneKey® MLS as Distributed by MLS Grid
- 2026-01-19 Price Changed $849,900 OneKey® MLS as Distributed by MLS Grid
- 2025-12-18 Price Changed $899,900 OneKey® MLS as Distributed by MLS Grid
- 2025-11-10 Listed $914,900 OneKey® MLS as Distributed by MLS Grid
- 2010-09-20 Listing Removed — OneKey® MLS as Distributed by MLS Grid
- 2009-10-28 Listed — OneKey® MLS as Distributed by MLS Grid
- 2007-08-14 Sold (Public Records) $713,000 Public Records
- 2006-10-26 Sold (Public Records) $466,500 Public Records
Property tax history
+1.8%/yrLatest (2025): $8,337 · +6.9% YoY. Source: county tax records.
Cash-flow waterfall
monthlySold comps — $/sqft
last 12 mo · ≤1 miLoading sold comps…