 🏗️ New Construction
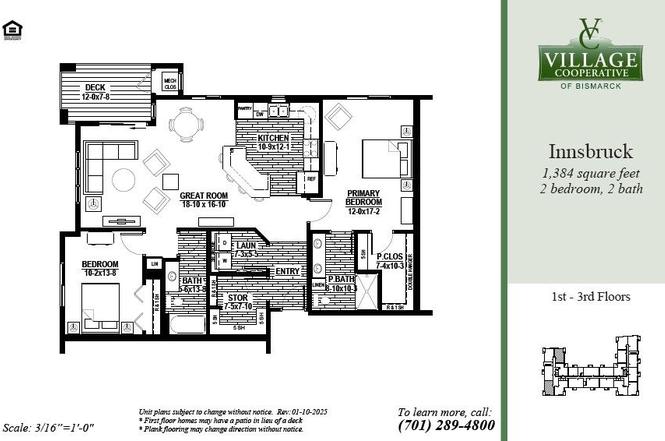
Innsbruck Plan · Bismarck, ND
Flood risk 1/10 · Minimal
- FEMA flood zone
- X
- Chance of flooding over 30 yrs
- 0.0%
- Est. flood insurance / yr
- $508 – $851
Fire risk 3/10 · Minor
- Est. fire insurance / yr
- $1,289 – $2,393
Heat risk 2/10 · Minimal
- Hot days now (above threshold)
- 7 days/yr
- Hot days in 30 yrs
- 12 days/yr
Wind risk No data
- Chance of severe wind over 30 yrs
- —
Air-quality risk 4/10 · Minor
- Unhealthy air days now
- 4 days/yr
- Unhealthy air days in 30 yrs
- 5 days/yr
Risk factors via First Street. Map © Google.
Why this score? — see what drove the F grade
The composite is a weighted blend of 9 inputs, each scored 0–100. Each bar is that input's sub-score; the figure is the points it added to the 100-point composite (weight × sub-score).
- ARV discount +7.5/15.0
- Cash flow +6.9/30.0
- Rent growth +5.0/5.0
- Livability +4.0/5.0
- Schools +3.7/10.0
- 1% rule +1.8/10.0
- DSCR +1.1/10.0
- Condition / age +1.0/5.0
- Appreciation +0.0/10.0
$223,000
🖨 Deal sheet (PDF) 📄 Offer letter ✓ Due diligence
Key facts
- Car wash bay
- In-home storage
- Guest suite
Tags
Property features AI
Finance
- Financial info: List price $223,000
Exterior
- Home design: Plan named Innsbruck; Single-plan new construction (Plan inventory)
- Construction: Built in 2026 (new construction)
- Exterior features: Located at N Washington Street and Medora Ave
Interior
- Bedrooms: 2 bedrooms
- Bathrooms: 2 full bathrooms
- Interior features: Open plan living space
Neighborhood map
What this means for you Summary
Snapshot
- This is a 2-bed/2.0-bath townhouse listed at $223k. Condition is rated poor.
Deal economics
- At list price, monthly cash flow is $-426 ($-5k/yr) — negative.
- To cash-flow at today's rent, offer at most $217k (2.9% below list).
- To meet the 1% rule (rent ≥ 1% of price), the offer needs to be $189k (15.0% below list).
- Recommended offer: $189k (15.0% below list) — sets the bar for 1% rule.
- Cap rate 4.5% vs local median 3.1% in Bismarck — top-decile yield for the area; either an underpriced asset or a hidden risk that comps aren't pricing in. Stress-test before assuming the spread holds.
Location & tenants
- Location reads 79/100 on livability (#5 in ND, #2,213 nationally) — a middle-class / working-renter tenant base. Strengths: housing A+, health & safety A+, cost of living A; Watch: crime C-, amenities D+, commute F.
- Bismarck 1 (urban): math 41% / reading 42% proficiency, ranked #25 of 53 in ND (top 47%) — families likely to look elsewhere, expect single-tenant / working-renter base with shorter leases; only 19% free/reduced lunch — higher-income household profile.
- Zoned schools: Liberty Elementary School (math 57% / reading 49%, grade C, #52 of 236 statewide, top 22%, 496 students, 5% FRL); Horizon Middle School (math 42% / reading 50%, grade D+, #13 of 35 statewide, top 35%, 1,044 students, 14% FRL); Century High School (math 43% / reading 63%, grade C-, #14 of 144 statewide, top 9%, 1,427 students, 12% FRL).
- Market conditions: Rents rising fast (+11.8%/yr); 486 active listings in the ZIP; 7 comparable units currently listed for rent nearby; rentals at typical pace (median 23d on market — plan ~3-4 weeks tenant-placement turnaround); solid renter incomes; 259 units permitted in Burleigh County in 2024 (0 in 5+ unit buildings).
Forward outlook
- Local home prices are declining (-3.0%/yr); year-one equity from $2k of loan paydown is wiped out by about $8k of value loss. Plan a longer hold.
- Burleigh County population projected at +61% by 2050 — long-run rental-demand tailwind backs the buy-and-hold thesis.
Negotiation context
- It's been on market 144 days — a 12% lower offer ($196k) is reasonable based on typical stale-listing flexibility.
Questions for the listing agent
- What do current leases actually rent for vs. the listed asking? Can we see a recent rent roll and the last 12 months of T-12 income?
- It's been on market 144 days. Have you received any prior offers? Is the seller open to a 15% concession, seller financing, or rate buy-down credit?
- Have any recent inspections been done? Can we get a copy of the seller's disclosures and any deferred-maintenance estimates?
- Why hasn't it sold? Are there any deal-killer items the seller is aware of (foundation, flood, title, zoning, code violations)?
- Is there a deadline driving the sale (1031 exchange, divorce, estate, relocation)? That informs how much negotiation room exists.
- Schools are B-rated — typically a magnet for longer-tenancy family renters. What's the average tenant stay here, and is there a school-zone premium baked into asking?
- The area grade is low — what's the realistic commute time and amenity access for the typical tenant pool here? Any planned neighborhood developments (good or bad) we should know about?
- What's the average days-on-market for RENTAL listings here right now (not sales)? A rising rental-DOM trend means longer vacancies and softer asking-rent achievability than the comps imply.
- What's the recent tenant-quality profile in this submarket — average credit score on applications, eviction rate, late-payment / NSF rate, and stable-employment percentage? A property-management company in the area should have these aggregated.
- How much new for-sale + rental construction is in the pipeline within 1–3 miles? Heavy new supply typically softens prices + rents 12–24 months out; constrained supply supports both.
Investment metrics
- 1% rule
- 0.68% ✗
- Cap rate
- 4.46%
- Cash-on-cash
- -6.56%
- DSCR
- 0.71
- GRM
- 12.2
CMA / ARV
- ARV (on-the-fly)
- $278,184
- Comps found
- 12
Show comp detail 12 sales within ~0.75 mi
| Address | Dist | Beds/Ba | Sqft | Sold | Price | $/sf | Match |
|---|---|---|---|---|---|---|---|
| 713 Bremner Ave | 0.63mi | 2/2.0 | 1,334 (-4%) | 1mo | $375,000 | $281 | 64 |
| 4918 Windsor St | 0.69mi | 3/2.5 (+1) | 1,481 (+7%) | 10mo | $309,500 | $209 | 41 |
| 702 Bremner Ave | 0.61mi | 3/2.5 (+1) | 1,584 (+14%) | 1mo | $319,999 | $202 | 39 |
| 810 Bremner Ave | 0.68mi | 3/2.5 (+1) | 1,567 (+13%) | 1mo | $305,000 | $195 | 39 |
| 806 Bremner Ave | 0.66mi | 3/2.5 (+1) | 1,567 (+13%) | 3mo | $305,000 | $195 | 38 |
| 808 Bremner Ave | 0.67mi | 3/2.5 (+1) | 1,586 (+15%) | 0mo | $305,000 | $192 | 37 |
| 804 Bremner Ave | 0.66mi | 3/2.5 (+1) | 1,586 (+15%) | 2mo | $305,000 | $192 | 37 |
| 5307 Normandy St | 0.67mi | 2/2.0 | 1,570 (+13%) | 13mo | $454,900 | $290 | 36 |
| 4207 Serenity Ct | 0.47mi | 3/2.5 (+1) | 1,562 (+13%) | 17mo | $330,000 | $211 | 36 |
| 817 Bremner Ave | 0.71mi | 3/2.5 (+1) | 1,567 (+13%) | 6mo | $315,000 | $201 | 33 |
| 819 Bremner Ave | 0.71mi | 3/2.5 (+1) | 1,586 (+15%) | 5mo | $305,000 | $192 | 32 |
| 4019 Normandy St | 0.75mi | 3/2.5 (+1) | 1,586 (+15%) | 19mo | $302,900 | $191 | 18 |
Match score weights: distance 35% · size 25% · config 20% · recency 20%. Top-matched comps best support the ARV.
Projected returns pro-forma
-3.0% appreciation · 8.0% rent growth · sell at horizon
- IRR
- -22.2%
- Equity multiple
- 0.20×
- Total profit
- $-62,162
- Equity at exit
- $41,478
- IRR
- -7.3%
- Equity multiple
- 0.44×
- Total profit
- $-43,375
- Equity at exit
- $24,052
Cash invested: $77,892 (down + closing). Projections, not guarantees.
Landlord ↔ Tenant lean methodology
- Overall (STATE)
- 82 Strongly Landlord-Friendly
- State North Dakota
- 82 Strongly Landlord-Friendly · R+20
- County
- — inherits STATE
- City
- — inherits STATE
ZIP-level market 58503
- Home prices YoY
- -25.6%
- Rents YoY
- 11.8%
- Active inventory
- 486
- Price-to-rent
- 9.8×
Monthly cashflow live
- Estimated rent
- $1,894 high interval (Pro) →
- Mortgage (P&I)
- −$1,459
- Tax est. 1.5%
- −$348 /mo · $4,173/yr
- Insurance
- −$116
- HOA
- −$0
- Vacancy / Maint / Mgmt
- −$398
- Net cashflow
- $-426
Break-even live
Sensitivity live
| Price | -10% $-234 | -5% $-330 | +0% $-426 | +5% $-522 | +10% $-618 |
|---|---|---|---|---|---|
| Rent | -10% $-576 | -5% $-501 | +0% $-426 | +5% $-351 | +10% $-276 |
| Rate | -1.0pp $-286 | -0.5pp $-355 | base $-426 | +0.5pp $-498 | +1.0pp $-571 |
UW: 25.0% down · 7.5% · 30yr · 1.5% tax · 5.0% vac · 8.0% maint · 8.0% mgmt
Financing live
Cash to close
- Down payment
- $69,546
- Closing costs
- $8,346
- Reserves months
- —
- Total cash needed
- —
Loan-product check · same deal, 3 products live
Conventional
25% down · 7.5% · 30yr
- Down + closing
- —
- Monthly P&I
- —
- Monthly cashflow
- —
- DSCR
- —
- Eligible?
- —
Personal DTI + credit; lowest rate.
DSCR
20% down · 8.5% · 30yr
- Down + closing
- —
- Monthly P&I
- —
- Monthly cashflow
- —
- DSCR
- —
- Eligible?
- —
No personal income docs; deal must DSCR.
Hard money
10% down · 12.0% · 12mo
- Down + closing
- —
- Monthly P&I
- —
- Monthly cashflow
- —
- DSCR
- —
- Eligible?
- —
Short-term bridge; refi at stabilization.
Rent comps 7 comps
| Address | Beds | Baths | Sqft | Rent | $/sqft | DOM | Units | Dist |
|---|---|---|---|---|---|---|---|---|
| 4231 Serenity Ct Bismarck, ND | 3.0 | 2.5 | 1562 | $2,395 | $1.53 | 23d | 1 | 0.47mi |
| 4227 Serenity Ct Bismarck, ND | 3.0 | 2.5 | 1562 | $2,395 | $1.53 | 23d | 1 | 0.47mi |
| 4442 Serenity Ct Bismarck, ND | 3.0 | 2.5 | 1544 | $2,395 | $1.55 | 23d | 1 | 0.48mi |
| 4201 Montreal St Bismarck, ND | 1.0–3.0 | 1.0–2.0 | 1092 | $1,586 | $1.45 | 23d | 15 | 0.55mi |
| 4126A Normandy St Bismarck, ND | 2.0 | 1.5 | 1468 | $1,750 | $1.19 | 23d | 1 | 0.69mi |
| 220 E Greenfield Ln Unit B-402 Bismarck, ND | 2.0 | 2.0 | 1141 | $1,661 | $1.46 | 23d | 1 | 0.81mi |
| 444 E Brandon Dr Bismarck, ND | 2.0–3.0 | 2.0 | 900 | $1,110 | $1.23 | 23d | 1 | 1.16mi |
Listing history 18 events
-
2026-06-21days on market $223,000 Active 144 DOM
-
2026-06-19days on market $223,000 Active 142 DOM
-
2026-06-18days on market $223,000 Active 141 DOM
-
2026-06-17days on market $223,000 Active 140 DOM
-
2026-06-16days on market $223,000 Active 139 DOM
-
2026-06-15days on market $223,000 Active 138 DOM
-
2026-06-14days on market $223,000 Active 136 DOM
-
2026-06-13days on market $223,000 Active 135 DOM
-
2026-06-10days on market $223,000 Active 133 DOM
-
2026-06-09days on market $223,000 Active 132 DOM
-
2026-06-08days on market $223,000 Active 131 DOM
-
2026-06-07days on market $223,000 Active 130 DOM
-
2026-06-05days on market $223,000 Active 127 DOM
-
2026-06-03days on market $223,000 Active 126 DOM
-
2026-06-02days on market $223,000 Active 125 DOM
-
2026-06-01days on market $223,000 Active 124 DOM
-
2026-05-31days on market $223,000 Active 123 DOM
-
2026-05-30days on market $223,000 Active 122 DOM
ⓘ Source: listings_history table (triggers on properties + properties_extension) + one-shot
backfill from property_details.listing_events for pre-trigger history.
Climate risk First Street
- Flood 1/10 Low FEMA zone X · 0% chance over 30 yrs
- Wildfire 3/10 Moderate
- Heat 2/10 Low
- Air quality 4/10 Moderate 4 unhealthy d/yr today · 5 by 30 yrs out
Nearby sold comps map
Loading sold comps map…
Walkable amenities ~0.75 mi
Loading nearby amenities…
Taxation est. · year 1
- Rental income
- $22,733
- − Mortgage interest
- −$15,583
- − Property taxes
- −$4,173
- − Insurance
- −$1,391
- − Repairs & maintenance
- −$1,819
- − Management
- −$1,819
- − Depreciation
- −$8,093
- Taxable loss
- −$10,143
- Est. tax savings @ 24.0%
- +$2,434
- After-tax cash flow
- $-2,676/yr
For passive investors: Depreciation is non-cash, so a rental often shows a tax loss while cash-flowing — sheltering income. Rental losses are passive: they offset passive income freely, and up to $25,000/yr can offset ordinary (W-2) income if you actively participate and your MAGI is under $100k (phasing out to $0 by $150k); unused losses carry forward. On sale, claimed depreciation is recaptured at up to 25%, and gains may owe capital-gains tax (a 1031 exchange can defer both). Figures are a year-1 estimate at your 24.0% rate — not tax advice; consult a CPA.
Condition & rehab AI · 2 photos
This property requires extensive renovation and updates across all systems and areas, with a focus on exterior and interior improvements to significantly enhance its resale and rental value.
Repairs flagged
- Major roof — No visible roof structure or condition.
- Major exterior — No visible siding or paint condition.
- Major flooring — No visible flooring condition.
- Major interior walls/paint — No visible interior walls or paint condition.
- Major bathrooms — No visible bathrooms.
- Major kitchen — No visible kitchen.
- Major systems — No visible HVAC/mechanicals.
- Major landscaping/curb appeal — No visible landscaping or curb appeal.
- Major foundation/structure — No visible foundation or structure condition.
Value-add opportunities
- Both extensive exterior renovation — A fresh exterior renovation would significantly improve curb appeal and overall property value.
- Both interior updates — Updating interior walls, paint, and fixtures would enhance the home's livability and aesthetic appeal.
- Both landscaping and curb appeal — A well-maintained landscape and curb appeal would attract potential buyers and renters.
- Both HVAC and mechanical upgrades — Upgrading HVAC and mechanical systems would improve comfort and energy efficiency, increasing both resale and rental value.
- Both kitchen and bathroom updates — Modernizing the kitchen and bathrooms would make the home more desirable and increase its value for both buyers and renters.
Renovation cost estimate screening
| Repair item | Severity | Est. cost |
|---|---|---|
| roof · No visible roof structure or condition. | Major | $15,000–50,000 |
| exterior · No visible siding or paint condition. | Major | $15,000–50,000 |
| flooring · No visible flooring condition. | Major | $15,000–50,000 |
| interior walls/paint · No visible interior walls or paint condition. | Major | $15,000–50,000 |
| bathrooms · No visible bathrooms. | Major | $15,000–50,000 |
| kitchen · No visible kitchen. | Major | $15,000–50,000 |
| systems · No visible HVAC/mechanicals. | Major | $15,000–50,000 |
| landscaping/curb appeal · No visible landscaping or curb appeal. | Major | $15,000–50,000 |
| foundation/structure · No visible foundation or structure condition. | Major | $15,000–50,000 |
| Total estimated repair cost · 9 items | $135,000–450,000 |
Value-add ROI direction
- Both extensive exterior renovation — A fresh exterior renovation would significantly improve curb appeal and overall property value. ↑
- Both interior updates — Updating interior walls, paint, and fixtures would enhance the home's livability and aesthetic appeal. ↑
- Both landscaping and curb appeal — A well-maintained landscape and curb appeal would attract potential buyers and renters. ↑
- Both HVAC and mechanical upgrades — Upgrading HVAC and mechanical systems would improve comfort and energy efficiency, increasing both resale and rental value. ↑
- Both kitchen and bathroom updates — Modernizing the kitchen and bathrooms would make the home more desirable and increase its value for both buyers and renters. ↑
ⓘ Cost ranges are severity-bucket heuristics (US national rule-of-thumb). Get contractor quotes + a written scope before underwriting a rehab budget.
Schools (NCES district)
- District
- Bismarck 1
- NCES district ID
- 3800014
- Math proficiency
- 41% ▼ -5.00%
- Reading proficiency
- 42% ▼ -6.00%
- Median HH income
- $60,649
- Composite
- 36.76/100
- National rank
- #4577
- State rank
- #25 of 53 in ND
Livability — Bismarck
- Score
- 79/100
- State rank
- #5
- US rank
- #2213
Category grades
Schools grade is shown separately in the Schools card above.
Census & demographics
- Census place
- Bismarck, ND
- County
- Burleigh County · 97,300 people
- City population
- 97,300
- Metro
- Bismarck, ND
- Population (ZIP)
- 37,683
- Household income
- $102,333
- Rent vs Own
- Severe rent burden
- 814.0
Population outlook (Burleigh County) Hauer SSP2
- Today (2025)
- 119,359 people
- By 2030
- 133,047 · +11.5%
- By 2040
- 161,545 · +35.3%
- By 2050
- 191,960 · +60.8%
- By 2075
- 274,569 · +130.0%
- By 2100
- 350,910 · +194.0%
Race, ethnicity, and origin ACS 2023
- Neighborhood character
- Predominantly White (89%)
- Race & ethnicity
- White 89% Two or more races 6% Hispanic / Latino 2% Asian 2% Black 1%
- Common ancestry
- Portuguese 17% Scotch-Irish 4% Scottish 2%
- Foreign-born
- 3% · Canada
- Languages at home
- 95% English-only · German/W. Germanic 2% Spanish 1% Tagalog/Filipino 1%
Political lean MEDSL · Burleigh
- 2024 margin
- Solid R (+43.2) · D 27.5% · R 70.7% · Other 1.8%
- 2008→2024 swing
- -19.7pp toward R · 2008: -23.6pp · 2024: -43.2pp
- All cycles
- 2024: R+43.2 2020: R+40.2 2016: R+46.1 2012: R+32.1 2008: R+23.6
Not yet ingested
- Civics
- —
Market trends
- HPI YoY
- ▼ -76.96%
- Current HPI
- 223.9683
- Rent YoY
- ▲ 11.79%
- Metro
- Bismarck, ND
- State GDP YoY
- ▲ 2.09%
- F500 in state
- 2
Industry mix (Fortune 500 HQ in ND)
| Industry | F500 HQs | Revenue |
|---|---|---|
| Utilities / Construction | 1 | $6B |
|
||
Cash-flow waterfall
monthlySold comps — $/sqft
last 12 mo · ≤1 miLoading sold comps…