28700 Trails Edge Blvd #203 · Bonita Springs, FL
Flood risk 5/10 · Moderate
- FEMA flood zone
- X (shaded)
- Chance of flooding over 30 yrs
- 0.5%
- Est. flood insurance / yr
- $507 – $1,088
Fire risk 2/10 · Minimal
- Est. fire insurance / yr
- $947 – $1,759
Heat risk 10/10 · Severe
- Hot days now (above 107°F)
- 7 days/yr
- Hot days in 30 yrs
- 30 days/yr
Wind risk 10/10 · Severe
- Chance of severe wind over 30 yrs
- 99.0%
Air-quality risk 2/10 · Minimal
- Unhealthy air days now
- 1 days/yr
- Unhealthy air days in 30 yrs
- 1 days/yr
Risk factors via First Street. Map © Google.
Why this score? — see what drove the B grade
The composite is a weighted blend of 9 inputs, each scored 0–100. Each bar is that input's sub-score; the figure is the points it added to the 100-point composite (weight × sub-score).
- Cash flow +30.0/30.0
- 1% rule +10.0/10.0
- DSCR +10.0/10.0
- ARV discount +7.5/15.0
- Schools +4.1/10.0
- Livability +3.5/5.0
- Rent growth +3.2/5.0
- Condition / age +2.5/5.0
- Appreciation +0.0/10.0
$300,000
🖨 Deal sheet (PDF) 📄 Offer letter ✓ Due diligence
Listing remarks
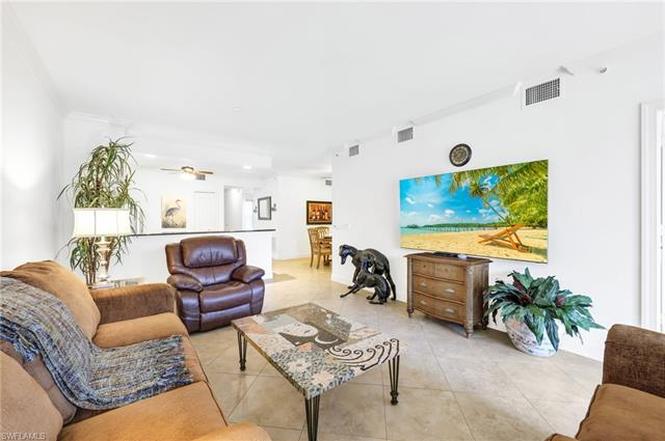
RARELY - TURNKEY - GORGEOUS - WEST OF US 41 - Beautifully updated 3 Bedroom, 2 Bath condo in the desirable Carlysle, offered fully furnished and ready for immediate enjoyment. This immaculate residence features: an Open Floor Plan, Upgraded Kitchen Cabinetry with Gorgeous Countertops, Crown Molding and High Baseboards, Stainless Steel Appliances, Recessed Lighting and Updated Fans/Lighting, All Walk In Closets, Tray Ceiling & Upgraded Bathrooms with High-profile sinks. The spacious primary suite includes a comfortable king bed, while the guest bedroom offers a queen bed. The 3rd/Den provides extra flex space for an office, reading room, or overflow for your guests. The Carlysle amenit
Key facts
- Open floor plan
- Tray ceiling
- Walk in closets
Tags
Property features AI
Finance
- HOA & community: Mandatory HOA with professional management; Quarterly condo fee; Condo fee: $1,707.70 (quarterly); Total annual recurring fees: $6,832; Total one-time fees: $150; HOA maintenance covers cable, insurance, irrigation water, lawn/land maintenance, legal/accounting, manager, master association fee, exterior pest control, recreation facilities, reserves, sewer, trash removal, and water; Community amenities include BBQ/picnic area, bike and jog path, bike storage, community pool, and underground utilities; Non-gated community
Exterior
- Parking: 1 assigned parking space; Guest parking available; Under-building open parking; Attached 1-car carport
- Security: Storm protection with impact-resistant doors and windows; Smoke detectors
- Utilities: Central water; Central sewer; Cable available
- Home design: Residential mid-rise building (4–7 stories); Zero lot line; Rear exposure faces west; Built in 2007; Development: WOODS EDGE (THE CARLYSLE)
- Construction: Concrete block construction; Built-up or flat roof
- Exterior features: Deck; Impact-resistant doors; Impact-resistant windows; Stucco exterior
Interior
- Kitchen: Pantry; Dishwasher; Disposal; Microwave; Range; Refrigerator; Self-cleaning oven
- Bedrooms: 3 bedrooms; Split bedroom layout
- Flooring: Carpet; Tile
- Bathrooms: 2 full bathrooms; Master bath with dual sinks and shower (no tub)
- Heating & cooling: Central electric heat; Central electric cooling; Ceiling fans
- Interior features: French doors; High-speed internet available; Pantry; Smoke detectors; Volume ceilings; Walk-in closet; Window coverings; Laundry in residence; Screened lanai/porch; Common elevator; Furnished
- Laundry & utility: Washer and dryer included
Neighborhood map
What this means for you Summary
Snapshot
- This is a 3-bed/2.0-bath condo listed at $300k.
Deal economics
- At list price, monthly cash flow is $2k ($27k/yr) — positive.
- The deal already cash-flows at list — no discount required.
- Meets the 1% rule at list price ($6k rent vs $300k).
- Recommended offer: $264k (12.0% below list) — sets the bar for market timing.
- Cap rate 15.4% vs local median 1.7% in Bonita Springs — top-decile yield for the area; either an underpriced asset or a hidden risk that comps aren't pricing in. Stress-test before assuming the spread holds.
Location & tenants
- Location reads 70/100 on livability (#428 in FL) — a middle-class / working-renter tenant base. Strengths: crime A+, housing A+, employment A; Watch: cost of living C-, health & safety D, amenities F.
- Lee (suburban): math 47% / reading 50% proficiency, ranked #42 of 73 in FL (top 58%) — families likely to look elsewhere, expect single-tenant / working-renter base with shorter leases.
- Zoned schools: Pinewoods Elementary School (math 81% / reading 74%, grade A, #163 of 2,144 statewide, top 8%, 1,089 students, 25% FRL); Lexington Middle School (math 55% / reading 54%, grade B-, #183 of 571 statewide, top 34%, 1,138 students, 44% FRL); South Fort Myers High School (math 23% / reading 30%, grade F, #489 of 667 statewide, top 74%, 1,917 students, 50% FRL) — zoned schools average 39% FRL vs 57% district-wide (18 pts lower); this property's tenant base skews higher-income than the district average.
- Market conditions: Rents rising (+2.9%/yr); 700 active listings in the ZIP; 40 comparable units currently listed for rent nearby; rentals at typical pace (median 26d on market — plan ~3-4 weeks tenant-placement turnaround); high-income renter base; 15,411 units permitted in Lee County in 2024 (4,686 in 5+ unit buildings).
- At $5,893/mo this rent would consume 54% of the median local household income ($131k/yr) (locally 554% of renters already pay >50% of income on rent) — very limited rent-growth headroom before tenants either downsize or default.
Forward outlook
- Local home prices are declining (-3.0%/yr); year-one equity from $2k of loan paydown is wiped out by about $9k of value loss. Plan a longer hold.
- Lee County population projected at +44% by 2050 — long-run rental-demand tailwind backs the buy-and-hold thesis.
- At projected returns (-3.0% appreciation + 2.9% rent growth), your $84k cash investment doubles in ~4 years — after that, you're playing with house money.
Negotiation context
- It's been on market 150 days — a 12% lower offer ($264k) is reasonable based on typical stale-listing flexibility.
- 3 sale attempts; this cycle's ask is 6283% above the opening price — seller raised mid-cycle; expect resistance to lowballs.
Risks & watch-outs
- Climate carrying-cost: moderate flood risk; severe wind risk, 99% chance of damaging wind over 30y; extreme-heat days projected 7→30/yr by 2055 (HVAC capex compounding) — expect insurance premiums to compound above CPI over the hold.
Questions for the listing agent
- It's been on market 150 days. Have you received any prior offers? Is the seller open to a 12% concession, seller financing, or rate buy-down credit?
- What does the HOA fee cover, when was the last increase, and are there any pending special assessments or reserve-fund shortfalls?
- Any open or pending special assessments — roof, HVAC, plumbing, elevator, façade? What's the per-unit balance and payoff schedule, and is the seller paying it off at close or rolling it to the buyer?
- Why hasn't it sold? Are there any deal-killer items the seller is aware of (foundation, flood, title, zoning, code violations)?
- Is there a deadline driving the sale (1031 exchange, divorce, estate, relocation)? That informs how much negotiation room exists.
- What's the average days-on-market for RENTAL listings here right now (not sales)? A rising rental-DOM trend means longer vacancies and softer asking-rent achievability than the comps imply.
- What's the recent tenant-quality profile in this submarket — average credit score on applications, eviction rate, late-payment / NSF rate, and stable-employment percentage? A property-management company in the area should have these aggregated.
- How much new apartment / multifamily construction is in the pipeline within 1–3 miles? Heavy new supply (>2% of stock underway) typically softens rents 12–24 months out; light construction supports rent growth.
Investment metrics
- 1% rule
- 1.96% ✓
- Cap rate
- 15.38%
- Cash-on-cash
- 32.45%
- DSCR
- 2.44
- GRM
- 4.2
CMA / ARV
No comps found within radius.
Projected returns pro-forma
-3.0% appreciation · 2.85% rent growth · sell at horizon
- IRR
- 27.4%
- Equity multiple
- 2.14×
- Total profit
- $95,432
- Equity at exit
- $44,731
- IRR
- 34.8%
- Equity multiple
- 4.18×
- Total profit
- $266,869
- Equity at exit
- $25,939
Cash invested: $84,000 (down + closing). Projections, not guarantees.
Landlord ↔ Tenant lean methodology
- Overall (STATE)
- 87 Strongly Landlord-Friendly
- State Florida
- 87 Strongly Landlord-Friendly · R+3
- County
- — inherits STATE
- City
- — inherits STATE
ZIP-level market 34134
- Rents YoY
- 2.9%
- Active inventory
- 700
- Price-to-rent
- 4.2×
Monthly cashflow live
- Estimated rent
- $5,893 high interval (Pro) →
- Mortgage (P&I)
- −$1,573
- Tax from tax record
- −$117 /mo · $1,407/yr
- Insurance
- −$125
- HOA
- −$569
- Lot rent
- −$0
- Vacancy / Maint / Mgmt
- −$1,238
- Net cashflow
- $2,271
Break-even live
Sensitivity live
| Price | -10% $2,441 | -5% $2,356 | +0% $2,271 | +5% $2,186 | +10% $2,101 |
|---|---|---|---|---|---|
| Rent | -10% $1,806 | -5% $2,038 | +0% $2,271 | +5% $2,504 | +10% $2,737 |
| Rate | -1.0pp $2,422 | -0.5pp $2,347 | base $2,271 | +0.5pp $2,193 | +1.0pp $2,114 |
UW: 25.0% down · 7.5% · 30yr · 1.5% tax · 5.0% vac · 8.0% maint · 8.0% mgmt
Financing live
Cash to close
- Down payment
- $75,000
- Closing costs
- $9,000
- Reserves months
- —
- Total cash needed
- —
Loan-product check · same deal, 3 products live
Conventional
25% down · 7.5% · 30yr
- Down + closing
- —
- Monthly P&I
- —
- Monthly cashflow
- —
- DSCR
- —
- Eligible?
- —
Personal DTI + credit; lowest rate.
DSCR
20% down · 8.5% · 30yr
- Down + closing
- —
- Monthly P&I
- —
- Monthly cashflow
- —
- DSCR
- —
- Eligible?
- —
No personal income docs; deal must DSCR.
Hard money
10% down · 12.0% · 12mo
- Down + closing
- —
- Monthly P&I
- —
- Monthly cashflow
- —
- DSCR
- —
- Eligible?
- —
Short-term bridge; refi at stabilization.
Rent comps 40 comps
| Address | Beds | Baths | Sqft | Rent | $/sqft | DOM | Units | Dist |
|---|---|---|---|---|---|---|---|---|
| 28700 Trails Edge Blvd Bonita Springs, FL | 3.0 | 2.0 | 1458 | $2,175 | $1.49 | 5d | 2 | 0.03mi |
| 28611 Carriage Home Dr #101 Bonita Springs, FL | 2.0 | 2.0 | 1433 | $2,550 | $1.78 | 26d | 1 | 0.17mi |
| 28650 Carriage Home Dr Unit 1049692P Bonita Springs, FL | 3.0 | 2.0 | 1528 | $3,980 | $2.60 | 18d | 1 | 0.19mi |
| 1345 Sweetwater Cv #203 Naples, FL | 2.0 | 2.0 | 1279 | $4,800 | $3.75 | 25d | 1 | 0.26mi |
| 28790 Versol Dr Bonita Springs, FL | 1.0–3.0 | 1.0–2.0 | 1075 | $3,391 | $3.15 | 4d | 19 | 0.26mi |
| 1340 Sweetwater Cv #103 Naples, FL | 2.0 | 2.0 | 1279 | $5,000 | $3.91 | 25d | 1 | 0.26mi |
| 28452 Del Lago Way Bonita Springs, FL | 4.0 | 3.0 | 2201 | $7,700 | $3.50 | 26d | 1 | 0.28mi |
| 1325 Sweetwater Cv #201 Naples, FL | 3.0 | 2.0 | 1381 | $6,000 | $4.34 | 25d | 1 | 0.30mi |
| 1415 Sweetwater Cv #104 Naples, FL | 3.0 | 2.0 | 1381 | $6,500 | $4.71 | 25d | 1 | 0.31mi |
| 1360 Sweetwater Cv #202 Naples, FL | 2.0 | 2.0 | 1279 | $5,500 | $4.30 | 25d | 1 | 0.32mi |
| 1420 Sweetwater Cv #102 Naples, FL | 2.0 | 2.0 | 1279 | $5,000 | $3.91 | 23d | 1 | 0.32mi |
| 1420 Sweetwater Cv #102 Naples, FL | 2.0 | 2.0 | 1279 | $5,000 | $3.91 | 25d | 1 | 0.32mi |
| 1405 Sweetwater Cv #204 Naples, FL | 3.0 | 2.0 | 1381 | $6,000 | $4.34 | 25d | 1 | 0.33mi |
| 1405 Sweetwater Cv #204 Naples, FL | 3.0 | 2.0 | 1381 | $6,000 | $4.34 | 16d | 1 | 0.33mi |
| 28327 Hidden Lake Dr Bonita Springs, FL | 3.0 | 2.0 | 1567 | $8,950 | $5.71 | 26d | 1 | 0.33mi |
| 28070 Winthrop Cir Bonita Springs, FL | 3.0 | 3.0 | 2008 | $12,000 | $5.98 | 26d | 1 | 0.34mi |
| 1390 Sweetwater Cv #203 Naples, FL | 2.0 | 2.0 | 1279 | $2,200 | $1.72 | 16d | 1 | 0.37mi |
| 28211 Winthrop Cir Bonita Springs, FL | 3.0 | 2.0 | 1918 | $10,500 | $5.47 | 26d | 1 | 0.37mi |
| 1117 Sweetwater Ln #2201 Naples, FL | 2.0 | 2.0 | 1193 | $6,500 | $5.45 | 25d | 1 | 0.44mi |
| 1214 Sweetwater Ln #2306 Naples, FL | 2.0 | 2.0 | 1378 | $6,500 | $4.72 | 25d | 1 | 0.49mi |
| 28450 Winthrop Cir Unit 1546014P Bonita Springs, FL | 3.0 | 2.0 | 1894 | $7,804 | $4.12 | 16d | 1 | 0.54mi |
| 9021 Las Maderas Dr #202 Bonita Springs, FL | 2.0 | 2.0 | 1674 | $7,500 | $4.48 | 26d | 1 | 0.59mi |
| 1250 Silverstrand Dr Naples, FL | 3.0 | 2.0 | 1848 | $5,000 | $2.71 | 25d | 1 | 0.59mi |
| 28712 Carmel Way Bonita Springs, FL | 3.0 | 2.5 | 1626 | $9,250 | $5.69 | 26d | 1 | 0.60mi |
| 9030 Las Maderas Dr #101 Bonita Springs, FL | 2.0 | 2.0 | 1432 | $2,500 | $1.75 | 26d | 1 | 0.62mi |
| 9050 Las Maderas Dr #101 Bonita Springs, FL | 2.0 | 2.0 | 1364 | $2,100 | $1.54 | 26d | 1 | 0.64mi |
| 9111 Las Maderas Dr #102 Bonita Springs, FL | 2.0 | 2.0 | 1624 | $7,500 | $4.62 | 26d | 1 | 0.64mi |
| 3620 Bailes St Bonita Springs, FL | 3.0 | 3.0 | 1992 | $12,000 | $6.02 | 26d | 1 | 0.65mi |
| 9855 Costa Mesa Ln #403 Bonita Springs, FL | 2.0 | 2.0 | 1146 | $1,600 | $1.40 | 26d | 1 | 0.65mi |
| 3921 Leeward Passage Ct #203 Bonita Springs, FL | 2.0 | 2.0 | 1204 | $3,500 | $2.91 | 26d | 1 | 0.65mi |
| 9851 Costa Mesa Ln Unit 1546344P Bonita Springs, FL | 2.0 | 2.0 | 1194 | $1,935 | $1.62 | 18d | 1 | 0.65mi |
| 8981 Palmas Grandes Blvd #102 Bonita Springs, FL | 2.0 | 2.0 | 1791 | $7,500 | $4.19 | 26d | 1 | 0.68mi |
| 14907 Sterling Oaks Dr Naples, FL | 3.0 | 3.0 | 1760 | $6,500 | $3.69 | 25d | 1 | 0.69mi |
| 3941 Leeward Passage Ct #203 Bonita Springs, FL | 2.0 | 2.0 | 1204 | $2,000 | $1.66 | 26d | 1 | 0.70mi |
| 8990 Palmas Grandes Blvd #201 Bonita Springs, FL | 2.0 | 2.0 | 1797 | $5,000 | $2.78 | 26d | 1 | 0.72mi |
| 28720 Bermuda Bay Way #205 Bonita Springs, FL | 2.0 | 2.0 | 1097 | $2,200 | $2.01 | 17d | 1 | 0.72mi |
| 28940 Bermuda Pointe Cir #102 Bonita Springs, FL | 2.0 | 2.0 | 1076 | $5,500 | $5.11 | 26d | 1 | 0.73mi |
| 3930 Windward Passage Cir #202 Bonita Springs, FL | 2.0 | 2.0 | 1478 | $1,900 | $1.29 | 18d | 1 | 0.74mi |
| 28052 Palmas Grandes Ln #101 Bonita Springs, FL | 2.0 | 2.0 | 1500 | $7,200 | $4.80 | 26d | 1 | 0.74mi |
| 3951 Windward Passage Cir #102 Bonita Springs, FL | 2.0 | 2.0 | 1397 | $5,200 | $3.72 | 26d | 1 | 0.76mi |
HOA detail condo
- Monthly dues
- $569 · $6,828/yr
- Assessments
- None detected in remarks — confirm with the listing agent.
Listing history 19 events
-
2026-06-22days on market $300,000 Active 150 DOM
-
2026-06-22days on market $300,000 Active 149 DOM
-
2026-06-17days on market $300,000 Active 145 DOM
-
2026-06-16days on market $300,000 Active 144 DOM
-
2026-06-15days on market $300,000 Active 143 DOM
-
2026-06-13days on market $300,000 Active 141 DOM
-
2026-06-10days on market $300,000 Active 138 DOM
-
2026-06-09days on market $300,000 Active 137 DOM
-
2026-06-07days on market $300,000 Active 135 DOM
-
2026-06-02days on market $300,000 Active 130 DOM
-
2026-06-01days on market $300,000 Active 129 DOM
-
2026-06-01days on market $300,000 Active 128 DOM
-
2026-04-30price $300,000
-
2026-04-30historical $4,700
-
2026-01-27$4,700
-
2026-01-27historical $4,700
-
2026-01-23$339,000 Active
-
2025-12-25$4,700
-
2010-05-28soldstatus $4,223,100
ⓘ Source: listings_history table (triggers on properties + properties_extension) + one-shot
backfill from property_details.listing_events for pre-trigger history.
Tax reassessment forecast FL · Resets to sale price
- Current annual tax
- $1,407 · $117/mo
- Projected year-2 tax
- $2,490 · $208/mo
- Expected delta
- +$1,083/yr (+$90/mo · 77.0%)
ⓘ Screening estimate from a state-policy table — verify with the county assessor before closing.
Climate risk First Street
- Flood 5/10 Major FEMA zone X (shaded) · 50% chance over 30 yrs
- Wildfire 2/10 Low
- Heat 10/10 Extreme 7 d/yr ≥107°F today · 30 d/yr by 30 yrs out
- Wind 10/10 Extreme 99% chance of damaging wind over 30 yrs
- Air quality 2/10 Low 1 unhealthy d/yr today · 1 by 30 yrs out
Nearby sold comps map
Loading sold comps map…
Walkable amenities ~0.75 mi
Loading nearby amenities…
Taxation est. · year 1
- Rental income
- $70,719
- − Mortgage interest
- −$16,805
- − Property taxes
- −$1,407
- − Insurance
- −$1,500
- − Repairs & maintenance
- −$5,657
- − Management
- −$5,657
- − HOA
- −$6,828
- − Depreciation
- −$8,727
- Taxable income
- $24,137
- Est. tax owed @ 24.0%
- −$5,793
- After-tax cash flow
- $21,461/yr
For passive investors: Depreciation is non-cash, so a rental often shows a tax loss while cash-flowing — sheltering income. Rental losses are passive: they offset passive income freely, and up to $25,000/yr can offset ordinary (W-2) income if you actively participate and your MAGI is under $100k (phasing out to $0 by $150k); unused losses carry forward. On sale, claimed depreciation is recaptured at up to 25%, and gains may owe capital-gains tax (a 1031 exchange can defer both). Figures are a year-1 estimate at your 24.0% rate — not tax advice; consult a CPA.
Schools (NCES district)
- District
- Lee
- NCES district ID
- 1201080
- Math proficiency
- 47% ▼ -11.00%
- Reading proficiency
- 50% ▼ -4.00%
- Median HH income
- $49,518
- Composite
- 41.49/100
- National rank
- #3458
- State rank
- #42 of 73 in FL
Livability — Bonita Springs
- Score
- 70/100
- State rank
- #428
- US rank
- #7576
Category grades
Schools grade is shown separately in the Schools card above.
Census & demographics
- Census place
- Bonita Springs, FL
- County
- Lee County · 788,662 people
- City population
- 64,727
- Metro
- Cape Coral-Fort Myers, FL
- Population (ZIP)
- 16,475
- Household income
- $130,719
- Rent vs Own
- Severe rent burden
- 554.0
Population outlook (Lee County) Hauer SSP2
- Today (2025)
- 871,946 people
- By 2030
- 955,468 · +9.6%
- By 2040
- 1,113,587 · +27.7%
- By 2050
- 1,256,891 · +44.1%
- By 2075
- 1,560,270 · +78.9%
- By 2100
- 1,726,848 · +98.0%
Race, ethnicity, and origin ACS 2023
- Neighborhood character
- Predominantly White (91%)
- Race & ethnicity
- White 91% Hispanic / Latino 5% Two or more races 3% Asian 1%
- Common ancestry
- Slovak 5% Romanian 4% Serbian 2%
- Foreign-born
- 10% · Canada, Jamaica
- Languages at home
- 91% English-only · Spanish 4% German/W. Germanic 1% Other Indo-European 1%
Political lean MEDSL · Lee
- 2024 margin
- Strong R (+28.4) · D 35.5% · R 63.9%
- 2008→2024 swing
- -18.0pp toward R · 2008: -10.4pp · 2024: -28.4pp
- All cycles
- 2024: R+28.4 2020: R+19.2 2016: R+20.4 2012: R+16.6 2008: R+10.4
Not yet ingested
- Civics
- —
Market trends
- HPI YoY
- ▼ -236.48%
- Current HPI
- 237.4416
- Rent YoY
- ▲ 2.85%
- Metro
- Cape Coral-Fort Myers, FL
- State GDP YoY
- ▲ 3.28%
- F500 in state
- 36
Industry mix (Fortune 500 HQ in FL)
| Industry | F500 HQs | Revenue |
|---|---|---|
| Industrial Technology | 2 | $29B |
|
||
| Insurance | 2 | $17B |
|
||
| Retail | 1 | $60B |
|
||
| Technology Distribution | 1 | $58B |
|
||
| Homebuilding | 1 | $35B |
|
||
| Technology Manufacturing | 1 | $35B |
|
||
Price history
-92.9% since first listed7 events — show timeline
- 2026-04-30 Price Changed $300,000 NAPLESMLS
- 2026-04-30 Rental Removed $4,700 FGCMLS
- 2026-01-27 Listed for Rent $4,700 FGCMLS
- 2026-01-27 Rental Removed $4,700 NAPLESMLS
- 2026-01-23 Listed $339,000 NAPLESMLS
- 2025-12-25 Listed for Rent $4,700 NAPLESMLS
- 2010-05-28 Sold (Public Records) $4,223,100 Public Records
Property tax history
+0.1%/yrLatest (2025): $1,407 · +3.7% YoY. Source: county tax records.
Cash-flow waterfall
monthlySold comps — $/sqft
last 12 mo · ≤1 miLoading sold comps…