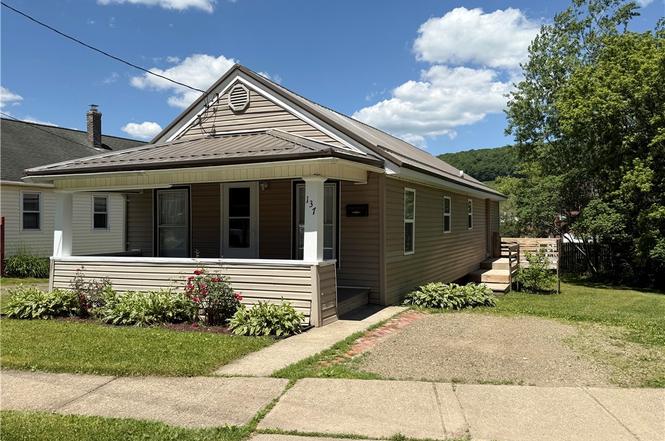
137 Rockland Ave · Bradford, PA
Flood risk 1/10 · Minimal
- FEMA flood zone
- X (unshaded)
- Chance of flooding over 30 yrs
- 0.0%
- Est. flood insurance / yr
- $473 – $860
Fire risk 1/10 · Minimal
- Est. fire insurance / yr
- $511 – $949
Heat risk 2/10 · Minimal
- Hot days now (above 89°F)
- 8 days/yr
- Hot days in 30 yrs
- 18 days/yr
Wind risk 1/10 · Minimal
- Chance of severe wind over 30 yrs
- —
Air-quality risk 1/10 · Minimal
- Unhealthy air days now
- 0 days/yr
- Unhealthy air days in 30 yrs
- 0 days/yr
Risk factors via First Street. Map © Google.
Why this score? — see what drove the D grade
The composite is a weighted blend of 9 inputs, each scored 0–100. Each bar is that input's sub-score; the figure is the points it added to the 100-point composite (weight × sub-score).
- Cash flow +14.9/30.0
- ARV discount +7.5/15.0
- DSCR +4.6/10.0
- Schools +4.2/10.0
- 1% rule +4.0/10.0
- Livability +3.5/5.0
- Rent growth +2.5/5.0
- Condition / age +2.5/5.0
- Appreciation +0.0/10.0
$89,900
🖨 Deal sheet (PDF) 📄 Offer letter ✓ Due diligence
Listing remarks
Welcome to the convenience of first-floor living! Many updates have already been made for you, creating a warm, comfortable atmosphere throughout this home. Special attention has been given to the design of the custom-built, spacious, modern kitchen, which features appliances and ample cabinet and countertop space. Adjacent to the kitchen, you'll find a bedroom that offers a large walk-in closet. There is also a full bath and a designated laundry room equipped with a washer, dryer, cabinets, and a storage closet. Enjoy the open concept of the formal dining room and living room, providing plenty of space for gatherings and entertainment. A second bedroom with a closet is conveniently located
Key facts
- Covered front porch
- Custom built kitchen
- First floor living
Tags
Property features AI
Exterior
- Parking: No garage; Driveway parking
- Utilities: Electricity connected; Public water connected; Sewer connected
- Home design: Single-story home; Resale property; Metal roof
- Construction: Vinyl siding; Attic/crawl hatchway(s) insulated; Block foundation; Existing (year built details)
- Exterior features: Covered porch and open deck; Deck; Fence (partial); Gravel driveway
Interior
- Kitchen: Free-standing range; Oven; Refrigerator
- Bedrooms: 2 main-level bedrooms; Bedroom on main level
- Flooring: Carpet; Luxury vinyl; Varies
- Bathrooms: 1 full bathroom (main level)
- Heating & cooling: Gas forced air heating
- Interior features: Ceiling fan(s); Separate/formal dining room; Country kitchen; Thermal windows; Accessible bedroom; No stairs
- Laundry & utility: Washer; Dryer; Main-level laundry / accessible utilities
Neighborhood map
What this means for you Summary
Snapshot
- This is a 2-bed/1.0-bath other listed at $90k.
Deal economics
- At list price, monthly cash flow is $27 ($320/yr) — positive.
- The deal already cash-flows at list — no discount required.
- To meet the 1% rule (rent ≥ 1% of price), the offer needs to be $81k (9.6% below list).
- Recommended offer: $81k (9.6% below list) — sets the bar for 1% rule.
- Cap rate 6.6% vs local median 4.3% in Bradford — top-decile yield for the area; either an underpriced asset or a hidden risk that comps aren't pricing in. Stress-test before assuming the spread holds.
Location & tenants
- Location reads 69/100 on livability (#814 in PA) — a middle-class / working-renter tenant base. Strengths: cost of living A+, housing A+, health & safety A+; Watch: crime F, amenities F, commute F.
- Bradford Area SD (town): math 41% / reading 60% proficiency, ranked #187 of 539 in PA (top 35%) — acceptable for families but not a draw, mixed tenant base, ~2y average lease.
- Zoned schools: George Blaisdell El Sch (567 students, 100% FRL); Floyd C Fretz Ms (math 33% / reading 60%, grade D+, #172 of 512 statewide, top 35%, 568 students, 100% FRL); Bradford Area Hs (math 72% / reading 24%, grade D, #153 of 437 statewide, top 37%, 751 students, 100% FRL) — zoned schools average 100% FRL vs 47% district-wide (53 pts higher); higher-poverty schools than district average — tighter screening recommended.
- Market conditions: 78 active listings in the ZIP; 29 units permitted in McKean County in 2024 (0 in 5+ unit buildings).
Forward outlook
- Local home prices are declining (-3.0%/yr); year-one equity from $622 of loan paydown is wiped out by about $3k of value loss. Plan a longer hold.
- McKean County population projected at -17% by 2050 — secular population decline; favor cash flow + early exit over multi-decade hold.
Negotiation context
- Only 3 days on market — expect competitive offers; lowballing is unlikely to land.
Risks & watch-outs
- Watch-outs: built in 1900 — expect roof / HVAC / electrical / plumbing capex.
Questions for the listing agent
- Built in 1900 — when were the roof, HVAC, electrical panel, plumbing, and water heater last replaced?
- Is there a deadline driving the sale (1031 exchange, divorce, estate, relocation)? That informs how much negotiation room exists.
- Crime grade is F in this area — have there been break-ins, vandalism, or insurance claims at this property in the last 3 years? What carrier currently insures it and at what premium?
- The area grade is low — what's the realistic commute time and amenity access for the typical tenant pool here? Any planned neighborhood developments (good or bad) we should know about?
- What's the average days-on-market for RENTAL listings here right now (not sales)? A rising rental-DOM trend means longer vacancies and softer asking-rent achievability than the comps imply.
- What's the recent tenant-quality profile in this submarket — average credit score on applications, eviction rate, late-payment / NSF rate, and stable-employment percentage? A property-management company in the area should have these aggregated.
- How much new for-sale + rental construction is in the pipeline within 1–3 miles? Heavy new supply typically softens prices + rents 12–24 months out; constrained supply supports both.
Investment metrics
- 1% rule
- 0.90% ✗
- Cap rate
- 6.65%
- Cash-on-cash
- 1.27%
- DSCR
- 1.06
- GRM
- 9.2
CMA / ARV
No comps found within radius.
Projected returns pro-forma
-3.0% appreciation · 3.0% rent growth · sell at horizon
- IRR
- -14.3%
- Equity multiple
- 0.49×
- Total profit
- $-12,860
- Equity at exit
- $13,404
- IRR
- -5.5%
- Equity multiple
- 0.64×
- Total profit
- $-8,974
- Equity at exit
- $7,773
Cash invested: $25,172 (down + closing). Projections, not guarantees.
Landlord ↔ Tenant lean methodology
- Overall (STATE)
- 62 Landlord-Friendly
- State Pennsylvania
- 62 Landlord-Friendly · EVEN
- County
- — inherits STATE
- City
- — inherits STATE
ZIP-level market 16701
- Home prices YoY
- -17.9%
- Active inventory
- 78
- Price-to-rent
- 9.2×
Monthly cashflow live
- Estimated rent
- $813 medium interval (Pro) →
- Mortgage (P&I)
- −$471
- Tax from tax record
- −$107 /mo · $1,281/yr
- Insurance
- −$37
- HOA
- −$0
- Vacancy / Maint / Mgmt
- −$171
- Net cashflow
- $27
Break-even live
Sensitivity live
| Price | -10% $78 | -5% $52 | +0% $27 | +5% $1 | +10% $-24 |
|---|---|---|---|---|---|
| Rent | -10% $-38 | -5% $-5 | +0% $27 | +5% $59 | +10% $91 |
| Rate | -1.0pp $72 | -0.5pp $50 | base $27 | +0.5pp $3 | +1.0pp $-20 |
UW: 25.0% down · 7.5% · 30yr · 1.5% tax · 5.0% vac · 8.0% maint · 8.0% mgmt
Financing live
Cash to close
- Down payment
- $22,475
- Closing costs
- $2,697
- Reserves months
- —
- Total cash needed
- —
Loan-product check · same deal, 3 products live
Conventional
25% down · 7.5% · 30yr
- Down + closing
- —
- Monthly P&I
- —
- Monthly cashflow
- —
- DSCR
- —
- Eligible?
- —
Personal DTI + credit; lowest rate.
DSCR
20% down · 8.5% · 30yr
- Down + closing
- —
- Monthly P&I
- —
- Monthly cashflow
- —
- DSCR
- —
- Eligible?
- —
No personal income docs; deal must DSCR.
Hard money
10% down · 12.0% · 12mo
- Down + closing
- —
- Monthly P&I
- —
- Monthly cashflow
- —
- DSCR
- —
- Eligible?
- —
Short-term bridge; refi at stabilization.
Listing history 5 events
-
2026-06-21status $89,900 Pending 3 DOM
-
2026-06-18days on market $89,900 Active 3 DOM
-
2026-06-17days on market $89,900 Active 2 DOM
-
2026-06-16remarks 699-char remark
-
2026-06-16$89,900 Active 1 DOM
ⓘ Source: listings_history table (triggers on properties + properties_extension) + one-shot
backfill from property_details.listing_events for pre-trigger history.
Tax reassessment forecast PA · Partial reset (capped growth)
- Current annual tax
- $1,281 · $107/mo
- Projected year-2 tax
- $1,351 · $113/mo
- Expected delta
- +$70/yr (+$6/mo · 5.5%)
ⓘ Screening estimate from a state-policy table — verify with the county assessor before closing.
Climate risk First Street
- Flood 1/10 Low FEMA zone X (unshaded) · 0% chance over 30 yrs
- Wildfire 1/10 Low
- Heat 2/10 Low 8 d/yr ≥89°F today · 18 d/yr by 30 yrs out
- Wind 1/10 Low
- Air quality 1/10 Low 0 unhealthy d/yr today · 0 by 30 yrs out
Nearby sold comps map
Loading sold comps map…
Walkable amenities ~0.75 mi
Loading nearby amenities…
Taxation est. · year 1
- Rental income
- $9,756
- − Mortgage interest
- −$5,036
- − Property taxes
- −$1,281
- − Insurance
- −$450
- − Repairs & maintenance
- −$781
- − Management
- −$781
- − Depreciation
- −$2,615
- Taxable loss
- −$1,186
- Est. tax savings @ 24.0%
- +$285
- After-tax cash flow
- $605/yr
For passive investors: Depreciation is non-cash, so a rental often shows a tax loss while cash-flowing — sheltering income. Rental losses are passive: they offset passive income freely, and up to $25,000/yr can offset ordinary (W-2) income if you actively participate and your MAGI is under $100k (phasing out to $0 by $150k); unused losses carry forward. On sale, claimed depreciation is recaptured at up to 25%, and gains may owe capital-gains tax (a 1031 exchange can defer both). Figures are a year-1 estimate at your 24.0% rate — not tax advice; consult a CPA.
Schools (NCES district)
- District
- Bradford Area SD
- NCES district ID
- 4204020
- Math proficiency
- 41% ▼ -5.00%
- Reading proficiency
- 60% ▼ -4.00%
- Median HH income
- $41,477
- Composite
- 42.31/100
- National rank
- #3261
- State rank
- #187 of 539 in PA
Livability — Bradford
- Score
- 69/100
- State rank
- #814
- US rank
- #8325
Category grades
Schools grade is shown separately in the Schools card above.
Census & demographics
- Census place
- Bradford, PA
- Population (ZIP)
- 16,584
Population outlook (McKean County) Hauer SSP2
- Today (2025)
- 40,518 people
- By 2030
- 39,290 · -3.0%
- By 2040
- 36,438 · -10.1%
- By 2050
- 33,556 · -17.2%
- By 2075
- 27,682 · -31.7%
- By 2100
- 21,726 · -46.4%
Race, ethnicity, and origin ACS 2023
- Neighborhood character
- Predominantly White (93%)
- Race & ethnicity
- White 93% Two or more races 3% Hispanic / Latino 2% Black 1%
- Common ancestry
- Romanian 4% Slovak 2% Iranian 2%
- Foreign-born
- 2% · Canada, China
- Languages at home
- 97% English-only · Spanish 1%
Political lean MEDSL · McKean
- 2024 margin
- Solid R (+47.2) · D 26.0% · R 73.2%
- 2008→2024 swing
- -29.9pp toward R · 2008: -17.3pp · 2024: -47.2pp
- All cycles
- 2024: R+47.2 2020: R+46.2 2016: R+47.2 2012: R+28.2 2008: R+17.3
Not yet ingested
- Civics
- —
Market trends
- HPI YoY
- ▼ -32.54%
- Current HPI
- 149.3686
- Rent YoY
- —
- Metro
- —
- State GDP YoY
- ▲ 1.68%
- F500 in state
- 34
Industry mix (Fortune 500 HQ in PA)
| Industry | F500 HQs | Revenue |
|---|---|---|
| Healthcare | 2 | $309B |
|
||
| Insurance | 2 | $27B |
|
||
| Telecommunications / Media | 1 | $124B |
|
||
| Industrial Distribution | 1 | $22B |
|
||
| Financial Services | 1 | $20B |
|
||
| Chemicals / Materials | 1 | $18B |
|
||
Price history
1 event — show timeline
- 2026-06-15 Listed $89,900 UNYREIS
Property tax history
+0.5%/yrLatest (2025): $1,281 · +3.3% YoY. Source: county tax records.
Cash-flow waterfall
monthlySold comps — $/sqft
last 12 mo · ≤1 miLoading sold comps…