2755 Arrow #25 · La Verne, CA
Flood risk 5/10 · Moderate
- FEMA flood zone
- X (unshaded)
- Chance of flooding over 30 yrs
- 0.58%
- Est. flood insurance / yr
- $507 – $1,088
Fire risk 1/10 · Minimal
- Est. fire insurance / yr
- $659 – $1,223
Heat risk 7/10 · Major
- Hot days now (above 99°F)
- 6 days/yr
- Hot days in 30 yrs
- 18 days/yr
Wind risk 1/10 · Minimal
- Chance of severe wind over 30 yrs
- —
Air-quality risk 8/10 · Major
- Unhealthy air days now
- 17 days/yr
- Unhealthy air days in 30 yrs
- 21 days/yr
Risk factors via First Street. Map © Google.
Why this score? — see what drove the B grade
The composite is a weighted blend of 9 inputs, each scored 0–100. Each bar is that input's sub-score; the figure is the points it added to the 100-point composite (weight × sub-score).
- Cash flow +30.0/30.0
- 1% rule +10.0/10.0
- DSCR +10.0/10.0
- Schools +5.9/10.0
- ARV discount +5.2/15.0
- Condition / age +4.0/5.0
- Livability +3.8/5.0
- Rent growth +3.1/5.0
- Appreciation +0.0/10.0
$179,999
🖨 Deal sheet 📄 Offer letter ✓ Due diligence
Listing remarks MLS
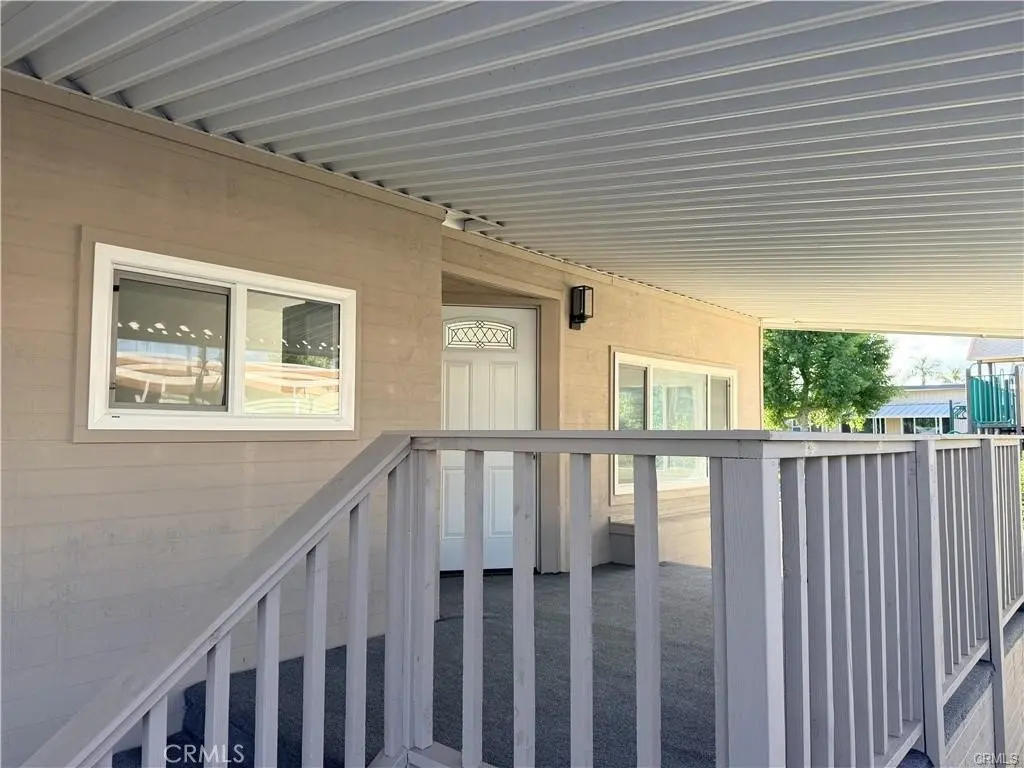
Welcome to your beautifully reimagined home in the highly sought-after city of La Verne, nestled within a private and quiet community. This stunning 3-bedroom, 2-bathroom residence offers the perfect blend of modern upgrades, convenience, and lifestyle. Step inside and you’ll immediately notice the brand-new waterproof vinyl flooring, recessed lighting, and fresh interior paint that create a bright and inviting atmosphere. The all-new kitchen features granite counters, stainless steel appliances, and modern cabinetry — the ideal space for both everyday living and entertaining. Both bathrooms have been fully renovated with walk-in showers and the primary suite boasts a luxurious dual-sink quartz vanity. Energy efficiency and comfort were top of mind in this renovation, with new insulation, Tyvek home wrap, dual-pane windows, and new water heater; new central AC The exterior has also been completely refreshed with new T-11 siding and fresh paint, ensuring curb appeal that lasts. New Water Heater This home also includes a dedicated laundry room and, to make moving in seamless, all appliances are included — making it truly turn-key. Located in the highly rated Bonita Unified School District, residents enjoy access to some of the best schools in the region. With convenient access to freeways (210 fwy; 10 fwy; 57 fwy, 71 fwy), shopping, dining, and parks, this home offers both privacy and connection to everything La Verne has to offer. Don’t miss this opportunity to own a move-in-ready home where every detail has already been done for you.
Key facts
- New water heater
- Private community
- Recessed lighting
Tags
Neighborhood map
What this means for you Summary
Snapshot
- This is a 3-bed/2.0-bath manufactured listed at $180k. Condition is rated good.
Deal economics
- At list price, monthly cash flow is $1k ($16k/yr) — positive.
- The deal already cash-flows at list — no discount required.
- Meets the 1% rule at list price ($3k rent vs $180k).
- Recommended offer: $177k (1.5% below list) — sets the bar for market timing.
- Cap rate 15.0% vs local median 3.0% in La Verne — top-decile yield for the area; either an underpriced asset or a hidden risk that comps aren't pricing in. Stress-test before assuming the spread holds.
Location & tenants
- Location reads 75/100 on livability (#110 in CA, #3,858 nationally) — a middle-class / working-renter tenant base. Strengths: amenities A+, employment A+, commute A; Watch: cost of living F, health & safety F.
- Bonita Unified (suburban): math 59% / reading 70% proficiency, ranked #151 of 1,400 in CA (top 11%) — acceptable for families but not a draw, mixed tenant base, ~2y average lease.
- Market conditions: Rents rising (+2.4%/yr); 94 active listings in the ZIP; 25 comparable units currently listed for rent nearby; rentals leasing fast (median 10d on market — plan ~1-2 weeks tenant-placement turnaround); 40% of comp listings sitting > 30 days — soft ceiling on asking rent; solid renter incomes; 19,697 units permitted in Los Angeles County in 2024 (9,426 in 5+ unit buildings).
- This rent runs 37% of the median local income ($104k/yr) — at the standard rent-burdened threshold; future hikes will face affordability resistance.
Forward outlook
- Local home prices are declining (-3.0%/yr); year-one equity from $1k of loan paydown is wiped out by about $5k of value loss. Plan a longer hold.
- Los Angeles County population projected at +9% by 2050 — modest demand growth; plan on rents tracking national, not racing it.
- At projected returns (-3.0% appreciation + 2.4% rent growth), your $50k cash investment doubles in ~4 years — after that, you're playing with house money.
Negotiation context
- It's been on market 22 days — a 2% lower offer ($177k) is reasonable based on typical stale-listing flexibility.
- 4 sale attempts since 7y ago with the ask held roughly flat each time — persistent listings suggest the price (not the market) is what's stuck; bring a comps-based counter.
- Current owner paid $30k; list at $180k implies a 500% gain — meaningful room to come down on a strong offer.
Risks & watch-outs
- Climate carrying-cost: moderate flood risk; extreme-heat days projected 6→18/yr by 2055 (HVAC capex compounding) — expect insurance premiums to compound above CPI over the hold.
Questions for the listing agent
- Built in 1975 — when were the roof, HVAC, electrical panel, plumbing, and water heater last replaced?
- Is there a deadline driving the sale (1031 exchange, divorce, estate, relocation)? That informs how much negotiation room exists.
- Schools are A-rated — typically a magnet for longer-tenancy family renters. What's the average tenant stay here, and is there a school-zone premium baked into asking?
- What's the average days-on-market for RENTAL listings here right now (not sales)? A rising rental-DOM trend means longer vacancies and softer asking-rent achievability than the comps imply.
- What's the recent tenant-quality profile in this submarket — average credit score on applications, eviction rate, late-payment / NSF rate, and stable-employment percentage? A property-management company in the area should have these aggregated.
- How much new for-sale + rental construction is in the pipeline within 1–3 miles? Heavy new supply typically softens prices + rents 12–24 months out; constrained supply supports both.
Investment metrics
- 1% rule
- 1.79% ✓
- Cap rate
- 15.01%
- Cash-on-cash
- 31.12%
- DSCR
- 2.38
- GRM
- 4.6
CMA / ARV
- ARV (median comp)
- $171,116
- List price
- $179,999
- Delta
- 5.19%
- Verdict
- FAIR
- Comps
- 20 within 1.0 mi
Show comp detail 12 sales within ~0.75 mi
| Address | Dist | Beds/Ba | Sqft | Sold | Price | $/sf | Match |
|---|---|---|---|---|---|---|---|
| 2755 Arrow #98 | 0.12mi | 3/2.0 | 1,296 (+3%) | 4mo | $204,000 | $157 | 86 |
| 2717 Arrow #154 | 0.15mi | 3/2.0 | 1,200 (-5%) | 1mo | $212,000 | $177 | 84 |
| 2755 Arrow Hwy #106 | 0.12mi | 3/2.0 | 1,321 (+5%) | 3mo | $165,000 | $125 | 84 |
| 2755 Arrow Hwy #13 | 0.12mi | 3/2.0 | 1,344 (+7%) | 4mo | $208,999 | $156 | 79 |
| 2717 E Arrow Hwy #21 | 0.15mi | 3/2.0 | 1,152 (-8%) | 2mo | $225,000 | $195 | 77 |
| 2755 Arrow Hwy #28 | 0.19mi | 2/2.0 (-1) | 1,200 (-5%) | 4mo | $77,000 | $64 | 75 |
| 2755 Arrow Highway #38 #38 | 0.01mi | 2/2.0 (-1) | 1,100 (-13%) | 2mo | $150,000 | $136 | 72 |
| 2755 Arrow Hwy #126 | 0.01mi | 2/2.0 (-1) | 1,440 (+14%) | 1mo | $137,000 | $95 | 70 |
| 2717 Arrow #130 | 0.15mi | 3/2.0 | 1,152 (-8%) | 11mo | $217,500 | $189 | 70 |
| 2755 Arrow Hwy #3 | 0.13mi | 2/2.0 (-1) | 1,152 (-8%) | 8mo | $130,900 | $114 | 68 |
| 2755 Arrow #12 | 0.12mi | 4/2.0 (+1) | 1,440 (+14%) | 1mo | $188,000 | $131 | 64 |
| 2755 Arrow Hwy #88 | 0.12mi | 2/1.0 (-1) | 1,080 (-14%) | 0mo | $61,000 | $56 | 61 |
Match score weights: distance 35% · size 25% · config 20% · recency 20%. Top-matched comps best support the ARV.
Projected returns pro-forma
-3.0% appreciation · 2.35% rent growth · sell at horizon
- IRR
- 25.2%
- Equity multiple
- 2.03×
- Total profit
- $52,035
- Equity at exit
- $26,838
- IRR
- 32.5%
- Equity multiple
- 3.86×
- Total profit
- $144,211
- Equity at exit
- $15,563
Cash invested: $50,400 (down + closing). Projections, not guarantees.
Landlord ↔ Tenant lean methodology
- Overall (STATE)
- 18 Strongly Tenant-Friendly
- State California
- 18 Strongly Tenant-Friendly · D+13
- County
- — inherits STATE
- City
- — inherits STATE
ZIP-level market 91750
- Rents YoY
- 2.4%
- Active inventory
- 94
- Price-to-rent
- 4.6×
Monthly cashflow live
- Estimated rent
- $3,229 high interval (Pro) →
- Mortgage (P&I)
- −$944
- Tax est. 1.5%
- −$225 /mo · $2,700/yr
- Insurance
- −$75
- HOA
- −$0
- Vacancy / Maint / Mgmt
- −$678
- Net cashflow
- $1,307
Break-even live
UW: 25.0% down · 7.5% · 30yr · 1.5% tax · 5.0% vac · 8.0% maint · 8.0% mgmt
Financing live
Cash to close
- Down payment
- $45,000
- Closing costs
- $5,400
- Reserves months
- —
- Total cash needed
- —
Loan-product check · same deal, 3 products live
Conventional
25% down · 7.5% · 30yr
- Down + closing
- —
- Monthly P&I
- —
- Monthly cashflow
- —
- DSCR
- —
- Eligible?
- —
Personal DTI + credit; lowest rate.
DSCR
20% down · 8.5% · 30yr
- Down + closing
- —
- Monthly P&I
- —
- Monthly cashflow
- —
- DSCR
- —
- Eligible?
- —
No personal income docs; deal must DSCR.
Hard money
10% down · 12.0% · 12mo
- Down + closing
- —
- Monthly P&I
- —
- Monthly cashflow
- —
- DSCR
- —
- Eligible?
- —
Short-term bridge; refi at stabilization.
Rent comps 25 comps
| Address | Beds | Baths | Sqft | Rent | $/sqft | DOM | Units | Dist |
|---|---|---|---|---|---|---|---|---|
| 2728 Crozier Ct Pomona, CA | 3.0 | 3.0 | 1497 | $3,295 | $2.20 | 1d | 1 | 0.52mi |
| 2707 Erebus Ct Pomona, CA | 3.0 | 3.0 | 1497 | $3,400 | $2.27 | 43d | 1 | 0.56mi |
| 2771 N Garey Ave Pomona, CA | 1.0–3.0 | 1.0–2.0 | 1065 | $3,522 | $3.31 | 1d | 8 | 0.64mi |
| 2018 Las Vegas Ave #8 Pomona, CA | 3.0 | 2.0 | 1398 | $2,750 | $1.97 | 10d | 1 | 0.70mi |
| 245 E Grevillia St Pomona, CA | 2.0 | 1.0 | 988 | $2,400 | $2.43 | 43d | 1 | 0.70mi |
| 2935 Gayridge St Pomona, CA | 3.0 | 2.0 | 1507 | $3,595 | $2.39 | 1d | 1 | 0.70mi |
| 2958 Gramercy St Pomona, CA | 3.0 | 2.0 | 1364 | $3,350 | $2.46 | 6d | 1 | 0.80mi |
| 2013 Walnut St Unit B La Verne, CA | 2.0 | 1.0 | 900 | $2,800 | $3.11 | 43d | 1 | 0.92mi |
| 3054 Gladstone St #4 Pomona, CA | 2.0 | 1.0 | 933 | $2,500 | $2.68 | 7d | 1 | 0.98mi |
| 235 W Grove St Pomona, CA | 1.0–2.0 | 1.0–2.0 | 800 | $2,576 | $3.22 | 1d | 10 | 1.01mi |
| 340 Cindy Ct Pomona, CA | 3.0 | 2.0 | 1618 | $3,900 | $2.41 | 43d | 1 | 1.03mi |
| 150 Drake St Pomona, CA | 2.0 | 2.0 | 924 | $2,514 | $2.72 | 1d | 2 | 1.11mi |
| 2644 Sycamore Dr La Verne, CA | 3.0 | 2.5 | 1825 | $4,100 | $2.25 | 1d | 1 | 1.11mi |
| 2577 Sycamore Dr La Verne, CA | 3.0 | 2.0 | 1350 | $2,895 | $2.14 | 43d | 1 | 1.16mi |
| 2559 Yorkshire Way Pomona, CA | 2.0 | 2.0 | 1100 | $2,400 | $2.18 | 24d | 1 | 1.18mi |
| 1490 N Park Ave Pomona, CA | 3.0 | 2.0 | 1376 | $3,395 | $2.47 | 43d | 1 | 1.20mi |
| 450 W Foothill Blvd Pomona, CA | 2.0 | 1.0–2.0 | 773 | $2,565 | $3.32 | 1d | 8 | 1.28mi |
| 1574 N Orange Grove Ave Pomona, CA | 3.0 | 2.0 | 1330 | $4,000 | $3.01 | 43d | 1 | 1.30mi |
| 2892 Cedar Ln Pomona, CA | 3.0 | 3.5 | 1818 | $3,300 | $1.82 | 43d | 1 | 1.32mi |
| 795 Hazel Way Pomona, CA | 3.0 | 3.0 | 1401 | $3,100 | $2.21 | 10d | 1 | 1.34mi |
| 2870 N Towne Ave Pomona, CA | 2.0 | 1.0–2.0 | 725 | $2,500 | $3.45 | 4d | 4 | 1.38mi |
| 2064 Evergreen St La Verne, CA | 2.0 | 2.0 | 960 | $2,400 | $2.50 | 17d | 1 | 1.38mi |
| 2063 Evergreen St La Verne, CA | 3.0 | 2.0 | 1300 | $3,200 | $2.46 | 43d | 1 | 1.41mi |
| 1554 3rd St La Verne, CA | 4.0 | 2.0 | 1509 | $3,600 | $2.39 | 5d | 1 | 1.44mi |
| 2002 Canopy Ln La Verne, CA | 3.0 | 3.0 | 1759 | $3,450 | $1.96 | 44d | 1 | 1.50mi |
Listing history 26 events
-
2026-06-18days on market $179,999 Active 22 DOM
-
2026-06-17days on market $179,999 Active 21 DOM
-
2026-06-16days on market $179,999 Active 20 DOM
-
2026-06-15days on market $179,999 Active 19 DOM
-
2026-06-13days on market $179,999 Active 17 DOM
-
2026-06-13days on market $179,999 Active 16 DOM
-
2026-06-09days on market $179,999 Active 13 DOM
-
2026-06-08days on market $179,999 Active 12 DOM
-
2026-06-07days on market $179,999 Active 11 DOM
-
2026-06-04days on market $179,999 Active 8 DOM
-
2026-06-03days on market $179,999 Active 7 DOM
-
2026-06-02days on market $179,999 Active 6 DOM
-
2026-06-01days on market $179,999 Active 5 DOM
-
2026-05-31days on market $179,999 Active 4 DOM
-
2026-01-08$179,999 Active 1583-char remark
Show marketing remark (1583 chars)
Welcome to your beautifully reimagined home in the highly sought-after city of La Verne, nestled within a private and quiet community. This stunning 3-bedroom, 2-bathroom residence offers the perfect blend of modern upgrades, convenience, and lifestyle. Step inside and you’ll immediately notice the brand-new waterproof vinyl flooring, recessed lighting, and fresh interior paint that create a bright and inviting atmosphere. The all-new kitchen features granite counters, stainless steel appliances, and modern cabinetry — the ideal space for both everyday living and entertaining. Both bathrooms have been fully renovated with walk-in showers and the primary suite boasts a luxurious dual-sink quartz vanity. Energy efficiency and comfort were top of mind in this renovation, with new insulation, Tyvek home wrap, dual-pane windows, and new water heater; new central AC The exterior has also been completely refreshed with new T-11 siding and fresh paint, ensuring curb appeal that lasts. New Water Heater This home also includes a dedicated laundry room and, to make moving in seamless, all appliances are included — making it truly turn-key. Located in the highly rated Bonita Unified School District, residents enjoy access to some of the best schools in the region. With convenient access to freeways (210 fwy; 10 fwy; 57 fwy, 71 fwy), shopping, dining, and parks, this home offers both privacy and connection to everything La Verne has to offer. Don’t miss this opportunity to own a move-in-ready home where every detail has already been done for you.
-
2026-01-06historical
-
2025-09-06$179,999 Active
-
2019-11-21soldstatus $30,000 Closed Sale
-
2019-11-18status Pending Sale
-
2019-10-23$35,000 Active
-
2019-10-11historical
-
2019-09-03price $35,000
-
2019-07-05price $39,000
-
2019-06-24price $50,000
-
2019-05-31price $53,000
-
2019-05-13$58,000 Active
ⓘ Source: listings_history table (triggers on properties + properties_extension) + one-shot
backfill from property_details.listing_events for pre-trigger history.
Climate risk First Street
- Flood 5/10 Major FEMA zone X (unshaded) · 58% chance over 30 yrs
- Wildfire 1/10 Low
- Heat 7/10 Severe 6 d/yr ≥99°F today · 18 d/yr by 30 yrs out
- Wind 1/10 Low
- Air quality 8/10 Severe 17 unhealthy d/yr today · 21 by 30 yrs out
Nearby sold comps map
Loading sold comps map…
Walkable amenities ~0.75 mi
Loading nearby amenities…
Taxation est. · year 1
- Rental income
- $38,750
- − Mortgage interest
- −$10,083
- − Property taxes
- −$2,700
- − Insurance
- −$900
- − Repairs & maintenance
- −$3,100
- − Management
- −$3,100
- − Depreciation
- −$5,236
- Taxable income
- $13,631
- Est. tax owed @ 24.0%
- −$3,272
- After-tax cash flow
- $12,414/yr
For passive investors: Depreciation is non-cash, so a rental often shows a tax loss while cash-flowing — sheltering income. Rental losses are passive: they offset passive income freely, and up to $25,000/yr can offset ordinary (W-2) income if you actively participate and your MAGI is under $100k (phasing out to $0 by $150k); unused losses carry forward. On sale, claimed depreciation is recaptured at up to 25%, and gains may owe capital-gains tax (a 1031 exchange can defer both). Figures are a year-1 estimate at your 24.0% rate — not tax advice; consult a CPA.
Condition & rehab AI · 12 photos
This beautifully reimagined 3-bedroom, 2-bathroom home in La Verne is move-in ready with new appliances, paint, and landscaping, making it an excellent investment.
Value-add opportunities
- Both landscaping — enhances curb appeal and adds value
- Both exterior paint — refreshes the home's appearance
- Both interior paint — enhances the home's appearance and creates a fresh feel
Renovation cost estimate screening
Value-add ROI direction
- Both landscaping — enhances curb appeal and adds value ↑
- Both exterior paint — refreshes the home's appearance ↑
- Both interior paint — enhances the home's appearance and creates a fresh feel ↑
ⓘ Cost ranges are severity-bucket heuristics (US national rule-of-thumb). Get contractor quotes + a written scope before underwriting a rehab budget.
Schools (NCES district)
- District
- Bonita Unified
- NCES district ID
- 0605610
- Math proficiency
- 59% ▲ 3.00%
- Reading proficiency
- 70% ▬ 0.00%
- Median HH income
- $76,196
- Composite
- 58.71/100
- National rank
- #2001
- State rank
- #151 of 1400 in CA
Livability — La Verne
- Score
- 75/100
- State rank
- #110
- US rank
- #3858
Category grades
Schools grade is shown separately in the Schools card above.
Census & demographics
- Census place
- La Verne, CA
- County
- Los Angeles County · 9,444,647 people
- City population
- 32,692
- Metro
- Los Angeles-Long Beach-Anaheim, CA
- Population (ZIP)
- 32,692
- Household income
- $104,195
- Rent vs Own
- Severe rent burden
- 872.0
Population outlook (Los Angeles County) Hauer SSP2
- Today (2025)
- 10,940,515 people
- By 2030
- 11,256,481 · +2.9%
- By 2040
- 11,729,929 · +7.2%
- By 2050
- 11,948,407 · +9.2%
- By 2075
- 11,818,114 · +8.0%
- By 2100
- 10,842,928 · -0.9%
Race, ethnicity, and origin ACS 2023
- Neighborhood character
- Diverse neighborhood (Simpson 0.67)
- Race & ethnicity
- White 44% Hispanic / Latino 36% Two or more races 20% Asian 10% Black 4%
- Hispanic origin (detail)
- Mexican 31%
- Common ancestry
- Lithuanian 3% Slovak 2% Romanian 1%
- Foreign-born
- 17% · Canada, China, South Korea
- Languages at home
- 75% English-only · Spanish 12% Chinese 3% Other Indo-European 3%
Political lean MEDSL · Los Angeles
- 2024 margin
- Solid D (+32.9) · D 64.8% · R 31.9% · Other 3.3%
- 2008→2024 swing
- -7.4pp toward R · 2008: 40.4pp · 2024: 32.9pp
- All cycles
- 2024: D+32.9 2020: D+44.2 2016: D+48.0 2012: D+40.0 2008: D+40.4
Not yet ingested
- Civics
- —
Market trends
- HPI YoY
- ▼ -729.79%
- Current HPI
- 373.7761
- Rent YoY
- ▲ 2.35%
- Metro
- Los Angeles-Long Beach-Anaheim, CA
- State GDP YoY
- ▲ 3.21%
- F500 in state
- 116
Industry mix (Fortune 500 HQ in CA)
| Industry | F500 HQs | Revenue |
|---|---|---|
| Technology | 27 | $1,492B |
|
||
| Financial Services | 3 | $174B |
|
||
| Retail | 3 | $44B |
|
||
| Insurance | 3 | $26B |
|
||
| Media / Entertainment | 2 | $115B |
|
||
| Pharmaceuticals / Biotech | 2 | $62B |
|
||
Price history
+210.3% since first listed12 events — show timeline
- 2026-01-08 Listed $179,999 CRMLS
- 2026-01-06 Listing Removed — CRMLS
- 2025-09-06 Listed $179,999 CRMLS
- 2019-11-21 Sold (MLS) $30,000 CRMLS
- 2019-11-18 Pending — CRMLS
- 2019-10-23 Listed $35,000 CRMLS
- 2019-10-11 Listing Removed — CRMLS
- 2019-09-03 Price Changed $35,000 CRMLS
- 2019-07-05 Price Changed $39,000 CRMLS
- 2019-06-24 Price Changed $50,000 CRMLS
- 2019-05-31 Price Changed $53,000 CRMLS
- 2019-05-13 Listed $58,000 CRMLS
Cash-flow waterfall
monthlySold comps — $/sqft
last 12 mo · ≤1 miLoading sold comps…