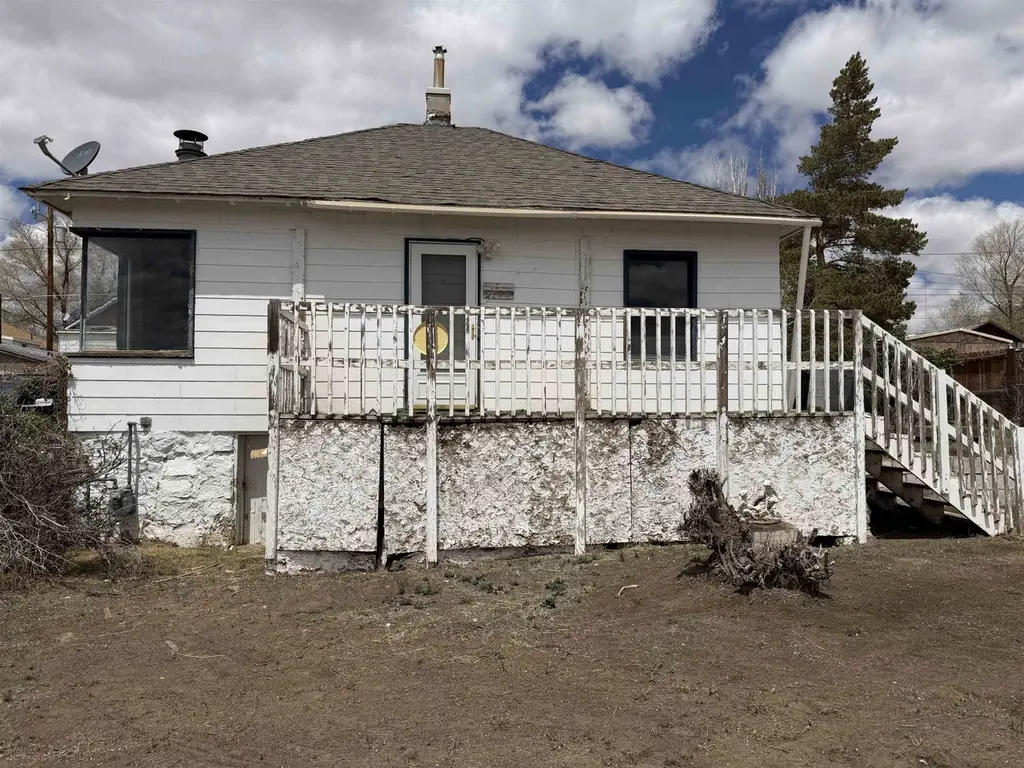
1229 South St · Reliance, WY
Flood risk 4/10 · Minor
- FEMA flood zone
- X
- Chance of flooding over 30 yrs
- 0.24%
- Est. flood insurance / yr
- $507 – $1,088
Fire risk 4/10 · Minor
- Est. fire insurance / yr
- $564 – $1,046
Heat risk 2/10 · Minimal
- Hot days now (above 87°F)
- 7 days/yr
- Hot days in 30 yrs
- 19 days/yr
Wind risk 1/10 · Minimal
- Chance of severe wind over 30 yrs
- —
Air-quality risk 1/10 · Minimal
- Unhealthy air days now
- 0 days/yr
- Unhealthy air days in 30 yrs
- 0 days/yr
Risk factors via First Street. Map © Google.
Why this score? — see what drove the B- grade
The composite is a weighted blend of 9 inputs, each scored 0–100. Each bar is that input's sub-score; the figure is the points it added to the 100-point composite (weight × sub-score).
- Cash flow +30.0/30.0
- DSCR +10.0/10.0
- 1% rule +8.7/10.0
- ARV discount +7.5/15.0
- Schools +4.2/10.0
- Condition / age +2.5/5.0
- Rent growth +2.0/5.0
- Livability +2.0/5.0
- Appreciation +0.0/10.0
$75,000
🖨 Deal sheet 📄 Offer letter ✓ Due diligence
Key facts
- Washer dryer
- Window cooling units
- Plenty of parking
Tags
Property features AI
Exterior
- Parking: No garage
- Utilities: Public water
- Home design: Single-family residential property
- Exterior features: Asphalt roof; Lot approximately 0.18 acres
Interior
- Kitchen: Dishwasher, Refrigerator, Microwave, Range/Oven, Garbage disposal
- Flooring: Hardwood
- Heating & cooling: Forced air heating
- Interior features: Dishwasher, Refrigerator, Microwave, Range/Oven, Garbage disposal; Hardwood floors; Fireplace (1)
Neighborhood map
What this means for you Summary
Snapshot
- This is a 2-bed/1.0-bath single-family listed at $75k.
Deal economics
- At list price, monthly cash flow is $364 ($4k/yr) — positive.
- The deal already cash-flows at list — no discount required.
- Meets the 1% rule at list price ($1k rent vs $75k).
- Recommended offer: $74k (1.5% below list) — sets the bar for market timing.
Location & tenants
- Location reads 39/100 on livability (#177 in WY) — a limited-amenity area; tenant pool skews transient or value-seeking. Strengths: cost of living A+, crime A; Watch: schools F, amenities F, commute F.
- Sweetwater County School District #1 (town): math 44% / reading 49% proficiency, ranked #31 of 41 in WY (top 76%) — families likely to look elsewhere, expect single-tenant / working-renter base with shorter leases.
- Market conditions: Rents soft (-2.1%/yr); 177 active listings in the ZIP; 47 units permitted in Sweetwater County in 2024 (0 in 5+ unit buildings).
- This rent is only 18% of the median local income ($70k/yr) — well below the 30% rent-burden line; pricing power to push rent on renewal without tenant pushback.
Forward outlook
- Local home prices are declining (-3.0%/yr); year-one equity from $519 of loan paydown is wiped out by about $2k of value loss. Plan a longer hold.
- Sweetwater County population projected at +12% by 2050 — modest demand growth; plan on rents tracking national, not racing it.
- At projected returns (-3.0% appreciation + 0.0% rent growth), your $21k cash investment doubles in ~8 years — after that, you're playing with house money.
Negotiation context
- It's been on market 29 days — a 2% lower offer ($74k) is reasonable based on typical stale-listing flexibility.
Risks & watch-outs
- Watch-outs: built in 1907 — expect roof / HVAC / electrical / plumbing capex.
Questions for the listing agent
- Built in 1907 — when were the roof, HVAC, electrical panel, plumbing, and water heater last replaced?
- Is there a deadline driving the sale (1031 exchange, divorce, estate, relocation)? That informs how much negotiation room exists.
- Schools are F-rated, which usually means shorter tenancies and higher turnover. Who's the typical renter profile here, and what's been the actual vacancy rate?
- What's the average days-on-market for RENTAL listings here right now (not sales)? A rising rental-DOM trend means longer vacancies and softer asking-rent achievability than the comps imply.
- What's the recent tenant-quality profile in this submarket — average credit score on applications, eviction rate, late-payment / NSF rate, and stable-employment percentage? A property-management company in the area should have these aggregated.
- How much new for-sale + rental construction is in the pipeline within 1–3 miles? Heavy new supply typically softens prices + rents 12–24 months out; constrained supply supports both.
Investment metrics
- 1% rule
- 1.37% ✓
- Cap rate
- 12.11%
- Cash-on-cash
- 20.79%
- DSCR
- 1.92
- GRM
- 6.1
CMA / ARV
No comps found within radius.
Projected returns pro-forma
-3.0% appreciation · 0.0% rent growth · sell at horizon
- IRR
- 10.0%
- Equity multiple
- 1.38×
- Total profit
- $7,980
- Equity at exit
- $11,183
- IRR
- 16.7%
- Equity multiple
- 2.19×
- Total profit
- $25,040
- Equity at exit
- $6,485
Cash invested: $21,000 (down + closing). Projections, not guarantees.
Landlord ↔ Tenant lean methodology
- Overall (STATE)
- 90 Strongly Landlord-Friendly
- State Wyoming
- 90 Strongly Landlord-Friendly · R+25
- County
- — inherits STATE
- City
- — inherits STATE
ZIP-level market 82901
- Rents YoY
- -2.1%
- Active inventory
- 177
- Price-to-rent
- 6.1×
Monthly cashflow live
- Estimated rent
- $1,027 medium interval (Pro) →
- Mortgage (P&I)
- −$393
- Tax from tax record
- −$23 /mo · $275/yr
- Insurance
- −$31
- HOA
- −$0
- Vacancy / Maint / Mgmt
- −$216
- Net cashflow
- $364
Break-even live
UW: 25.0% down · 7.5% · 30yr · 1.5% tax · 5.0% vac · 8.0% maint · 8.0% mgmt
Financing live
Cash to close
- Down payment
- $18,750
- Closing costs
- $2,250
- Reserves months
- —
- Total cash needed
- —
Loan-product check · same deal, 3 products live
Conventional
25% down · 7.5% · 30yr
- Down + closing
- —
- Monthly P&I
- —
- Monthly cashflow
- —
- DSCR
- —
- Eligible?
- —
Personal DTI + credit; lowest rate.
DSCR
20% down · 8.5% · 30yr
- Down + closing
- —
- Monthly P&I
- —
- Monthly cashflow
- —
- DSCR
- —
- Eligible?
- —
No personal income docs; deal must DSCR.
Hard money
10% down · 12.0% · 12mo
- Down + closing
- —
- Monthly P&I
- —
- Monthly cashflow
- —
- DSCR
- —
- Eligible?
- —
Short-term bridge; refi at stabilization.
Listing history 17 events
-
2026-06-19days on market $75,000 Active 29 DOM
-
2026-06-18days on market $75,000 Active 28 DOM
-
2026-06-17days on market $75,000 Active 27 DOM
-
2026-06-17price $75,000 Active 26 DOM
-
2026-06-16days on market $85,000 Active 26 DOM
-
2026-06-15days on market $85,000 Active 25 DOM
-
2026-06-14days on market $85,000 Active 23 DOM
-
2026-06-12days on market $85,000 Active 22 DOM
-
2026-06-09days on market $85,000 Active 19 DOM
-
2026-06-08days on market $85,000 Active 18 DOM
-
2026-06-07days on market $85,000 Active 17 DOM
-
2026-06-05days on market $85,000 Active 14 DOM
-
2026-06-02days on market $85,000 Active 12 DOM
-
2026-06-01days on market $85,000 Active 11 DOM
-
2026-05-31days on market $85,000 Active 10 DOM
-
2026-05-30days on market $85,000 Active 9 DOM
-
2026-05-21$85,000 Active
ⓘ Source: listings_history table (triggers on properties + properties_extension) + one-shot
backfill from property_details.listing_events for pre-trigger history.
Tax reassessment forecast WY · Resets to sale price
- Current annual tax
- $275 · $23/mo
- Projected year-2 tax
- $458 · $38/mo
- Expected delta
- +$183/yr (+$15/mo · 66.5%)
ⓘ Screening estimate from a state-policy table — verify with the county assessor before closing.
Climate risk First Street
- Flood 4/10 Moderate FEMA zone X · 24% chance over 30 yrs
- Wildfire 4/10 Moderate
- Heat 2/10 Low 7 d/yr ≥87°F today · 19 d/yr by 30 yrs out
- Wind 1/10 Low
- Air quality 1/10 Low 0 unhealthy d/yr today · 0 by 30 yrs out
Nearby sold comps map
Loading sold comps map…
Walkable amenities ~0.75 mi
Loading nearby amenities…
Taxation est. · year 1
- Rental income
- $12,323
- − Mortgage interest
- −$4,201
- − Property taxes
- −$275
- − Insurance
- −$375
- − Repairs & maintenance
- −$986
- − Management
- −$986
- − Depreciation
- −$2,182
- Taxable income
- $3,318
- Est. tax owed @ 24.0%
- −$796
- After-tax cash flow
- $3,569/yr
For passive investors: Depreciation is non-cash, so a rental often shows a tax loss while cash-flowing — sheltering income. Rental losses are passive: they offset passive income freely, and up to $25,000/yr can offset ordinary (W-2) income if you actively participate and your MAGI is under $100k (phasing out to $0 by $150k); unused losses carry forward. On sale, claimed depreciation is recaptured at up to 25%, and gains may owe capital-gains tax (a 1031 exchange can defer both). Figures are a year-1 estimate at your 24.0% rate — not tax advice; consult a CPA.
Schools (NCES district)
- District
- Sweetwater County School District #1
- NCES district ID
- 5605302
- Math proficiency
- 44% ▼ -4.00%
- Reading proficiency
- 49% ▼ -3.00%
- Median HH income
- $68,679
- Composite
- 41.66/100
- National rank
- #3422
- State rank
- #31 of 41 in WY
Livability — Reliance
- Score
- 39/100
- State rank
- #177
- US rank
- #27347
Category grades
Schools grade is shown separately in the Schools card above.
Census & demographics
- Census place
- Reliance, WY
- County
- Sweetwater County · 27,198 people
- Metro
- Rock Springs, WY
- Population (ZIP)
- 27,198
- Household income
- $69,954
- Rent vs Own
- Severe rent burden
- 609.0
Population outlook (Sweetwater County) Hauer SSP2
- Today (2025)
- 48,212 people
- By 2030
- 49,664 · +3.0%
- By 2040
- 51,984 · +7.8%
- By 2050
- 54,005 · +12.0%
- By 2075
- 57,684 · +19.6%
- By 2100
- 57,857 · +20.0%
Race, ethnicity, and origin ACS 2023
- Neighborhood character
- Predominantly White (74%)
- Race & ethnicity
- White 74% Hispanic / Latino 19% Two or more races 9% Black 2% Native American 1%
- Hispanic origin (detail)
- Mexican 15%
- Common ancestry
- Italian 5% Lithuanian 2% Portuguese 2%
- Foreign-born
- 7% · Canada, Vietnam, Jamaica
- Languages at home
- 90% English-only · Spanish 9% Vietnamese 1%
Political lean MEDSL · Sweetwater
- 2024 margin
- Solid R (+53.2) · D 22.5% · R 75.7% · Other 1.8%
- 2008→2024 swing
- -25.7pp toward R · 2008: -27.5pp · 2024: -53.2pp
- All cycles
- 2024: R+53.2 2020: R+50.6 2016: R+53.5 2012: R+39.7 2008: R+27.5
Not yet ingested
- Civics
- —
Market trends
- HPI YoY
- ▼ -270.69%
- Current HPI
- 146.2451
- Rent YoY
- ▼ -2.15%
- Metro
- Rock Springs, WY
- State GDP YoY
- —
- F500 in state
- 0
Price history
1 event — show timeline
- 2026-05-21 Listed $85,000 WMLS
Property tax history
-3.1%/yrLatest (2025): $275 · -49.6% YoY. Source: county tax records.
Cash-flow waterfall
monthlySold comps — $/sqft
last 12 mo · ≤1 miLoading sold comps…