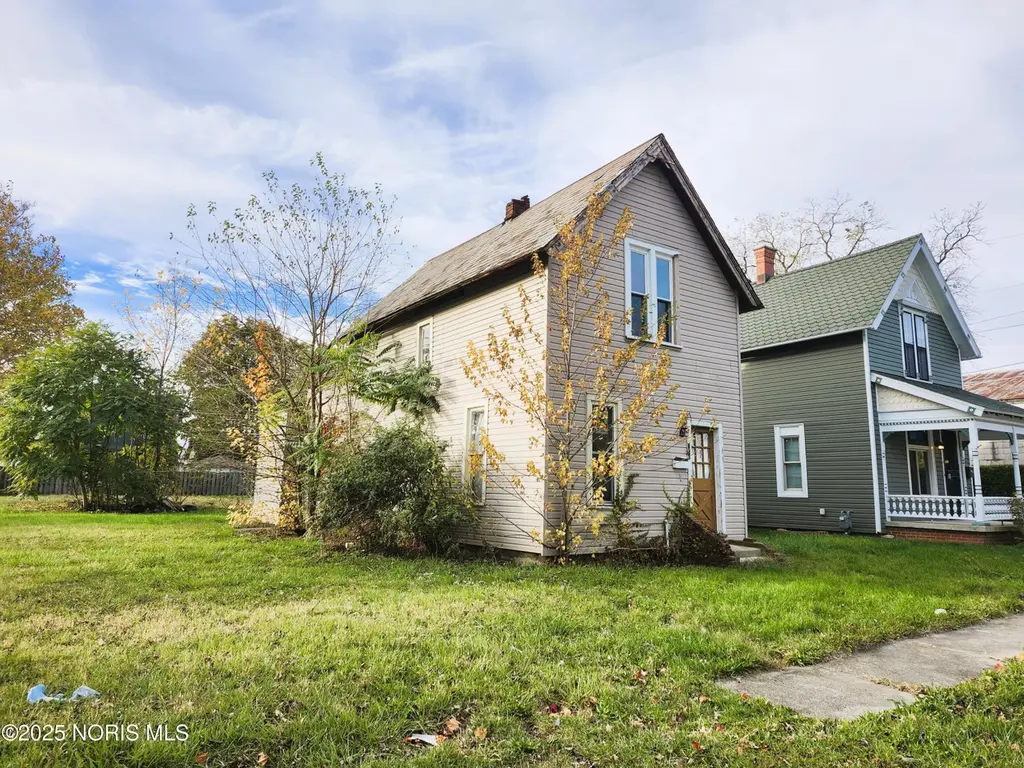
325 Mcdougal St · Fostoria, OH
Flood risk 1/10 · Minimal
- FEMA flood zone
- X (unshaded)
- Chance of flooding over 30 yrs
- 0.0%
- Est. flood insurance / yr
- $507 – $1,088
Fire risk 1/10 · Minimal
- Est. fire insurance / yr
- $713 – $1,323
Heat risk 3/10 · Minor
- Hot days now (above 99°F)
- 7 days/yr
- Hot days in 30 yrs
- 17 days/yr
Wind risk 2/10 · Minimal
- Chance of severe wind over 30 yrs
- —
Air-quality risk 2/10 · Minimal
- Unhealthy air days now
- 1 days/yr
- Unhealthy air days in 30 yrs
- 2 days/yr
Risk factors via First Street. Map © Google.
Why this score? — see what drove the B grade
The composite is a weighted blend of 9 inputs, each scored 0–100. Each bar is that input's sub-score; the figure is the points it added to the 100-point composite (weight × sub-score).
- Cash flow +30.0/30.0
- ARV discount +13.2/15.0
- 1% rule +10.0/10.0
- DSCR +10.0/10.0
- Livability +3.8/5.0
- Schools +2.9/10.0
- Rent growth +2.5/5.0
- Condition / age +2.5/5.0
- Appreciation +0.0/10.0
$50,000
🖨 Deal sheet (PDF) 📄 Offer letter ✓ Due diligence
Listing remarks MLS
Investors! Add your finishing touches to this 3 bed 1 bath single family home. Great income potential!
Key facts
- 3,960 sq ft lot
- 2 parking spots
- Built 1900
Neighborhood map
What this means for you Summary
Snapshot
- This is a 3-bed/1.0-bath single-family listed at $50k.
Deal economics
- At list price, monthly cash flow is $496 ($6k/yr) — positive.
- The deal already cash-flows at list — no discount required.
- Meets the 1% rule at list price ($1k rent vs $50k).
- Recommended offer: $44k (12.0% below list) — sets the bar for market timing.
- Cap rate 18.2% vs local median 4.5% in Fostoria — top-decile yield for the area; either an underpriced asset or a hidden risk that comps aren't pricing in. Stress-test before assuming the spread holds.
Location & tenants
- Location reads 76/100 on livability (#216 in OH, #3,330 nationally) — a middle-class / working-renter tenant base. Strengths: cost of living A+, housing A+, health & safety A+; Watch: schools D+, commute F, employment D-.
- Fostoria City (town): math 30% / reading 39% proficiency, ranked #566 of 656 in OH (top 86%) — families likely to look elsewhere, expect single-tenant / working-renter base with shorter leases; 70% free/reduced lunch — lower-income household profile, screen leases tightly.
- Market conditions: 51 active listings in the ZIP; 45 units permitted in Seneca County in 2024 (0 in 5+ unit buildings).
Forward outlook
- Local home prices are declining (-3.0%/yr); year-one equity from $346 of loan paydown is wiped out by about $2k of value loss. Plan a longer hold.
- Seneca County population projected at -14% by 2050 — secular population decline; favor cash flow + early exit over multi-decade hold.
- At projected returns (-3.0% appreciation + 3.0% rent growth), your $14k cash investment doubles in ~3 years — after that, you're playing with house money.
Negotiation context
- It's been on market 205 days — a 12% lower offer ($44k) is reasonable based on typical stale-listing flexibility.
Risks & watch-outs
- Watch-outs: built in 1900 — expect roof / HVAC / electrical / plumbing capex.
Questions for the listing agent
- It's been on market 205 days. Have you received any prior offers? Is the seller open to a 12% concession, seller financing, or rate buy-down credit?
- Built in 1900 — when were the roof, HVAC, electrical panel, plumbing, and water heater last replaced?
- Why hasn't it sold? Are there any deal-killer items the seller is aware of (foundation, flood, title, zoning, code violations)?
- Is there a deadline driving the sale (1031 exchange, divorce, estate, relocation)? That informs how much negotiation room exists.
- Schools are D-rated, which usually means shorter tenancies and higher turnover. Who's the typical renter profile here, and what's been the actual vacancy rate?
- What's the average days-on-market for RENTAL listings here right now (not sales)? A rising rental-DOM trend means longer vacancies and softer asking-rent achievability than the comps imply.
- What's the recent tenant-quality profile in this submarket — average credit score on applications, eviction rate, late-payment / NSF rate, and stable-employment percentage? A property-management company in the area should have these aggregated.
- How much new for-sale + rental construction is in the pipeline within 1–3 miles? Heavy new supply typically softens prices + rents 12–24 months out; constrained supply supports both.
Investment metrics
- 1% rule
- 2.14% ✓
- Cap rate
- 18.20%
- Cash-on-cash
- 42.52%
- DSCR
- 2.89
- GRM
- 3.9
CMA / ARV
- ARV (median comp)
- $57,224
- List price
- $50,000
- Delta
- -12.62%
- Verdict
- UNDERPRICED
- Comps
- 20 within 1.0 mi
Show comp detail 12 sales within ~0.75 mi
| Address | Dist | Beds/Ba | Sqft | Sold | Price | $/sf | Match |
|---|---|---|---|---|---|---|---|
| 130 Summit St | 0.51mi | 3/1.0 | 1,248 (-4%) | 10mo | $148,900 | $119 | 62 |
| 337 S Union St | 0.56mi | 3/1.0 | 1,306 (+1%) | 14mo | $62,310 | $48 | 61 |
| 517 W North St | 0.73mi | 3/1.0 | 1,335 (+3%) | 1mo | $155,000 | $116 | 61 |
| 230 W South St | 0.44mi | 3/2.0 | 1,352 (+4%) | 11mo | $150,000 | $111 | 60 |
| 220 S Union St | 0.49mi | 3/1.0 | 1,365 (+5%) | 14mo | $90,000 | $66 | 57 |
| 551 N Main St | 0.35mi | 2/1.0 (-1) | 1,206 (-7%) | 14mo | $125,000 | $104 | 55 |
| 481 Beverly Dr | 0.57mi | 3/1.0 | 1,185 (-9%) | 7mo | $157,000 | $132 | 53 |
| 604 S Union St | 0.70mi | 3/1.0 | 1,165 (-10%) | 5mo | $46,000 | $39 | 46 |
| 260 E 6th St | 0.68mi | 2/1.0 (-1) | 1,406 (+8%) | 10mo | $45,000 | $32 | 42 |
| 912 Mcdougal St | 0.71mi | 3/1.0 | 1,148 (-12%) | 10mo | $125,000 | $109 | 40 |
| 461 W Tiffin St | 0.71mi | 4/1.0 (+1) | 1,483 (+14%) | 2mo | $51,803 | $35 | 36 |
| 728 Oaklawn Ave | 0.72mi | 3/1.0 | 1,116 (-14%) | 14mo | $49,000 | $44 | 31 |
Match score weights: distance 35% · size 25% · config 20% · recency 20%. Top-matched comps best support the ARV.
Projected returns pro-forma
-3.0% appreciation · 3.0% rent growth · sell at horizon
- IRR
- 39.3%
- Equity multiple
- 2.68×
- Total profit
- $23,514
- Equity at exit
- $7,455
- IRR
- 45.7%
- Equity multiple
- 5.37×
- Total profit
- $61,237
- Equity at exit
- $4,323
Cash invested: $14,000 (down + closing). Projections, not guarantees.
Landlord ↔ Tenant lean methodology
- Overall (STATE)
- 73 Landlord-Friendly
- State Ohio
- 73 Landlord-Friendly · R+6
- County
- — inherits STATE
- City
- — inherits STATE
ZIP-level market 44830
- Home prices YoY
- -16.1%
- Active inventory
- 51
- Price-to-rent
- 3.9×
Monthly cashflow live
- Estimated rent
- $1,070 medium interval (Pro) →
- Mortgage (P&I)
- −$262
- Tax from tax record
- −$66 /mo · $793/yr
- Insurance
- −$21
- HOA
- −$0
- Vacancy / Maint / Mgmt
- −$225
- Net cashflow
- $496
Break-even live
Sensitivity live
| Price | -10% $524 | -5% $510 | +0% $496 | +5% $482 | +10% $468 |
|---|---|---|---|---|---|
| Rent | -10% $412 | -5% $454 | +0% $496 | +5% $538 | +10% $581 |
| Rate | -1.0pp $521 | -0.5pp $509 | base $496 | +0.5pp $483 | +1.0pp $470 |
UW: 25.0% down · 7.5% · 30yr · 1.5% tax · 5.0% vac · 8.0% maint · 8.0% mgmt
Financing live
Cash to close
- Down payment
- $12,500
- Closing costs
- $1,500
- Reserves months
- —
- Total cash needed
- —
Loan-product check · same deal, 3 products live
Conventional
25% down · 7.5% · 30yr
- Down + closing
- —
- Monthly P&I
- —
- Monthly cashflow
- —
- DSCR
- —
- Eligible?
- —
Personal DTI + credit; lowest rate.
DSCR
20% down · 8.5% · 30yr
- Down + closing
- —
- Monthly P&I
- —
- Monthly cashflow
- —
- DSCR
- —
- Eligible?
- —
No personal income docs; deal must DSCR.
Hard money
10% down · 12.0% · 12mo
- Down + closing
- —
- Monthly P&I
- —
- Monthly cashflow
- —
- DSCR
- —
- Eligible?
- —
Short-term bridge; refi at stabilization.
Listing history 1 events
-
2025-11-03$50,000 Active 104-char remark
Show marketing remark (104 chars)
Investors! Add your finishing touches to this 3 bed 1 bath single family home. Great income potential!
ⓘ Source: listings_history table (triggers on properties + properties_extension) + one-shot
backfill from property_details.listing_events for pre-trigger history.
Tax reassessment forecast OH · Partial reset (capped growth)
- Current annual tax
- $793 · $66/mo
- Projected year-2 tax
- $793 · $66/mo
- Expected delta
- $0/yr ($0/mo · -0.0%)
ⓘ Screening estimate from a state-policy table — verify with the county assessor before closing.
Climate risk First Street
- Flood 1/10 Low FEMA zone X (unshaded) · 0% chance over 30 yrs
- Wildfire 1/10 Low
- Heat 3/10 Moderate 7 d/yr ≥99°F today · 17 d/yr by 30 yrs out
- Wind 2/10 Low
- Air quality 2/10 Low 1 unhealthy d/yr today · 2 by 30 yrs out
Nearby sold comps map
Loading sold comps map…
Walkable amenities ~0.75 mi
Loading nearby amenities…
Taxation est. · year 1
- Rental income
- $12,839
- − Mortgage interest
- −$2,801
- − Property taxes
- −$793
- − Insurance
- −$250
- − Repairs & maintenance
- −$1,027
- − Management
- −$1,027
- − Depreciation
- −$1,455
- Taxable income
- $5,486
- Est. tax owed @ 24.0%
- −$1,317
- After-tax cash flow
- $4,637/yr
For passive investors: Depreciation is non-cash, so a rental often shows a tax loss while cash-flowing — sheltering income. Rental losses are passive: they offset passive income freely, and up to $25,000/yr can offset ordinary (W-2) income if you actively participate and your MAGI is under $100k (phasing out to $0 by $150k); unused losses carry forward. On sale, claimed depreciation is recaptured at up to 25%, and gains may owe capital-gains tax (a 1031 exchange can defer both). Figures are a year-1 estimate at your 24.0% rate — not tax advice; consult a CPA.
Schools (NCES district)
- District
- Fostoria City
- NCES district ID
- 3904399
- Math proficiency
- 30% ▼ -21.00%
- Reading proficiency
- 39% ▼ -10.00%
- Median HH income
- $36,902
- Composite
- 28.65/100
- National rank
- #6702
- State rank
- #566 of 656 in OH
Livability — Fostoria
- Score
- 76/100
- State rank
- #216
- US rank
- #3330
Category grades
Schools grade is shown separately in the Schools card above.
Census & demographics
- Census place
- Fostoria, OH
- County
- Seneca · 70,739 people
- City population
- 18,409
- Population (ZIP)
- 18,409
- Household income
- $61,589
- Rent vs Own
- Severe rent burden
- 9.8
Population outlook (Seneca County) Hauer SSP2
- Today (2025)
- 54,243 people
- By 2030
- 52,947 · -2.4%
- By 2040
- 49,842 · -8.1%
- By 2050
- 46,689 · -13.9%
- By 2075
- 39,889 · -26.5%
- By 2100
- 32,155 · -40.7%
Race, ethnicity, and origin ACS 2023
- Neighborhood character
- Predominantly White (80%)
- Race & ethnicity
- White 80% Hispanic / Latino 10% Two or more races 7% Black 3% Asian 1%
- Hispanic origin (detail)
- Mexican 9%
- Common ancestry
- Lithuanian 2% Italian 2% Slovak 1%
- Foreign-born
- 3% · Canada, South Korea
- Languages at home
- 94% English-only · Spanish 4%
Political lean MEDSL · Seneca
- 2024 margin
- Solid R (+37.5) · D 30.7% · R 68.2% · Other 1.0%
- 2008→2024 swing
- -34.8pp toward R · 2008: -2.7pp · 2024: -37.5pp
- All cycles
- 2024: R+37.5 2020: R+34.2 2016: R+31.2 2012: R+8.4 2008: R+2.7
Not yet ingested
- Civics
- —
Market trends
- HPI YoY
- ▼ -42.93%
- Current HPI
- 224.2583
- Rent YoY
- —
- Metro
- —
- State GDP YoY
- ▲ 1.98%
- F500 in state
- 48
Industry mix (Fortune 500 HQ in OH)
| Industry | F500 HQs | Revenue |
|---|---|---|
| Insurance | 3 | $145B |
|
||
| Industrial Machinery | 3 | $49B |
|
||
| Financial Services | 3 | $24B |
|
||
| Consumer Goods | 2 | $93B |
|
||
| Aerospace / Defense | 2 | $47B |
|
||
| Utilities | 2 | $33B |
|
||
Price history
1 event — show timeline
- 2025-11-03 Listed $50,000 NORIS
Property tax history
-7.9%/yrLatest (2025): $793 · -2.1% YoY. Source: county tax records.
Cash-flow waterfall
monthlySold comps — $/sqft
last 12 mo · ≤1 miLoading sold comps…