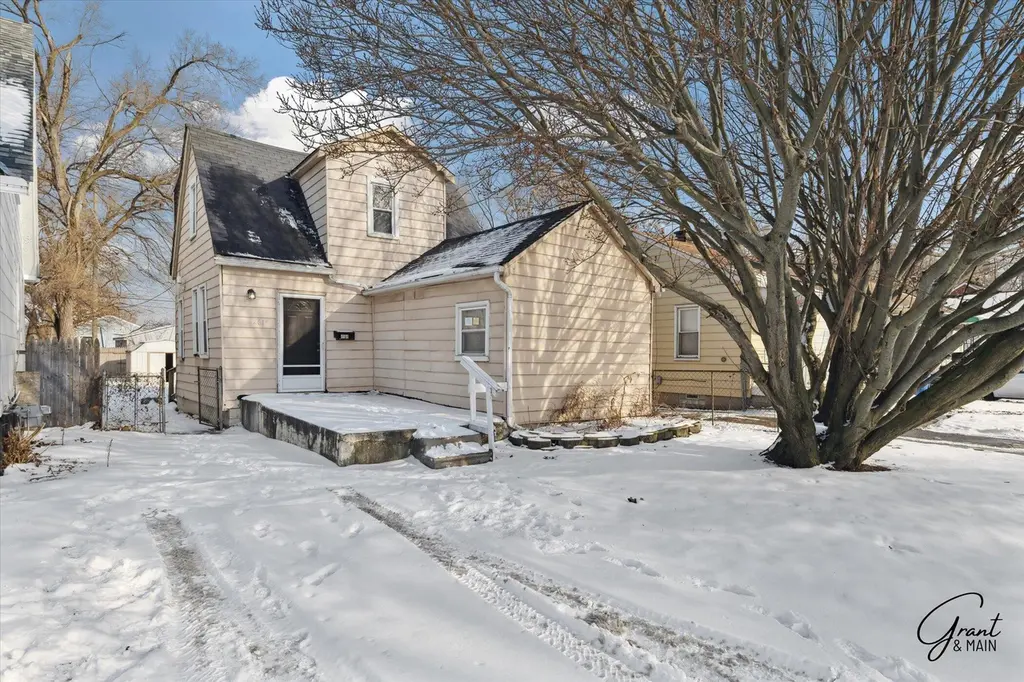
2615 Emmons Ave · Warren, MI
Flood risk 1/10 · Minimal
- FEMA flood zone
- X (unshaded)
- Chance of flooding over 30 yrs
- 0.0%
- Est. flood insurance / yr
- $507 – $1,088
Fire risk 1/10 · Minimal
- Est. fire insurance / yr
- $784 – $1,456
Heat risk 3/10 · Minor
- Hot days now (above 97°F)
- 7 days/yr
- Hot days in 30 yrs
- 15 days/yr
Wind risk 1/10 · Minimal
- Chance of severe wind over 30 yrs
- —
Air-quality risk 4/10 · Minor
- Unhealthy air days now
- 4 days/yr
- Unhealthy air days in 30 yrs
- 6 days/yr
Risk factors via First Street. Map © Google.
Why this score? — see what drove the C- grade
The composite is a weighted blend of 9 inputs, each scored 0–100. Each bar is that input's sub-score; the figure is the points it added to the 100-point composite (weight × sub-score).
- Cash flow +25.3/30.0
- 1% rule +8.3/10.0
- DSCR +8.3/10.0
- Livability +3.7/5.0
- Rent growth +3.1/5.0
- Condition / age +2.5/5.0
- Schools +1.3/10.0
- ARV discount +0.0/15.0
- Appreciation +0.0/10.0
$99,000
🖨 Deal sheet (PDF) 📄 Offer letter ✓ Due diligence
Listing remarks MLS
This beautifully remodeled very large 2 bedroom, 1 bath bungalow boasts fresh paint on the exterior and flooring throughout, fresh exterior paint and new blinds. This home has a current C of C.
Key facts
- Remodeled
- New flooring
- New paint
Tags
Neighborhood map
What this means for you Summary
Snapshot
- This is a 2-bed/1.0-bath single-family listed at $99k.
Deal economics
- At list price, monthly cash flow is $225 ($3k/yr) — positive.
- The deal already cash-flows at list — no discount required.
- Meets the 1% rule at list price ($1k rent vs $99k).
- Recommended offer: $87k (12.0% below list) — sets the bar for market timing.
- Cap rate 9.0% vs local median 5.2% in Warren — top-decile yield for the area; either an underpriced asset or a hidden risk that comps aren't pricing in. Stress-test before assuming the spread holds.
Location & tenants
- Location reads 74/100 on livability (#171 in MI, #4,491 nationally) — a middle-class / working-renter tenant base. Strengths: commute A+, cost of living A+, housing A+; Watch: amenities D, employment D, crime D-.
- Fitzgerald Public Schools (urban): math 8% / reading 23% proficiency, ranked #503 of 540 in MI (top 93%) — low school quality limits family demand, transient renter base, plan for 1-2y turnover; 77% free/reduced lunch — lower-income household profile, screen leases tightly.
- Zoned schools: Westview Elementary School (math 12% / reading 22%, grade F, #1,149 of 1,397 statewide, top 84%, 451 students, 84% FRL); Pd Chatterton Middle School (math 9% / reading 27%, grade F, #433 of 493 statewide, top 88%, 410 students, 86% FRL); Fitzgerald Senior High School (math 8% / reading 26%, grade F, #636 of 713 statewide, top 89%, 806 students, 82% FRL).
- Market conditions: Rents rising (+2.4%/yr); 170 active listings in the ZIP; 38 comparable units currently listed for rent nearby; rentals at typical pace (median 26d on market — plan ~3-4 weeks tenant-placement turnaround); 1,321 units permitted in Macomb County in 2024 (86 in 5+ unit buildings).
Forward outlook
- Local home prices are declining (-3.0%/yr); year-one equity from $684 of loan paydown is wiped out by about $3k of value loss. Plan a longer hold.
- Macomb County population projected at +9% by 2050 — modest demand growth; plan on rents tracking national, not racing it.
Negotiation context
- It's been on market 130 days — a 12% lower offer ($87k) is reasonable based on typical stale-listing flexibility.
- 12 sale attempts since 23y ago; this cycle's ask has dropped $16k (14%) from the opening price — seller is motivated, your offer sets the floor, not the list.
- Current owner paid $65k; list at $99k implies a 52% gain — meaningful room to come down on a strong offer.
Risks & watch-outs
- Watch-outs: property tax is 3.1% of price; built in 1940 — expect roof / HVAC / electrical / plumbing capex.
Questions for the listing agent
- It's been on market 130 days. Have you received any prior offers? Is the seller open to a 12% concession, seller financing, or rate buy-down credit?
- Built in 1940 — when were the roof, HVAC, electrical panel, plumbing, and water heater last replaced?
- Property tax is high relative to price — has the assessment been appealed recently, and will the sale trigger a re-assessment?
- Why hasn't it sold? Are there any deal-killer items the seller is aware of (foundation, flood, title, zoning, code violations)?
- Is there a deadline driving the sale (1031 exchange, divorce, estate, relocation)? That informs how much negotiation room exists.
- Schools are D-rated, which usually means shorter tenancies and higher turnover. Who's the typical renter profile here, and what's been the actual vacancy rate?
- Crime grade is D in this area — have there been break-ins, vandalism, or insurance claims at this property in the last 3 years? What carrier currently insures it and at what premium?
- What's the average days-on-market for RENTAL listings here right now (not sales)? A rising rental-DOM trend means longer vacancies and softer asking-rent achievability than the comps imply.
- What's the recent tenant-quality profile in this submarket — average credit score on applications, eviction rate, late-payment / NSF rate, and stable-employment percentage? A property-management company in the area should have these aggregated.
- How much new for-sale + rental construction is in the pipeline within 1–3 miles? Heavy new supply typically softens prices + rents 12–24 months out; constrained supply supports both.
Investment metrics
- 1% rule
- 1.33% ✓
- Cap rate
- 9.02%
- Cash-on-cash
- 9.73%
- DSCR
- 1.43
- GRM
- 6.3
CMA / ARV
- ARV (median comp)
- $75,108
- List price
- $99,000
- Delta
- 31.81%
- Verdict
- OVERPRICED
- Comps
- 20 within 1.0 mi
Show comp detail 12 sales within ~0.75 mi
| Address | Dist | Beds/Ba | Sqft | Sold | Price | $/sf | Match |
|---|---|---|---|---|---|---|---|
| 20180 Charest St | 0.41mi | 3/1.0 (+1) | 840 (-7%) | 5mo | $45,000 | $54 | 60 |
| 2184 Garrick Ave | 0.53mi | 3/1.0 (+1) | 960 (+6%) | 1mo | $95,100 | $99 | 60 |
| 20401 Greeley St | 0.66mi | 3/1.0 (+1) | 928 (+2%) | 1mo | $55,000 | $59 | 60 |
| 2007 Pearl Ave | 0.70mi | 3/1.0 (+1) | 937 (+3%) | 2mo | $131,500 | $140 | 54 |
| 3308 Toepfer Rd | 0.45mi | 3/1.0 (+1) | 1,000 (+10%) | 7mo | $150,500 | $151 | 51 |
| 20426 Wexford St | 0.59mi | 3/1.5 (+1) | 1,009 (+11%) | 1mo | $117,000 | $116 | 46 |
| 20028 Gallagher St | 0.53mi | 3/1.0 (+1) | 1,020 (+13%) | 5mo | $85,000 | $83 | 45 |
| 1560 E Meyers Ave | 0.73mi | 2/1.0 | 805 (-11%) | 4mo | $72,000 | $89 | 44 |
| 3588 Poplar Ave | 0.52mi | 3/1.0 (+1) | 1,031 (+14%) | 6mo | $50,000 | $48 | 42 |
| 20206 Greeley St | 0.66mi | 3/1.0 (+1) | 1,016 (+12%) | 5mo | $52,000 | $51 | 40 |
| 19662 Charest St | 0.72mi | 3/1.0 (+1) | 1,041 (+15%) | 2mo | $69,000 | $66 | 35 |
| 1722 E Harry Ave | 0.73mi | 3/1.0 (+1) | 1,020 (+13%) | 8mo | $171,000 | $168 | 34 |
Match score weights: distance 35% · size 25% · config 20% · recency 20%. Top-matched comps best support the ARV.
Projected returns pro-forma
-3.0% appreciation · 2.35% rent growth · sell at horizon
- IRR
- -2.4%
- Equity multiple
- 0.91×
- Total profit
- $-2,486
- Equity at exit
- $14,761
- IRR
- 6.6%
- Equity multiple
- 1.48×
- Total profit
- $13,205
- Equity at exit
- $8,560
Cash invested: $27,720 (down + closing). Projections, not guarantees.
Landlord ↔ Tenant lean methodology
- Overall (STATE)
- 62 Landlord-Friendly
- State Michigan
- 62 Landlord-Friendly · EVEN
- County
- — inherits STATE
- City
- — inherits STATE
ZIP-level market 48091
- Rents YoY
- 2.4%
- Active inventory
- 170
- Price-to-rent
- 6.3×
Monthly cashflow live
- Estimated rent
- $1,318 high interval (Pro) →
- Mortgage (P&I)
- −$519
- Tax from tax record
- −$256 /mo · $3,075/yr
- Insurance
- −$41
- HOA
- −$0
- Vacancy / Maint / Mgmt
- −$277
- Net cashflow
- $225
Break-even live
Sensitivity live
| Price | -10% $281 | -5% $253 | +0% $225 | +5% $197 | +10% $169 |
|---|---|---|---|---|---|
| Rent | -10% $121 | -5% $173 | +0% $225 | +5% $277 | +10% $329 |
| Rate | -1.0pp $275 | -0.5pp $250 | base $225 | +0.5pp $199 | +1.0pp $173 |
UW: 25.0% down · 7.5% · 30yr · 1.5% tax · 5.0% vac · 8.0% maint · 8.0% mgmt
Financing live
Cash to close
- Down payment
- $24,750
- Closing costs
- $2,970
- Reserves months
- —
- Total cash needed
- —
Loan-product check · same deal, 3 products live
Conventional
25% down · 7.5% · 30yr
- Down + closing
- —
- Monthly P&I
- —
- Monthly cashflow
- —
- DSCR
- —
- Eligible?
- —
Personal DTI + credit; lowest rate.
DSCR
20% down · 8.5% · 30yr
- Down + closing
- —
- Monthly P&I
- —
- Monthly cashflow
- —
- DSCR
- —
- Eligible?
- —
No personal income docs; deal must DSCR.
Hard money
10% down · 12.0% · 12mo
- Down + closing
- —
- Monthly P&I
- —
- Monthly cashflow
- —
- DSCR
- —
- Eligible?
- —
Short-term bridge; refi at stabilization.
Rent comps 38 comps
| Address | Beds | Baths | Sqft | Rent | $/sqft | DOM | Units | Dist |
|---|---|---|---|---|---|---|---|---|
| 21155 Warner Ave Warren, MI | 2.0 | 1.0 | 756 | $1,029 | $1.36 | 25d | 1 | 0.14mi |
| 2034 John B Ave Warren, MI | 3.0 | 1.0 | 920 | $1,261 | $1.37 | 45d | 1 | 0.24mi |
| 20255 Harned St Detroit, MI | 3.0 | 1.0 | 1000 | $1,374 | $1.37 | 18d | 1 | 0.32mi |
| 21516 Dequindre Rd Warren, MI | 1.0–2.0 | 1.0 | 837 | $1,375 | $1.64 | 23d | 1 | 0.39mi |
| 1621 E Evelyn Ave Hazel Park, MI | 2.0 | 1.0 | 749 | $1,295 | $1.73 | 19d | 1 | 0.61mi |
| 3974 Berkshire Ave Warren, MI | 1.0 | 1.0 | 900 | $1,350 | $1.50 | 0d | 1 | 0.65mi |
| 19694 Gallagher St Detroit, MI | 3.0 | 1.0 | 1000 | $1,150 | $1.15 | 16d | 1 | 0.75mi |
| 1326 E Evelyn Ave Unit 1032332P Hazel Park, MI | 3.0 | 2.0 | 1097 | $6,448 | $5.88 | 0d | 1 | 0.77mi |
| 1211 E Bernhard Ave Hazel Park, MI | 2.0 | 1.0 | 721 | $1,500 | $2.08 | 25d | 1 | 0.78mi |
| 1731 E Pearl Ave Hazel Park, MI | 3.0 | 1.0 | 844 | $1,500 | $1.78 | 22d | 1 | 0.78mi |
| 19930 Binder St Detroit, MI | 3.0 | 1.0 | 1000 | $1,450 | $1.45 | 18d | 1 | 0.84mi |
| 1019 E Hayes Ave Unit 1032331P Hazel Park, MI | 3.0 | 1.0 | 1033 | $5,281 | $5.11 | 0d | 1 | 0.86mi |
| 19450 Norwood St Detroit, MI | 3.0 | 1.0 | 1000 | $1,200 | $1.20 | 6d | 1 | 0.92mi |
| 19360 Revere St Detroit, MI | 3.0 | 1.0 | 1050 | $1,250 | $1.19 | 25d | 1 | 0.97mi |
| 23077 Davey Ave Hazel Park, MI | 3.0 | 1.0 | 933 | $1,895 | $2.03 | 25d | 1 | 1.08mi |
| 2709 Capitol Ave Warren, MI | 3.0 | 2.0 | 1056 | $1,649 | $1.56 | 45d | 1 | 1.11mi |
| 429 E Milton Ave Hazel Park, MI | 3.0 | 2.0 | 1075 | $1,595 | $1.48 | 0d | 1 | 1.20mi |
| 20794 Audrey Ave Warren, MI | 3.0 | 1.0 | 954 | $1,350 | $1.42 | 45d | 1 | 1.21mi |
| 407 E Hayes Ave Hazel Park, MI | 3.0 | 1.0 | 1000 | $1,750 | $1.75 | 25d | 1 | 1.22mi |
| 3840 Bart Ave Warren, MI | 3.0 | 1.0 | 1062 | $1,350 | $1.27 | 25d | 1 | 1.24mi |
| 18882 Marx St Highland Park, MI | 2.0 | 1.0 | 1000 | $1,300 | $1.30 | 45d | 1 | 1.25mi |
| 18666 Joseph Campau St Detroit, MI | 3.0 | 1.0 | 1000 | $1,400 | $1.40 | 18d | 1 | 1.31mi |
| 27 E Milton Ave Hazel Park, MI | 1.0 | 1.0 | 568 | $1,050 | $1.85 | 16d | 1 | 1.31mi |
| 18629 Fleming St Detroit, MI | 3.0 | 1.5 | 900 | $1,150 | $1.28 | 25d | 1 | 1.31mi |
| 22580 Masch Ave Warren, MI | 3.0 | 1.0 | 988 | $1,450 | $1.47 | 25d | 1 | 1.34mi |
| 18551 Saint Aubin St Detroit, MI | 3.0 | 1.0 | 962 | $1,200 | $1.25 | 18d | 1 | 1.40mi |
| 19703 Keating St Highland Park, MI | 3.0 | 1.0 | 1000 | $1,200 | $1.20 | 18d | 1 | 1.40mi |
| 19450 Fenelon St Detroit, MI | 3.0 | 1.0 | 1062 | $1,384 | $1.30 | 6d | 1 | 1.41mi |
| 1770 E Woodward Heights Blvd Unit C6 Hazel Park, MI | 1.0 | 1.0 | 550 | $1,100 | $2.00 | 25d | 1 | 1.44mi |
| 1770 E Woodward Heights Blvd Unit E3 Hazel Park, MI | 2.0 | 1.0 | 850 | $1,300 | $1.53 | 25d | 1 | 1.44mi |
| 1770 E Woodward Heights Blvd Unit C1 Hazel Park, MI | 1.0 | 1.0 | 550 | $1,350 | $2.45 | 25d | 1 | 1.44mi |
| 1770 E Woodward Heights Blvd Hazel Park, MI | 2.0 | 1.0 | 850 | $1,525 | $1.79 | 14d | 1 | 1.44mi |
| 1770 E Woodward Heights Blvd Hazel Park, MI | 1.0–2.0 | 1.0 | 712 | $1,400 | $1.96 | 6d | 1 | 1.44mi |
| 23115 Tawas Ave Hazel Park, MI | 2.0 | 1.0 | 706 | $1,375 | $1.95 | 25d | 1 | 1.45mi |
| 1771 E Woodward Heights Blvd #8 Hazel Park, MI | 1.0 | 1.0 | 800 | $990 | $1.24 | 4d | 1 | 1.47mi |
| 21410 Panama St Warren, MI | 3.0 | 1.0 | 900 | $1,600 | $1.78 | 25d | 1 | 1.47mi |
| 155 W George Ave Hazel Park, MI | 2.0 | 1.0 | 725 | $1,000 | $1.38 | 25d | 1 | 1.48mi |
| 90 W Meyers Ave Hazel Park, MI | 2.0 | 1.0 | 831 | $1,800 | $2.17 | 25d | 1 | 1.50mi |
Listing history 50 events
-
2026-06-21days on market $99,000 Active 130 DOM
-
2026-06-18remarks 699-char remark
-
2026-06-18days on market $99,000 Active 127 DOM
-
2026-06-17days on market $99,000 Active 126 DOM
-
2026-06-16days on market $99,000 Active 125 DOM
-
2026-06-15days on market $99,000 Active 124 DOM
-
2026-06-13days on market $99,000 Active 122 DOM
-
2026-06-13days on market $99,000 Active 121 DOM
-
2026-06-09days on market $99,000 Active 118 DOM
-
2026-06-08days on market $99,000 Active 117 DOM
-
2026-06-07days on market $99,000 Active 116 DOM
-
2026-06-04days on market $99,000 Active 113 DOM
-
2026-06-03days on market $99,000 Active 112 DOM
-
2026-06-02days on market $99,000 Active 111 DOM
-
2026-06-01days on market $99,000 Active 110 DOM
-
2026-05-31days on market $99,000 Active 109 DOM
-
2026-05-04price $109,900 193-char remark
Show marketing remark (193 chars)
This beautifully remodeled very large 2 bedroom, 1 bath bungalow boasts fresh paint on the exterior and flooring throughout, fresh exterior paint and new blinds. This home has a current C of C.
-
2026-05-04price $109,900 193-char remark
Show marketing remark (193 chars)
This beautifully remodeled very large 2 bedroom, 1 bath bungalow boasts fresh paint on the exterior and flooring throughout, fresh exterior paint and new blinds. This home has a current C of C.
-
2026-05-04price $109,900
Show marketing remark (193 chars)
This beautifully remodeled very large 2 bedroom, 1 bath bungalow boasts fresh paint on the exterior and flooring throughout, fresh exterior paint and new blinds. This home has a current C of C.
-
2026-04-04price $112,900 193-char remark
Show marketing remark (193 chars)
This beautifully remodeled very large 2 bedroom, 1 bath bungalow boasts fresh paint on the exterior and flooring throughout, fresh exterior paint and new blinds. This home has a current C of C.
-
2026-04-03price $112,900 193-char remark
Show marketing remark (193 chars)
This beautifully remodeled very large 2 bedroom, 1 bath bungalow boasts fresh paint on the exterior and flooring throughout, fresh exterior paint and new blinds. This home has a current C of C.
-
2026-04-03price $112,900
Show marketing remark (193 chars)
This beautifully remodeled very large 2 bedroom, 1 bath bungalow boasts fresh paint on the exterior and flooring throughout, fresh exterior paint and new blinds. This home has a current C of C.
-
2026-02-04$114,900 Active 193-char remark
Show marketing remark (193 chars)
This beautifully remodeled very large 2 bedroom, 1 bath bungalow boasts fresh paint on the exterior and flooring throughout, fresh exterior paint and new blinds. This home has a current C of C.
-
2026-02-04$114,900 Active 193-char remark
Show marketing remark (193 chars)
This beautifully remodeled very large 2 bedroom, 1 bath bungalow boasts fresh paint on the exterior and flooring throughout, fresh exterior paint and new blinds. This home has a current C of C.
-
2026-02-04$114,900 Active
Show marketing remark (193 chars)
This beautifully remodeled very large 2 bedroom, 1 bath bungalow boasts fresh paint on the exterior and flooring throughout, fresh exterior paint and new blinds. This home has a current C of C.
-
2025-03-16historical $1,075
-
2025-03-11price $1,075
-
2025-02-01$1,150
-
2024-12-09soldstatus $65,000
-
2024-11-27status Pending
-
2024-11-27status Pending
-
2024-11-27soldstatus $65,000 Sold
-
2024-11-27soldstatus $65,000 Closed
-
2024-09-23$69,900 Active
-
2024-09-23$69,900 Active
-
2024-09-06historical
-
2024-09-06historical
-
2024-08-03price $79,800
-
2024-08-03price $79,800
-
2024-07-26$79,900 Active
-
2024-07-26$79,900 Active
-
2024-07-12soldstatus $52,000
-
2011-05-18soldstatus $6,246
-
2011-05-18soldstatus $6,246
-
2011-05-18soldstatus $6,246
-
2011-04-19historical
-
2011-04-19historical
-
2010-12-29$6,240
-
2010-12-20$6,240
-
2010-12-20$6,240
ⓘ Source: listings_history table (triggers on properties + properties_extension) + one-shot
backfill from property_details.listing_events for pre-trigger history.
Tax reassessment forecast MI · Partial reset (capped growth)
- Current annual tax
- $3,075 · $256/mo
- Projected year-2 tax
- $3,075 · $256/mo
- Expected delta
- $0/yr ($0/mo · 0.0%)
ⓘ Screening estimate from a state-policy table — verify with the county assessor before closing.
Climate risk First Street
- Flood 1/10 Low FEMA zone X (unshaded) · 0% chance over 30 yrs
- Wildfire 1/10 Low
- Heat 3/10 Moderate 7 d/yr ≥97°F today · 15 d/yr by 30 yrs out
- Wind 1/10 Low
- Air quality 4/10 Moderate 4 unhealthy d/yr today · 6 by 30 yrs out
Nearby sold comps map
Loading sold comps map…
Walkable amenities ~0.75 mi
Loading nearby amenities…
Taxation est. · year 1
- Rental income
- $15,818
- − Mortgage interest
- −$5,546
- − Property taxes
- −$3,075
- − Insurance
- −$495
- − Repairs & maintenance
- −$1,265
- − Management
- −$1,265
- − Depreciation
- −$2,880
- Taxable income
- $1,292
- Est. tax owed @ 24.0%
- −$310
- After-tax cash flow
- $2,386/yr
For passive investors: Depreciation is non-cash, so a rental often shows a tax loss while cash-flowing — sheltering income. Rental losses are passive: they offset passive income freely, and up to $25,000/yr can offset ordinary (W-2) income if you actively participate and your MAGI is under $100k (phasing out to $0 by $150k); unused losses carry forward. On sale, claimed depreciation is recaptured at up to 25%, and gains may owe capital-gains tax (a 1031 exchange can defer both). Figures are a year-1 estimate at your 24.0% rate — not tax advice; consult a CPA.
Schools (NCES district)
- District
- Fitzgerald Public Schools
- NCES district ID
- 2614460
- Math proficiency
- 8% ▼ -8.00%
- Reading proficiency
- 23% ▼ -11.00%
- Median HH income
- $34,828
- Composite
- 12.67/100
- National rank
- #9608
- State rank
- #503 of 540 in MI
Livability — Warren
- Score
- 74/100
- State rank
- #171
- US rank
- #4491
Category grades
Schools grade is shown separately in the Schools card above.
Census & demographics
- Census place
- Warren, MI
- County
- Macomb County · 638,552 people
- City population
- 114,937
- Metro
- Detroit-Warren-Dearborn, MI
- Population (ZIP)
- 30,696
- Household income
- $54,230
- Rent vs Own
- Severe rent burden
- 1296.0
Population outlook (Macomb County) Hauer SSP2
- Today (2025)
- 925,296 people
- By 2030
- 948,226 · +2.5%
- By 2040
- 983,961 · +6.3%
- By 2050
- 1,010,200 · +9.2%
- By 2075
- 1,076,222 · +16.3%
- By 2100
- 1,077,065 · +16.4%
Race, ethnicity, and origin ACS 2023
- Neighborhood character
- Diverse neighborhood (Simpson 0.68)
- Race & ethnicity
- White 47% Black 25% Asian 19% Two or more races 5% Hispanic / Latino 3% Native American 2%
- Common ancestry
- Romanian 7% Lithuanian 2% Slovak 1%
- Foreign-born
- 16% · Canada
- Languages at home
- 77% English-only · Other Indo-European 14% Other Asian/Pacific 3% Russian/Polish/Slavic 2%
Political lean MEDSL · Macomb
- 2024 margin
- R (+13.7) · D 42.2% · R 55.9% · Other 1.9%
- 2008→2024 swing
- -22.3pp toward R · 2008: 8.6pp · 2024: -13.7pp
- All cycles
- 2024: R+13.7 2020: R+8.1 2016: R+11.6 2012: D+4.0 2008: D+8.6
Not yet ingested
- Civics
- —
Market trends
- HPI YoY
- ▼ -199.66%
- Current HPI
- 177.9273
- Rent YoY
- ▲ 2.35%
- Metro
- Detroit-Warren-Dearborn, MI
- State GDP YoY
- ▲ 1.37%
- F500 in state
- 28
Industry mix (Fortune 500 HQ in MI)
| Industry | F500 HQs | Revenue |
|---|---|---|
| Automotive Parts | 3 | $48B |
|
||
| Automotive | 2 | $372B |
|
||
| Chemicals | 1 | $45B |
|
||
| Automotive Retail | 1 | $29B |
|
||
| Healthcare / Medical Devices | 1 | $23B |
|
||
| Automotive Technology | 1 | $20B |
|
||
Price history
+267.6% since first listed39 events — show timeline
- 2026-05-04 Price Changed $109,900 MiRealSource-MiMLS
- 2026-05-04 Price Changed $109,900 REALCOMP
- 2026-05-04 Price Changed $109,900 SW Michigan MLS
- 2026-04-04 Price Changed $112,900 MiRealSource-MiMLS
- 2026-04-03 Price Changed $112,900 REALCOMP
- 2026-04-03 Price Changed $112,900 SW Michigan MLS
- 2026-02-04 Listed $114,900 SW Michigan MLS
- 2026-02-04 Listed $114,900 REALCOMP
- 2026-02-04 Listed $114,900 MiRealSource-MiMLS
- 2025-03-16 Rental Removed $1,075 APPFOLIO
- 2025-03-11 Price Changed $1,075 APPFOLIO
- 2025-02-01 Listed for Rent $1,150 APPFOLIO
- 2024-12-09 Sold (Public Records) $65,000 Public Records
- 2024-11-27 Pending — MiRealSource-MiMLS
- 2024-11-27 Pending — REALCOMP
- 2024-11-27 Sold (MLS) $65,000 MiRealSource-MiMLS
- 2024-11-27 Sold (MLS) $65,000 REALCOMP
- 2024-09-23 Listed $69,900 MiRealSource-MiMLS
- 2024-09-23 Listed $69,900 REALCOMP
- 2024-09-06 Listing Removed — MiRealSource-MiMLS
- 2024-09-06 Listing Removed — REALCOMP
- 2024-08-03 Price Changed $79,800 MiRealSource-MiMLS
- 2024-08-03 Price Changed $79,800 REALCOMP
- 2024-07-26 Listed $79,900 MiRealSource-MiMLS
- 2024-07-26 Listed $79,900 REALCOMP
- 2024-07-12 Sold (Public Records) $52,000 Public Records
- 2011-05-18 Sold (MLS) $6,246 MiRealSource-MiMLS
- 2011-05-18 Sold (MLS) $6,246 REALCOMP
- 2011-05-18 Sold (MLS) $6,246 MiRealSource-MiMLS
- 2011-04-19 Listing Removed — MiRealSource-MiMLS
- 2011-04-19 Listing Removed — MiRealSource-MiMLS
- 2010-12-29 Listed $6,240 MiRealSource-MiMLS
- 2010-12-20 Listed $6,240 MiRealSource-MiMLS
- 2010-12-20 Listed $6,240 REALCOMP
- 2003-10-20 Sold (Public Records) $58,200 Public Records
- 2003-04-17 Sold (MLS) $58,200 MiRealSource-MiMLS
- 2003-02-21 Listing Removed — MiRealSource-MiMLS
- 2003-01-07 Listed $59,900 MiRealSource-MiMLS
- 1997-09-10 Sold (Public Records) $29,900 Public Records
Property tax history
+12.9%/yrLatest (2025): $3,075 · -25.1% YoY. Source: county tax records.
Cash-flow waterfall
monthlySold comps — $/sqft
last 12 mo · ≤1 miLoading sold comps…