155 Vijil Loop · Cibolo, TX
Flood risk 1/10 · Minimal
- FEMA flood zone
- AE
- Chance of flooding over 30 yrs
- 0.0%
- Est. flood insurance / yr
- $1,737 – $8,500
Fire risk 5/10 · Moderate
- Est. fire insurance / yr
- $1,222 – $2,270
Heat risk 8/10 · Major
- Hot days now (above 109°F)
- 6 days/yr
- Hot days in 30 yrs
- 17 days/yr
Wind risk 8/10 · Major
- Chance of severe wind over 30 yrs
- 80.0%
Air-quality risk 1/10 · Minimal
- Unhealthy air days now
- 0 days/yr
- Unhealthy air days in 30 yrs
- 0 days/yr
Risk factors via First Street. Map © Google.
Why this score? — see what drove the B grade
The composite is a weighted blend of 9 inputs, each scored 0–100. Each bar is that input's sub-score; the figure is the points it added to the 100-point composite (weight × sub-score).
- Cash flow +27.8/30.0
- DSCR +9.8/10.0
- ARV discount +7.5/15.0
- 1% rule +7.3/10.0
- Appreciation +5.2/10.0
- Schools +4.4/10.0
- Livability +3.6/5.0
- Rent growth +3.1/5.0
- Condition / age +2.5/5.0
$170,000
🖨 Deal sheet 📄 Offer letter ✓ Due diligence
Listing remarks
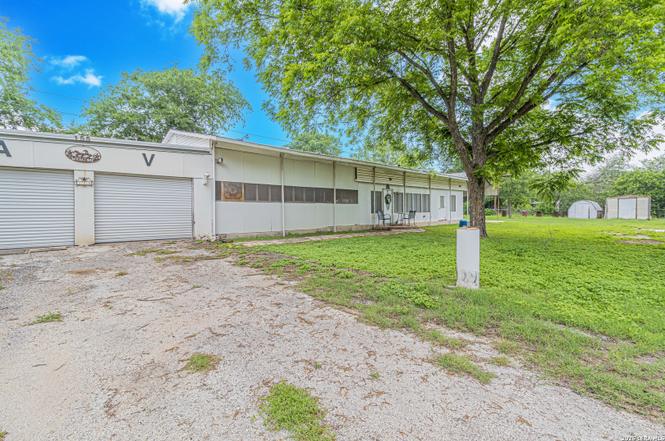
Situated on nearly half an acre in the growing community of Cibolo, Texas, this 4-bedroom, 2-bath manufactured home offers approximately 1,569 square feet of comfortable living space with room to make it your own. The spacious lot provides room for outdoor entertaining, gardening, storage, workshop space, or future improvements. Conveniently located near FM 78, I-35, Randolph Air Force Base, shopping, dining, and the rapidly expanding Cibolo and Schertz areas, you'll enjoy easy access to everyday conveniences while still having the benefit of a larger homesite. Please note: The property is located within a FEMA-designated flood zone. Buyers are encouraged to perform their own due diligence
Key facts
- Outdoor storage
- Workshop space
- Near fm 78
Tags
Property features AI
Finance
- Other: Possession at closing/funding; For sale
- Financial info: Not a down payment resource participant
- HOA & community: Located in GREEN VALLEY MHP / GREEN VALLEY PARK #2
Exterior
- Parking: Detached parking
- Utilities: Propane gas; GVEC electricity; Green Valley water; Septic sewer system; Water system available
- Home design: Siding exterior; Front faces east; Pre-owned
- Construction: Approximately 52 years old; Other foundation (see remarks); Other roof type (see remarks)
- Exterior features: Screened porch; Storage building / shed; Workshop; Mature trees; Secluded setting; Street paved; Private road
Interior
- Kitchen: Eat-in kitchen (15 x 8)
- Bedrooms: Master bedroom with walk-in closet and full bath (10 x 10); Bedroom 2 (10 x 10); Bedroom 3 (10 x 10); Bedroom 4 (10 x 10)
- Flooring: Carpeting
- Bathrooms: Two full bathrooms; Master bath with shower only (6 x 10)
- Heating & cooling: Central heating; Propane (owned) heating fuel; One central A/C and one window A/C
- Interior features: Ceiling fans; Two living areas; Separate dining room; Eat-in kitchen; Washer connection; Dryer connection
- Laundry & utility: Washer connection; Dryer connection
Neighborhood map
What this means for you Summary
Snapshot
- This is a 4-bed/2.0-bath manufactured listed at $170k.
Deal economics
- At list price, monthly cash flow is $93 ($1k/yr) — positive.
- The deal already cash-flows at list — no discount required.
- Meets the 1% rule at list price ($2k rent vs $170k).
- Cap rate 10.0% vs local median 3.3% in Cibolo — top-decile yield for the area; either an underpriced asset or a hidden risk that comps aren't pricing in. Stress-test before assuming the spread holds.
Location & tenants
- Location reads 72/100 on livability (#261 in TX) — a middle-class / working-renter tenant base. Strengths: employment A+, housing A+, crime A; Watch: amenities F, commute F, health & safety F.
- Schertz-Cibolo-U City ISD (suburban): math 49% / reading 48% proficiency, ranked #152 of 826 in TX (top 18%) — families likely to look elsewhere, expect single-tenant / working-renter base with shorter leases.
- Zoned schools: Watts El (math 44% / reading 44%, grade F, #1,243 of 4,322 statewide, top 29%, 593 students, 44% FRL); Samuel Clemens H S (math 45% / reading 60%, grade C-, #444 of 1,632 statewide, top 27%, 2,544 students, 30% FRL).
- Market conditions: Rents rising (+2.4%/yr); 739 active listings in the ZIP; 16 comparable units currently listed for rent nearby; rentals at typical pace (median 18d on market — plan ~3-4 weeks tenant-placement turnaround); high-income renter base; 2,064 units permitted in Guadalupe County in 2024 (133 in 5+ unit buildings).
Forward outlook
- In year one you build about $2k of equity ($1k loan paydown + $800 appreciation (0.5% local appreciation)).
- Guadalupe County population projected at +61% by 2050 — long-run rental-demand tailwind backs the buy-and-hold thesis.
- At projected returns (0.5% appreciation + 2.4% rent growth), your $48k cash investment doubles in ~10 years — after that, you're playing with house money.
Negotiation context
- Only 12 days on market — expect competitive offers; lowballing is unlikely to land.
- 2 sale attempts since 2y ago with the ask held roughly flat each time — persistent listings suggest the price (not the market) is what's stuck; bring a comps-based counter.
Risks & watch-outs
- Watch-outs: flood insurance adds $427/mo.
- Climate carrying-cost: in FEMA flood zone AE (mandatory federal flood insurance); severe wind risk, 80% chance of damaging wind over 30y; moderate wildfire risk; extreme-heat days projected 6→17/yr by 2055 (HVAC capex compounding) — expect insurance premiums to compound above CPI over the hold.
Questions for the listing agent
- Built in 1974 — when were the roof, HVAC, electrical panel, plumbing, and water heater last replaced?
- What's the actual annual flood-insurance premium (NFIP or private), and is the property in a SFHA with mandatory coverage?
- Is there a deadline driving the sale (1031 exchange, divorce, estate, relocation)? That informs how much negotiation room exists.
- Schools are B-rated — typically a magnet for longer-tenancy family renters. What's the average tenant stay here, and is there a school-zone premium baked into asking?
- What's the average days-on-market for RENTAL listings here right now (not sales)? A rising rental-DOM trend means longer vacancies and softer asking-rent achievability than the comps imply.
- What's the recent tenant-quality profile in this submarket — average credit score on applications, eviction rate, late-payment / NSF rate, and stable-employment percentage? A property-management company in the area should have these aggregated.
- How much new for-sale + rental construction is in the pipeline within 1–3 miles? Heavy new supply typically softens prices + rents 12–24 months out; constrained supply supports both.
Investment metrics
- 1% rule
- 1.23% ✓
- Cap rate
- 9.96%
- Cash-on-cash
- 13.09%
- DSCR
- 1.58
- GRM
- 6.8
CMA / ARV
No comps found within radius.
Projected returns pro-forma
0.47% appreciation · 2.42% rent growth · sell at horizon
- IRR
- 1.6%
- Equity multiple
- 1.08×
- Total profit
- $3,775
- Equity at exit
- $53,399
- IRR
- 6.3%
- Equity multiple
- 1.71×
- Total profit
- $33,725
- Equity at exit
- $67,505
Cash invested: $47,600 (down + closing). Projections, not guarantees.
Landlord ↔ Tenant lean methodology
- Overall (STATE)
- 87 Strongly Landlord-Friendly
- State Texas
- 87 Strongly Landlord-Friendly · R+5
- County
- — inherits STATE
- City
- — inherits STATE
ZIP-level market 78108
- Home prices YoY
- 0.3%
- Rents YoY
- 2.4%
- Active inventory
- 739
- Price-to-rent
- 6.8×
Monthly cashflow live
- Estimated rent
- $2,097 high interval (Pro) →
- Mortgage (P&I)
- −$891
- Tax from tax record
- −$175 /mo · $2,103/yr
- Insurance
- −$71
- Flood insurance flood zone
- −$427 /mo · $5,118/yr
- HOA
- −$0
- Vacancy / Maint / Mgmt
- −$440
- Net cashflow
- $93
Break-even live
UW: 25.0% down · 7.5% · 30yr · 1.5% tax · 5.0% vac · 8.0% maint · 8.0% mgmt
Financing live
Cash to close
- Down payment
- $42,500
- Closing costs
- $5,100
- Reserves months
- —
- Total cash needed
- —
Loan-product check · same deal, 3 products live
Conventional
25% down · 7.5% · 30yr
- Down + closing
- —
- Monthly P&I
- —
- Monthly cashflow
- —
- DSCR
- —
- Eligible?
- —
Personal DTI + credit; lowest rate.
DSCR
20% down · 8.5% · 30yr
- Down + closing
- —
- Monthly P&I
- —
- Monthly cashflow
- —
- DSCR
- —
- Eligible?
- —
No personal income docs; deal must DSCR.
Hard money
10% down · 12.0% · 12mo
- Down + closing
- —
- Monthly P&I
- —
- Monthly cashflow
- —
- DSCR
- —
- Eligible?
- —
Short-term bridge; refi at stabilization.
Rent comps 16 comps
| Address | Beds | Baths | Sqft | Rent | $/sqft | DOM | Units | Dist |
|---|---|---|---|---|---|---|---|---|
| 125 Clinton Rd Cibolo, TX | 2.0–3.0 | 2.0 | 1056 | $1,235 | $1.17 | 23d | 3 | 0.34mi |
| 528 Whispering Wl Cibolo, TX | 3.0–5.0 | 2.0–3.5 | 2059 | $2,342 | $1.14 | 1d | 3 | 0.54mi |
| 568 Lilac Shls Cibolo, TX | 4.0 | 2.0 | 1847 | $2,200 | $1.19 | 17d | 1 | 0.60mi |
| 804 Red Riv Cibolo, TX | 3.0 | 2.0 | 1650 | $1,950 | $1.18 | 17d | 1 | 0.75mi |
| 224 Broad Oak Dr Cibolo, TX | 3.0 | 1.0–2.0 | 966 | $1,992 | $2.06 | 1d | 35 | 0.83mi |
| 101 Santa Clara St Cibolo, TX | 3.0 | 2.0 | 1740 | $1,750 | $1.01 | 12d | 1 | 0.91mi |
| 117 Grand Rpds Cibolo, TX | 4.0 | 2.0 | 1888 | $2,050 | $1.09 | 4d | 1 | 1.02mi |
| 305 Colbert Fry Cibolo, TX | 4.0 | 2.0 | 1901 | $2,350 | $1.24 | 23d | 1 | 1.09mi |
| 325 Colbert Fry Cibolo, TX | 3.0 | 2.0 | 1442 | $2,050 | $1.42 | 23d | 1 | 1.15mi |
| 121 Little Wichita Cibolo, TX | 4.0 | 2.0 | 1888 | $1,895 | $1.00 | 23d | 1 | 1.21mi |
| 112 Stag Way Schertz, TX | 4.0 | 2.0 | 1950 | $2,150 | $1.10 | 43d | 1 | 1.36mi |
| 132 Niemietz Cv Cibolo, TX | 3.0 | 2.0 | 1596 | $1,900 | $1.19 | 23d | 1 | 1.37mi |
| 325 Longhorn Way Cibolo, TX | 3.0 | 2.0 | 1650 | $1,800 | $1.09 | 2d | 1 | 1.44mi |
| 405 Sika Way Schertz, TX | 3.0 | 2.0 | 2002 | $2,150 | $1.07 | 1d | 1 | 1.44mi |
| 315 Cibolo Cmns Cibolo, TX | 1.0–3.0 | 1.0–2.0 | 1052 | $2,086 | $1.98 | 1d | 22 | 1.46mi |
| 148 Sambar Main Schertz, TX | 4.0 | 2.5 | 1868 | $2,100 | $1.12 | 1d | 1 | 1.47mi |
Listing history 10 events
-
2026-06-18days on market $170,000 Active 12 DOM
-
2026-06-17statusdays on market $170,000 Active 11 DOM
-
2026-06-16days on market $170,000 New 10 DOM
-
2026-06-15days on market $170,000 New 9 DOM
-
2026-06-13days on market $170,000 New 7 DOM
-
2026-06-13days on market $170,000 New 6 DOM
-
2026-06-09days on market $170,000 New 3 DOM
-
2026-06-08days on market $170,000 New 2 DOM
-
2026-06-07remarks 699-char remark
-
2026-06-07$170,000 New 1 DOM
ⓘ Source: listings_history table (triggers on properties + properties_extension) + one-shot
backfill from property_details.listing_events for pre-trigger history.
Tax reassessment forecast TX · Resets to sale price
- Current annual tax
- $2,103 · $175/mo
- Projected year-2 tax
- $3,111 · $259/mo
- Expected delta
- +$1,008/yr (+$84/mo · 47.9%)
ⓘ Screening estimate from a state-policy table — verify with the county assessor before closing.
Climate risk First Street
- Flood 1/10 Low FEMA zone AE · 0% chance over 30 yrs
- Wildfire 5/10 Major
- Heat 8/10 Severe 6 d/yr ≥109°F today · 17 d/yr by 30 yrs out
- Wind 8/10 Severe 80% chance of damaging wind over 30 yrs
- Air quality 1/10 Low 0 unhealthy d/yr today · 0 by 30 yrs out
Nearby sold comps map
Loading sold comps map…
Walkable amenities ~0.75 mi
Loading nearby amenities…
Taxation est. · year 1
- Rental income
- $25,166
- − Mortgage interest
- −$9,523
- − Property taxes
- −$2,103
- − Insurance
- −$5,968
- − Repairs & maintenance
- −$2,013
- − Management
- −$2,013
- − Depreciation
- −$4,945
- Taxable loss
- −$1,400
- Est. tax savings @ 24.0%
- +$336
- After-tax cash flow
- $1,448/yr
For passive investors: Depreciation is non-cash, so a rental often shows a tax loss while cash-flowing — sheltering income. Rental losses are passive: they offset passive income freely, and up to $25,000/yr can offset ordinary (W-2) income if you actively participate and your MAGI is under $100k (phasing out to $0 by $150k); unused losses carry forward. On sale, claimed depreciation is recaptured at up to 25%, and gains may owe capital-gains tax (a 1031 exchange can defer both). Figures are a year-1 estimate at your 24.0% rate — not tax advice; consult a CPA.
Schools (NCES district)
- District
- Schertz-Cibolo-U City ISD
- NCES district ID
- 4839480
- Math proficiency
- 49% ▼ -12.00%
- Reading proficiency
- 48% ▼ -4.00%
- Median HH income
- $75,790
- Composite
- 44.02/100
- National rank
- #2886
- State rank
- #152 of 826 in TX
Livability — Cibolo
- Score
- 72/100
- State rank
- #261
- US rank
- #6177
Category grades
Schools grade is shown separately in the Schools card above.
Census & demographics
- Census place
- Cibolo, TX
- County
- Guadalupe County · 147,291 people
- City population
- 49,784
- Metro
- San Antonio-New Braunfels, TX
- Population (ZIP)
- 49,784
- Household income
- $113,004
- Rent vs Own
- Severe rent burden
- 521.0
Population outlook (Guadalupe County) Hauer SSP2
- Today (2025)
- 196,854 people
- By 2030
- 220,210 · +11.9%
- By 2040
- 268,004 · +36.1%
- By 2050
- 316,333 · +60.7%
- By 2075
- 434,747 · +120.8%
- By 2100
- 520,447 · +164.4%
Race, ethnicity, and origin ACS 2023
- Neighborhood character
- Diverse neighborhood (Simpson 0.68)
- Race & ethnicity
- White 46% Hispanic / Latino 30% Two or more races 22% Black 13% Asian 3%
- Hispanic origin (detail)
- Mexican 22% Puerto Rican 4%
- Common ancestry
- Italian 2% Lithuanian 2% Slovak 2%
- Foreign-born
- 7% · Canada, Vietnam, China
- Languages at home
- 83% English-only · Spanish 13% Vietnamese 1% German/W. Germanic 1%
Political lean MEDSL · Guadalupe
- 2024 margin
- Strong R (+29.5) · D 34.8% · R 64.3%
- 2008→2024 swing
- +1.5pp toward D · 2008: -31.0pp · 2024: -29.5pp
- All cycles
- 2024: R+29.5 2020: R+24.2 2016: R+31.8 2012: R+35.1 2008: R+31.0
Not yet ingested
- Civics
- —
Market trends
- HPI YoY
- ▲ 0.47%
- Current HPI
- 182.7296
- Rent YoY
- ▲ 2.42%
- Metro
- San Antonio-New Braunfels, TX
- State GDP YoY
- ▲ 3.95%
- F500 in state
- 110
Industry mix (Fortune 500 HQ in TX)
| Industry | F500 HQs | Revenue |
|---|---|---|
| Energy | 16 | $1,198B |
|
||
| Technology | 5 | $198B |
|
||
| Engineering / Construction | 4 | $72B |
|
||
| Energy Services | 3 | $60B |
|
||
| Utilities | 3 | $41B |
|
||
| Healthcare | 2 | $330B |
|
||
Price history
-10.5% since first listed3 events — show timeline
- 2026-06-06 Listed $170,000 LERA
- 2025-03-12 Listing Removed — LERA
- 2024-10-03 Listed $190,000 LERA
Property tax history
+4.1%/yrLatest (2026): $2,103 · +5.5% YoY. Source: county tax records.
Cash-flow waterfall
monthlySold comps — $/sqft
last 12 mo · ≤1 miLoading sold comps…