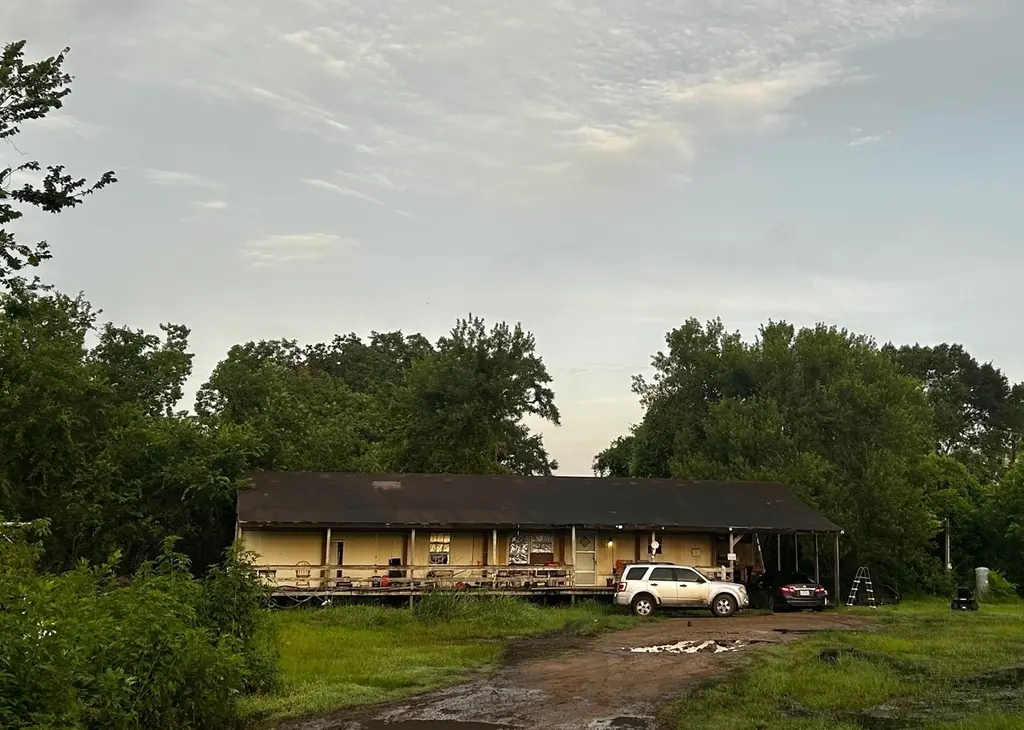
8748 Fm 524 · Sweeny, TX
Flood risk 1/10 · Minimal
- FEMA flood zone
- X (unshaded)
- Chance of flooding over 30 yrs
- 0.0%
- Est. flood insurance / yr
- $507 – $1,088
Fire risk 4/10 · Minor
- Est. fire insurance / yr
- $1,222 – $2,270
Heat risk 9/10 · Severe
- Hot days now (above 109°F)
- 7 days/yr
- Hot days in 30 yrs
- 24 days/yr
Wind risk 9/10 · Severe
- Chance of severe wind over 30 yrs
- 99.0%
Air-quality risk 2/10 · Minimal
- Unhealthy air days now
- 1 days/yr
- Unhealthy air days in 30 yrs
- 1 days/yr
Risk factors via First Street. Map © Google.
Why this score? — see what drove the C- grade
The composite is a weighted blend of 9 inputs, each scored 0–100. Each bar is that input's sub-score; the figure is the points it added to the 100-point composite (weight × sub-score).
- Cash flow +14.1/30.0
- Appreciation +10.0/10.0
- ARV discount +7.5/15.0
- DSCR +4.3/10.0
- 1% rule +3.6/10.0
- Livability +3.6/5.0
- Schools +3.1/10.0
- Rent growth +2.5/5.0
- Condition / age +2.5/5.0
$150,000
🖨 Deal sheet 📄 Offer letter ✓ Due diligence
Listing remarks MLS
This charming 3-bedroom, 1-bath home sits on just under an acre of land—giving you room to breathe, garden, or just enjoy a little extra space. Tucked away for privacy but still conveniently close to the main road, you get the best of both worlds: peace and accessibility. A perfect blend of country feel with small-town charm. Don’t miss your chance to call this one home!
Key facts
- Garden
- Privacy
- Acre of land
Tags
Neighborhood map
What this means for you Summary
Snapshot
- This is a 3-bed/1.0-bath manufactured listed at $150k.
Deal economics
- At list price, monthly cash flow is $23 ($280/yr) — positive.
- The deal already cash-flows at list — no discount required.
- To meet the 1% rule (rent ≥ 1% of price), the offer needs to be $129k (14.1% below list).
- Recommended offer: $129k (14.1% below list) — sets the bar for 1% rule.
- Cap rate 6.5% vs local median 3.7% in Sweeny — top-decile yield for the area; either an underpriced asset or a hidden risk that comps aren't pricing in. Stress-test before assuming the spread holds.
Location & tenants
- Location reads 71/100 on livability (#306 in TX) — a middle-class / working-renter tenant base. Strengths: cost of living A+, housing A+, crime A; Watch: amenities F, commute F.
- Sweeny ISD (town): math 32% / reading 40% proficiency, ranked #480 of 826 in TX (top 58%) — families likely to look elsewhere, expect single-tenant / working-renter base with shorter leases.
- Market conditions: 113 active listings in the ZIP; 3,960 units permitted in Brazoria County in 2024 (593 in 5+ unit buildings).
Forward outlook
- In year one you build about $16k of equity ($1k loan paydown + $15k appreciation (10.0% local appreciation)).
- Brazoria County population projected at +44% by 2050 — long-run rental-demand tailwind backs the buy-and-hold thesis.
- At projected returns (10.0% appreciation + 3.0% rent growth), your $42k cash investment doubles in ~3 years — after that, you're playing with house money.
- By year 3, paydown + projected appreciation supports a ~$41k cash-out refi (75% LTV) — recoverable capital for the next deal without selling this one.
Negotiation context
- It's been on market 365 days — a 12% lower offer ($132k) is reasonable based on typical stale-listing flexibility.
- 2 sale attempts since 6y ago with the ask held roughly flat each time — persistent listings suggest the price (not the market) is what's stuck; bring a comps-based counter.
Risks & watch-outs
- Climate carrying-cost: severe wind risk, 99% chance of damaging wind over 30y; extreme-heat days projected 7→24/yr by 2055 (HVAC capex compounding) — expect insurance premiums to compound above CPI over the hold.
Questions for the listing agent
- It's been on market 365 days. Have you received any prior offers? Is the seller open to a 14% concession, seller financing, or rate buy-down credit?
- Built in 1978 — when were the roof, HVAC, electrical panel, plumbing, and water heater last replaced?
- Why hasn't it sold? Are there any deal-killer items the seller is aware of (foundation, flood, title, zoning, code violations)?
- Is there a deadline driving the sale (1031 exchange, divorce, estate, relocation)? That informs how much negotiation room exists.
- What's the average days-on-market for RENTAL listings here right now (not sales)? A rising rental-DOM trend means longer vacancies and softer asking-rent achievability than the comps imply.
- What's the recent tenant-quality profile in this submarket — average credit score on applications, eviction rate, late-payment / NSF rate, and stable-employment percentage? A property-management company in the area should have these aggregated.
- How much new for-sale + rental construction is in the pipeline within 1–3 miles? Heavy new supply typically softens prices + rents 12–24 months out; constrained supply supports both.
Investment metrics
- 1% rule
- 0.86% ✗
- Cap rate
- 6.48%
- Cash-on-cash
- 0.67%
- DSCR
- 1.03
- GRM
- 9.7
CMA / ARV
No comps found within radius.
Projected returns pro-forma
10.0% appreciation · 3.0% rent growth · sell at horizon
- IRR
- 24.8%
- Equity multiple
- 2.98×
- Total profit
- $83,171
- Equity at exit
- $135,132
- IRR
- 21.9%
- Equity multiple
- 6.80×
- Total profit
- $243,746
- Equity at exit
- $291,417
Cash invested: $42,000 (down + closing). Projections, not guarantees.
Landlord ↔ Tenant lean methodology
- Overall (STATE)
- 87 Strongly Landlord-Friendly
- State Texas
- 87 Strongly Landlord-Friendly · R+5
- County
- — inherits STATE
- City
- — inherits STATE
ZIP-level market 77480
- Home prices YoY
- 12.0%
- Active inventory
- 113
- Price-to-rent
- 9.7×
Monthly cashflow live
- Estimated rent
- $1,288 medium interval (Pro) →
- Mortgage (P&I)
- −$787
- Tax from tax record
- −$145 /mo · $1,742/yr
- Insurance
- −$62
- HOA
- −$0
- Vacancy / Maint / Mgmt
- −$271
- Net cashflow
- $23
Break-even live
UW: 25.0% down · 7.5% · 30yr · 1.5% tax · 5.0% vac · 8.0% maint · 8.0% mgmt
Financing live
Cash to close
- Down payment
- $37,500
- Closing costs
- $4,500
- Reserves months
- —
- Total cash needed
- —
Loan-product check · same deal, 3 products live
Conventional
25% down · 7.5% · 30yr
- Down + closing
- —
- Monthly P&I
- —
- Monthly cashflow
- —
- DSCR
- —
- Eligible?
- —
Personal DTI + credit; lowest rate.
DSCR
20% down · 8.5% · 30yr
- Down + closing
- —
- Monthly P&I
- —
- Monthly cashflow
- —
- DSCR
- —
- Eligible?
- —
No personal income docs; deal must DSCR.
Hard money
10% down · 12.0% · 12mo
- Down + closing
- —
- Monthly P&I
- —
- Monthly cashflow
- —
- DSCR
- —
- Eligible?
- —
Short-term bridge; refi at stabilization.
Listing history 20 events
-
2026-06-16days on market $150,000 Active 365 DOM
-
2026-06-15days on market $150,000 Active 364 DOM
-
2026-06-14days on market $150,000 Active 362 DOM
-
2026-06-12days on market $150,000 Active 361 DOM
-
2026-06-09days on market $150,000 Active 358 DOM
-
2026-06-08days on market $150,000 Active 357 DOM
-
2026-06-07days on market $150,000 Active 356 DOM
-
2026-06-07days on market $150,000 Active 355 DOM
-
2026-06-03days on market $150,000 Active 352 DOM
-
2026-06-02days on market $150,000 Active 351 DOM
-
2026-06-01days on market $150,000 Active 350 DOM
-
2026-05-31days on market $150,000 Active 349 DOM
-
2026-05-30days on market $150,000 Active 348 DOM
-
2025-06-16$150,000 Active 385-char remark
Show marketing remark (385 chars)
This charming 3-bedroom, 1-bath home sits on just under an acre of land—giving you room to breathe, garden, or just enjoy a little extra space. Tucked away for privacy but still conveniently close to the main road, you get the best of both worlds: peace and accessibility. A perfect blend of country feel with small-town charm. Don’t miss your chance to call this one home!
-
2021-03-16historical
-
2020-12-16$98,000 Active
-
2020-08-19soldstatus
-
2018-10-31soldstatus
-
2004-12-21soldstatus
-
1996-03-03soldstatus
ⓘ Source: listings_history table (triggers on properties + properties_extension) + one-shot
backfill from property_details.listing_events for pre-trigger history.
Tax reassessment forecast TX · Resets to sale price
- Current annual tax
- $1,742 · $145/mo
- Projected year-2 tax
- $2,745 · $229/mo
- Expected delta
- +$1,003/yr (+$84/mo · 57.5%)
ⓘ Screening estimate from a state-policy table — verify with the county assessor before closing.
Climate risk First Street
- Flood 1/10 Low FEMA zone X (unshaded) · 0% chance over 30 yrs
- Wildfire 4/10 Moderate
- Heat 9/10 Extreme 7 d/yr ≥109°F today · 24 d/yr by 30 yrs out
- Wind 9/10 Extreme 99% chance of damaging wind over 30 yrs
- Air quality 2/10 Low 1 unhealthy d/yr today · 1 by 30 yrs out
Nearby sold comps map
Loading sold comps map…
Walkable amenities ~0.75 mi
Loading nearby amenities…
Taxation est. · year 1
- Rental income
- $15,458
- − Mortgage interest
- −$8,402
- − Property taxes
- −$1,742
- − Insurance
- −$750
- − Repairs & maintenance
- −$1,237
- − Management
- −$1,237
- − Depreciation
- −$4,364
- Taxable loss
- −$2,274
- Est. tax savings @ 24.0%
- +$546
- After-tax cash flow
- $825/yr
For passive investors: Depreciation is non-cash, so a rental often shows a tax loss while cash-flowing — sheltering income. Rental losses are passive: they offset passive income freely, and up to $25,000/yr can offset ordinary (W-2) income if you actively participate and your MAGI is under $100k (phasing out to $0 by $150k); unused losses carry forward. On sale, claimed depreciation is recaptured at up to 25%, and gains may owe capital-gains tax (a 1031 exchange can defer both). Figures are a year-1 estimate at your 24.0% rate — not tax advice; consult a CPA.
Schools (NCES district)
- District
- Sweeny ISD
- NCES district ID
- 4841970
- Math proficiency
- 32% ▼ -12.00%
- Reading proficiency
- 40% ▼ -1.00%
- Median HH income
- $53,607
- Composite
- 31.49/100
- National rank
- #5975
- State rank
- #480 of 826 in TX
Livability — Sweeny
- Score
- 71/100
- State rank
- #306
- US rank
- #6914
Category grades
Schools grade is shown separately in the Schools card above.
Census & demographics
- Population (ZIP)
- 8,252
Population outlook (Brazoria County) Hauer SSP2
- Today (2025)
- 420,414 people
- By 2030
- 457,585 · +8.8%
- By 2040
- 532,232 · +26.6%
- By 2050
- 605,399 · +44.0%
- By 2075
- 779,358 · +85.4%
- By 2100
- 883,759 · +110.2%
Race, ethnicity, and origin ACS 2023
- Neighborhood character
- Predominantly White (71%)
- Race & ethnicity
- White 71% Hispanic / Latino 17% Black 8% Two or more races 7% Asian 1%
- Hispanic origin (detail)
- Mexican 16%
- Common ancestry
- Italian 3% Slovak 3% Iranian 1%
- Foreign-born
- 4% · Canada, China
- Languages at home
- 90% English-only · Spanish 9% Tagalog/Filipino 1%
Political lean MEDSL · Brazoria
- 2024 margin
- R (+19.7) · D 39.5% · R 59.2% · Other 1.3%
- 2008→2024 swing
- +9.9pp toward D · 2008: -29.6pp · 2024: -19.7pp
- All cycles
- 2024: R+19.7 2020: R+18.2 2016: R+24.6 2012: R+34.2 2008: R+29.6
Not yet ingested
- Civics
- —
Market trends
- HPI YoY
- ▲ 35.27%
- Current HPI
- 328.8657
- Rent YoY
- —
- Metro
- —
- State GDP YoY
- ▲ 3.95%
- F500 in state
- 110
Industry mix (Fortune 500 HQ in TX)
| Industry | F500 HQs | Revenue |
|---|---|---|
| Energy | 16 | $1,198B |
|
||
| Technology | 5 | $198B |
|
||
| Engineering / Construction | 4 | $72B |
|
||
| Energy Services | 3 | $60B |
|
||
| Utilities | 3 | $41B |
|
||
| Healthcare | 2 | $330B |
|
||
Price history
+53.1% since first listed7 events — show timeline
- 2025-06-16 Listed $150,000 HARMLS
- 2021-03-16 Listing Removed — HARMLS
- 2020-12-16 Listed $98,000 HARMLS
- 2020-08-19 Sold (Public Records) — Public Records
- 2018-10-31 Sold (Public Records) — Public Records
- 2004-12-21 Sold (Public Records) — Public Records
- 1996-03-03 Sold (Public Records) — Public Records
Property tax history
+7.8%/yrLatest (2025): $1,742 · -7.2% YoY. Source: county tax records.
Cash-flow waterfall
monthlySold comps — $/sqft
last 12 mo · ≤1 miLoading sold comps…