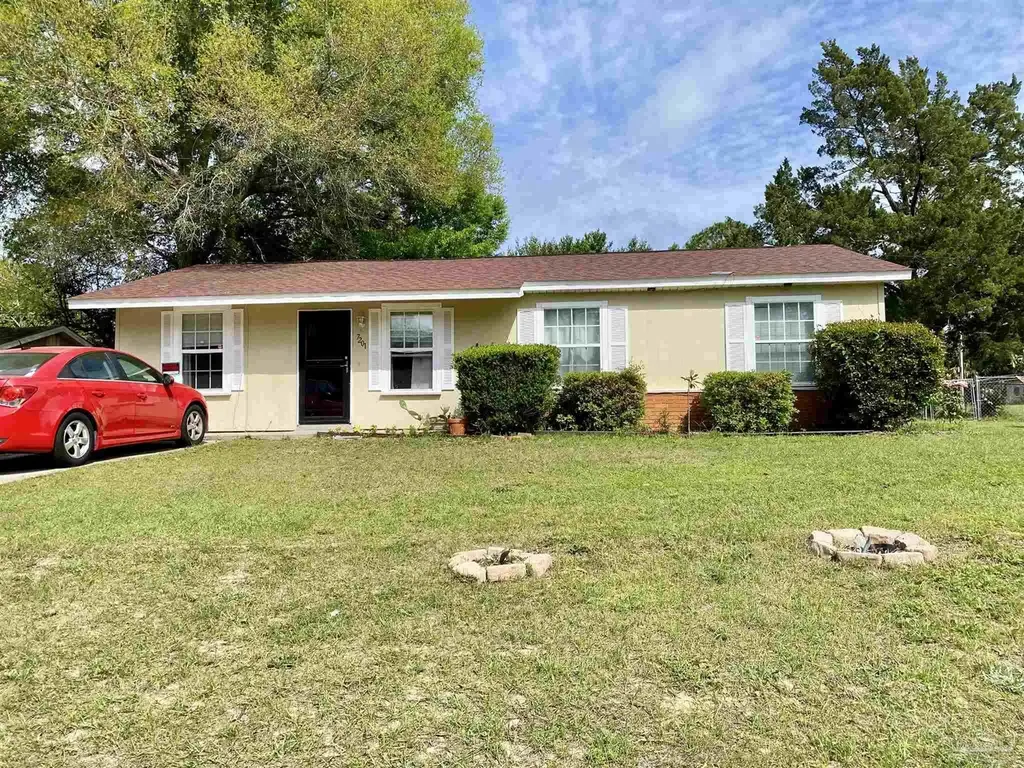
7201 Sachem Rd · Myrtle Grove, FL
Flood risk 1/10 · Minimal
- FEMA flood zone
- X (unshaded)
- Chance of flooding over 30 yrs
- 0.0%
- Est. flood insurance / yr
- $507 – $1,088
Fire risk 4/10 · Minor
- Est. fire insurance / yr
- $947 – $1,759
Heat risk 10/10 · Severe
- Hot days now (above 105°F)
- 7 days/yr
- Hot days in 30 yrs
- 22 days/yr
Wind risk 9/10 · Severe
- Chance of severe wind over 30 yrs
- 99.0%
Air-quality risk 1/10 · Minimal
- Unhealthy air days now
- 0 days/yr
- Unhealthy air days in 30 yrs
- 0 days/yr
Risk factors via First Street. Map © Google.
Why this score? — see what drove the C grade
The composite is a weighted blend of 9 inputs, each scored 0–100. Each bar is that input's sub-score; the figure is the points it added to the 100-point composite (weight × sub-score).
- Cash flow +20.2/30.0
- ARV discount +15.0/15.0
- DSCR +6.4/10.0
- 1% rule +4.3/10.0
- Schools +3.6/10.0
- Rent growth +3.5/5.0
- Livability +3.2/5.0
- Condition / age +2.5/5.0
- Appreciation +0.0/10.0
$162,000
🖨 Deal sheet 📄 Offer letter ✓ Due diligence
Listing remarks MLS
Spacious elevated corner lot, with a fully fenced back yard. This well maintained home has a 2019 roof and a new septic tank was installed that same year. HVAC needs to be replaced. Seller has estimates and is offering a $7000 allowance for this. Refrigerator, Washer & Dryer convey. Back yard features a metal yard building and old fashioned wooden swing.
Key facts
- Elevated corner lot
- Metal yard building
- New septic tank
Tags
Neighborhood map
What this means for you Summary
Snapshot
- This is a 3-bed/1.0-bath single-family listed at $162k.
Deal economics
- At list price, monthly cash flow is $205 ($2k/yr) — positive.
- The deal already cash-flows at list — no discount required.
- To meet the 1% rule (rent ≥ 1% of price), the offer needs to be $150k (7.1% below list).
- Recommended offer: $150k (7.1% below list) — sets the bar for 1% rule.
- Cap rate 7.8% vs local median 5.1% in Myrtle Grove — top-decile yield for the area; either an underpriced asset or a hidden risk that comps aren't pricing in. Stress-test before assuming the spread holds.
Location & tenants
- Location reads 64/100 on livability (#701 in FL) — a middle-class / working-renter tenant base. Strengths: cost of living A+, housing A+, health & safety B+; Watch: schools D-, amenities F, commute F.
- Escambia (suburban): math 40% / reading 45% proficiency, ranked #56 of 73 in FL (top 77%) — families likely to look elsewhere, expect single-tenant / working-renter base with shorter leases.
- Market conditions: Rents rising (+3.9%/yr); 270 active listings in the ZIP; 9 comparable units currently listed for rent nearby; rentals at typical pace (median 24d on market — plan ~3-4 weeks tenant-placement turnaround); 1,479 units permitted in Escambia County in 2024 (0 in 5+ unit buildings).
Forward outlook
- Local home prices are declining (-3.0%/yr); year-one equity from $1k of loan paydown is wiped out by about $5k of value loss. Plan a longer hold.
- Escambia County population projected at +13% by 2050 — modest demand growth; plan on rents tracking national, not racing it.
Negotiation context
- It's been on market 73 days — a 6% lower offer ($152k) is reasonable based on typical stale-listing flexibility.
- 4 sale attempts since 19y ago with the ask held roughly flat each time — persistent listings suggest the price (not the market) is what's stuck; bring a comps-based counter.
- Current owner paid $100k; list at $162k implies a 62% gain — meaningful room to come down on a strong offer.
Risks & watch-outs
- Climate carrying-cost: severe wind risk, 99% chance of damaging wind over 30y; extreme-heat days projected 7→22/yr by 2055 (HVAC capex compounding) — expect insurance premiums to compound above CPI over the hold.
Questions for the listing agent
- It's been on market 73 days. Have you received any prior offers? Is the seller open to a 7% concession, seller financing, or rate buy-down credit?
- Built in 1961 — when were the roof, HVAC, electrical panel, plumbing, and water heater last replaced?
- Why hasn't it sold? Are there any deal-killer items the seller is aware of (foundation, flood, title, zoning, code violations)?
- Is there a deadline driving the sale (1031 exchange, divorce, estate, relocation)? That informs how much negotiation room exists.
- Schools are D-rated, which usually means shorter tenancies and higher turnover. Who's the typical renter profile here, and what's been the actual vacancy rate?
- What's the average days-on-market for RENTAL listings here right now (not sales)? A rising rental-DOM trend means longer vacancies and softer asking-rent achievability than the comps imply.
- What's the recent tenant-quality profile in this submarket — average credit score on applications, eviction rate, late-payment / NSF rate, and stable-employment percentage? A property-management company in the area should have these aggregated.
- How much new for-sale + rental construction is in the pipeline within 1–3 miles? Heavy new supply typically softens prices + rents 12–24 months out; constrained supply supports both.
Investment metrics
- 1% rule
- 0.93% ✗
- Cap rate
- 7.81%
- Cash-on-cash
- 5.43%
- DSCR
- 1.24
- GRM
- 9.0
CMA / ARV
- ARV (median comp)
- $232,870
- List price
- $162,000
- Delta
- -30.43%
- Verdict
- UNDERPRICED
- Comps
- 20 within 1.0 mi
Show comp detail 12 sales within ~0.75 mi
| Address | Dist | Beds/Ba | Sqft | Sold | Price | $/sf | Match |
|---|---|---|---|---|---|---|---|
| 7330 Sachem Rd | 0.14mi | 3/1.0 | 1,200 (+3%) | 10mo | $151,000 | $126 | 81 |
| 7051 Heather Oaks Dr | 0.32mi | 3/2.0 | 1,170 (0%) | 4mo | $160,000 | $137 | 78 |
| 7150 Heather Oaks Dr | 0.26mi | 3/2.0 | 1,152 (-2%) | 5mo | $182,680 | $159 | 77 |
| 7704 W Gadsden St | 0.45mi | 3/1.0 | 1,152 (-2%) | 1mo | $149,000 | $129 | 76 |
| 7151 Heather Oaks Dr | 0.25mi | 3/2.0 | 1,191 (+2%) | 10mo | $177,000 | $149 | 73 |
| 7060 Heather Oaks Dr | 0.32mi | 3/2.0 | 1,248 (+7%) | 1mo | $200,000 | $160 | 69 |
| 720 N 79th Ave | 0.35mi | 3/1.0 | 1,104 (-6%) | 8mo | $105,000 | $95 | 67 |
| 7100 Heather Oaks Dr | 0.29mi | 3/2.0 | 1,230 (+5%) | 8mo | $170,000 | $138 | 67 |
| 7823 Montego Dr | 0.29mi | 3/2.0 | 1,062 (-9%) | 8mo | $180,000 | $169 | 60 |
| 7032 Weatherwood Dr | 0.28mi | 2/2.0 (-1) | 1,044 (-11%) | 4mo | $199,000 | $191 | 56 |
| 7879 Galaxy Ct | 0.46mi | 3/2.0 | 1,325 (+13%) | 2mo | $185,000 | $140 | 51 |
| 607 N 69th Ave | 0.62mi | 3/1.0 | 1,310 (+12%) | 5mo | $247,500 | $189 | 47 |
Match score weights: distance 35% · size 25% · config 20% · recency 20%. Top-matched comps best support the ARV.
Projected returns pro-forma
-3.0% appreciation · 3.85% rent growth · sell at horizon
- IRR
- -7.1%
- Equity multiple
- 0.74×
- Total profit
- $-11,949
- Equity at exit
- $24,155
- IRR
- 3.4%
- Equity multiple
- 1.26×
- Total profit
- $11,589
- Equity at exit
- $14,007
Cash invested: $45,360 (down + closing). Projections, not guarantees.
Landlord ↔ Tenant lean methodology
- Overall (STATE)
- 87 Strongly Landlord-Friendly
- State Florida
- 87 Strongly Landlord-Friendly · R+3
- County
- — inherits STATE
- City
- — inherits STATE
ZIP-level market 32506
- Home prices YoY
- -22.5%
- Rents YoY
- 3.9%
- Active inventory
- 270
- Price-to-rent
- 9.0×
Monthly cashflow live
- Estimated rent
- $1,505 high interval (Pro) →
- Mortgage (P&I)
- −$850
- Tax from tax record
- −$67 /mo · $800/yr
- Insurance
- −$68
- HOA
- −$0
- Vacancy / Maint / Mgmt
- −$316
- Net cashflow
- $205
Break-even live
UW: 25.0% down · 7.5% · 30yr · 1.5% tax · 5.0% vac · 8.0% maint · 8.0% mgmt
Financing live
Cash to close
- Down payment
- $40,500
- Closing costs
- $4,860
- Reserves months
- —
- Total cash needed
- —
Loan-product check · same deal, 3 products live
Conventional
25% down · 7.5% · 30yr
- Down + closing
- —
- Monthly P&I
- —
- Monthly cashflow
- —
- DSCR
- —
- Eligible?
- —
Personal DTI + credit; lowest rate.
DSCR
20% down · 8.5% · 30yr
- Down + closing
- —
- Monthly P&I
- —
- Monthly cashflow
- —
- DSCR
- —
- Eligible?
- —
No personal income docs; deal must DSCR.
Hard money
10% down · 12.0% · 12mo
- Down + closing
- —
- Monthly P&I
- —
- Monthly cashflow
- —
- DSCR
- —
- Eligible?
- —
Short-term bridge; refi at stabilization.
Rent comps 9 comps
| Address | Beds | Baths | Sqft | Rent | $/sqft | DOM | Units | Dist |
|---|---|---|---|---|---|---|---|---|
| 7200 Lillian Hwy Pensacola, FL | 2.0 | 1.0 | 675 | $1,200 | $1.78 | 13d | 11 | 0.36mi |
| 8240 Tempest Dr Pensacola, FL | 2.0 | 2.0 | 1300 | $1,600 | $1.23 | 21d | 1 | 0.52mi |
| 8121 Lillian Hwy #70 Pensacola, FL | 2.0 | 2.0 | 900 | $1,100 | $1.22 | 23d | 1 | 0.60mi |
| 7135 Pearson Rd Unit 7 Pensacola, FL | 2.0 | 2.0 | 902 | $1,125 | $1.25 | 23d | 1 | 1.09mi |
| 7318 Hayward Ave Unit P30 P30 Pensacola, FL | 2.0 | 2.0 | 1000 | $1,200 | $1.20 | 23d | 1 | 1.29mi |
| 150 S Crow Rd Pensacola, FL | 2.0 | 2.5 | 1088 | $1,450 | $1.33 | 23d | 1 | 1.30mi |
| 3219 Fresno Ave Pensacola, FL | 3.0 | 2.0 | 1192 | $1,375 | $1.15 | 23d | 1 | 1.32mi |
| 3230 Palmdale Ave Pensacola, FL | 3.0 | 2.0 | 1300 | $1,500 | $1.15 | 23d | 1 | 1.46mi |
| 8 Villa Dr Pensacola, FL | 2.0 | 2.0 | 1000 | $1,362 | $1.36 | 21d | 6 | 1.46mi |
Listing history 27 events
-
2026-06-18days on market $162,000 Active 73 DOM
-
2026-06-17days on market $162,000 Active 72 DOM
-
2026-06-16days on market $162,000 Active 71 DOM
-
2026-06-15days on market $162,000 Active 70 DOM
-
2026-06-14remarks 359-char remark
-
2026-06-14statusdays on market $162,000 Active 68 DOM
-
2026-06-10days on market $162,000 Contingent 65 DOM
-
2026-06-09days on market $162,000 Contingent 64 DOM
-
2026-06-08days on market $162,000 Contingent 63 DOM
-
2026-06-07days on market $162,000 Contingent 62 DOM
-
2026-06-03days on market $162,000 Contingent 58 DOM
-
2026-06-02days on market $162,000 Contingent 57 DOM
-
2026-06-01days on market $162,000 Contingent 56 DOM
-
2026-05-31days on market $162,000 Contingent 55 DOM
-
2026-05-31statusdays on market $162,000 Contingent 54 DOM
-
2026-05-14price $162,000 360-char remark
Show marketing remark (360 chars)
Spacious elevated corner lot, with a fully fenced back yard. This well maintained home has a 2019 roof and a new septic tank was installed that same year. HVAC needs to be replaced. Seller has estimates and is offering a $7000 allowance for this. Refrigerator, Washer & Dryer convey. Back yard features a metal yard building and old fashioned wooden swing.
-
2026-04-06$167,500 Active 360-char remark
Show marketing remark (360 chars)
Spacious elevated corner lot, with a fully fenced back yard. This well maintained home has a 2019 roof and a new septic tank was installed that same year. HVAC needs to be replaced. Seller has estimates and is offering a $7000 allowance for this. Refrigerator, Washer & Dryer convey. Back yard features a metal yard building and old fashioned wooden swing.
-
2020-10-19soldstatus $100,000
-
2020-10-15soldstatus $100,000 226-char remark
Show marketing remark (226 chars)
Move in ready at a price that you can afford. This 3/1 ranch style house sits on a corner lot with a large yard. Brand new roof, electrical has been updated and the flooring is all new. This house just needs your furniture.
-
2020-07-06$100,000 226-char remark
Show marketing remark (226 chars)
Move in ready at a price that you can afford. This 3/1 ranch style house sits on a corner lot with a large yard. Brand new roof, electrical has been updated and the flooring is all new. This house just needs your furniture.
-
2008-12-25historical
-
2008-06-25$79,900
-
2007-12-10soldstatus $54,456
-
2007-10-10$53,900
-
2005-09-22soldstatus $90,200
-
1980-01-01soldstatus $27,100
-
1974-01-01soldstatus $16,000
ⓘ Source: listings_history table (triggers on properties + properties_extension) + one-shot
backfill from property_details.listing_events for pre-trigger history.
Tax reassessment forecast FL · Resets to sale price
- Current annual tax
- $800 · $67/mo
- Projected year-2 tax
- $1,345 · $112/mo
- Expected delta
- +$545/yr (+$45/mo · 68.2%)
ⓘ Screening estimate from a state-policy table — verify with the county assessor before closing.
Climate risk First Street
- Flood 1/10 Low FEMA zone X (unshaded) · 0% chance over 30 yrs
- Wildfire 4/10 Moderate
- Heat 10/10 Extreme 7 d/yr ≥105°F today · 22 d/yr by 30 yrs out
- Wind 9/10 Extreme 99% chance of damaging wind over 30 yrs
- Air quality 1/10 Low 0 unhealthy d/yr today · 0 by 30 yrs out
Nearby sold comps map
Loading sold comps map…
Walkable amenities ~0.75 mi
Loading nearby amenities…
Taxation est. · year 1
- Rental income
- $18,058
- − Mortgage interest
- −$9,075
- − Property taxes
- −$800
- − Insurance
- −$810
- − Repairs & maintenance
- −$1,445
- − Management
- −$1,445
- − Depreciation
- −$4,713
- Taxable loss
- −$228
- Est. tax savings @ 24.0%
- +$55
- After-tax cash flow
- $2,516/yr
For passive investors: Depreciation is non-cash, so a rental often shows a tax loss while cash-flowing — sheltering income. Rental losses are passive: they offset passive income freely, and up to $25,000/yr can offset ordinary (W-2) income if you actively participate and your MAGI is under $100k (phasing out to $0 by $150k); unused losses carry forward. On sale, claimed depreciation is recaptured at up to 25%, and gains may owe capital-gains tax (a 1031 exchange can defer both). Figures are a year-1 estimate at your 24.0% rate — not tax advice; consult a CPA.
Schools (NCES district)
- District
- Escambia
- NCES district ID
- 1200510
- Math proficiency
- 40% ▼ -9.00%
- Reading proficiency
- 45% ▼ -4.00%
- Median HH income
- $44,649
- Composite
- 36.04/100
- National rank
- #4773
- State rank
- #56 of 73 in FL
Livability — Myrtle Grove
- Score
- 64/100
- State rank
- #701
- US rank
- #14805
Category grades
Schools grade is shown separately in the Schools card above.
Census & demographics
- Census place
- Myrtle Grove, FL
- County
- Escambia County · 301,722 people
- City population
- 1,170
- Metro
- Pensacola-Ferry Pass-Brent, FL
- Population (ZIP)
- 34,549
- Household income
- $62,486
- Rent vs Own
- Severe rent burden
- 1359.0
Population outlook (Escambia County) Hauer SSP2
- Today (2025)
- 334,637 people
- By 2030
- 345,779 · +3.3%
- By 2040
- 364,828 · +9.0%
- By 2050
- 378,514 · +13.1%
- By 2075
- 403,220 · +20.5%
- By 2100
- 386,125 · +15.4%
Race, ethnicity, and origin ACS 2023
- Neighborhood character
- Diverse neighborhood (Simpson 0.60)
- Race & ethnicity
- White 60% Black 18% Two or more races 11% Hispanic / Latino 6% Asian 6%
- Hispanic origin (detail)
- Mexican 3%
- Common ancestry
- Lithuanian 4% Slovak 2% Italian 2%
- Foreign-born
- 9% · Canada, China, Vietnam
- Languages at home
- 89% English-only · Spanish 4% Tagalog/Filipino 2% Other Indo-European 1%
Political lean MEDSL · Escambia
- 2024 margin
- R (+19.5) · D 39.7% · R 59.2% · Other 1.1%
- 2008→2024 swing
- -0.2pp no change · 2008: -19.3pp · 2024: -19.5pp
- All cycles
- 2024: R+19.5 2020: R+15.1 2016: R+20.6 2012: R+20.6 2008: R+19.3
Not yet ingested
- Civics
- —
Market trends
- HPI YoY
- ▼ -71.86%
- Current HPI
- 247.6085
- Rent YoY
- ▲ 3.85%
- Metro
- Pensacola-Ferry Pass-Brent, FL
- State GDP YoY
- ▲ 3.28%
- F500 in state
- 36
Industry mix (Fortune 500 HQ in FL)
| Industry | F500 HQs | Revenue |
|---|---|---|
| Industrial Technology | 2 | $29B |
|
||
| Insurance | 2 | $17B |
|
||
| Retail | 1 | $60B |
|
||
| Technology Distribution | 1 | $58B |
|
||
| Homebuilding | 1 | $35B |
|
||
| Technology Manufacturing | 1 | $35B |
|
||
Price history
+912.5% since first listed12 events — show timeline
- 2026-05-14 Price Changed $162,000 PARMLS
- 2026-04-06 Listed $167,500 PARMLS
- 2020-10-19 Sold (Public Records) $100,000 Public Records
- 2020-10-15 Sold (MLS) $100,000 PARMLS
- 2020-07-06 Listed $100,000 PARMLS
- 2008-12-25 Listing Removed — PARMLS
- 2008-06-25 Listed $79,900 PARMLS
- 2007-12-10 Sold (MLS) $54,456 PARMLS
- 2007-10-10 Listed $53,900 PARMLS
- 2005-09-22 Sold (Public Records) $90,200 Public Records
- 1980-01-01 Sold (Public Records) $27,100 Public Records
- 1974-01-01 Sold (Public Records) $16,000 Public Records
Property tax history
+0.4%/yrLatest (2025): $800 · +23.9% YoY. Source: county tax records.
Cash-flow waterfall
monthlySold comps — $/sqft
last 12 mo · ≤1 miLoading sold comps…