4072 Twinleaf Dr · Fort Worth, TX
Flood risk No data
- FEMA flood zone
- —
- Chance of flooding over 30 yrs
- —
- Est. flood insurance / yr
- —
Fire risk No data
- Est. fire insurance / yr
- —
Heat risk No data
- Hot days now (above threshold)
- —
- Hot days in 30 yrs
- —
Wind risk No data
- Chance of severe wind over 30 yrs
- —
Air-quality risk No data
- Unhealthy air days now
- —
- Unhealthy air days in 30 yrs
- —
Risk factors via First Street. Map © Google.
Why this score? — see what drove the D grade
The composite is a weighted blend of 9 inputs, each scored 0–100. Each bar is that input's sub-score; the figure is the points it added to the 100-point composite (weight × sub-score).
- Cash flow +16.3/30.0
- ARV discount +7.5/15.0
- DSCR +5.1/10.0
- Livability +4.0/5.0
- 1% rule +3.5/10.0
- Rent growth +3.1/5.0
- Schools +2.5/10.0
- Condition / age +1.0/5.0
- Appreciation +0.0/10.0
$280,769
🖨 Deal sheet (PDF) 📄 Offer letter ✓ Due diligence
Listing remarks MLS
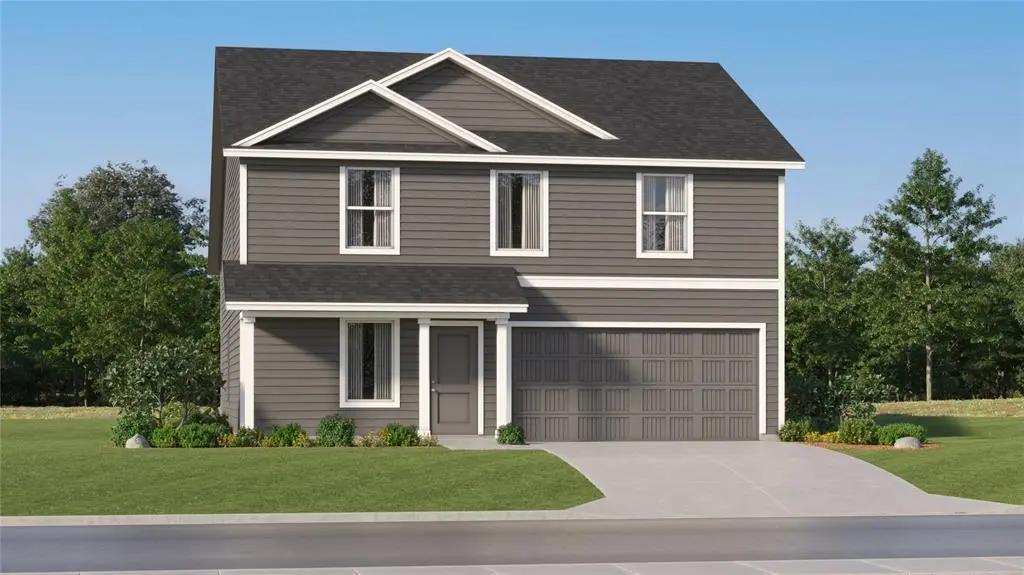
On the first floor of this spacious two-story home is a convenient and modern layout seamlessly connecting the kitchen, dining room and family room together. In a private corner is the tranquil owner's suite with an attached bathroom and walk-in closet. Upstairs is a sprawling central game room made for gatherings of all sizes, along with three secondary bedrooms to provide sleeping accommodations to family members and guests.
Key facts
- Walk-in closet
- Open floorplan
- Secondary bedrooms
Tags
Property features AI
Finance
- Other: Builder special listing condition; Possession at closing/funding
- Financial info: Acceptable financing: Cash, Conventional, FHA, USDA, VA
- HOA & community: Mandatory homeowners association; Quarterly HOA fee; HOA covers grounds maintenance and management fees; HOA managed by Goodwin and Company
Exterior
- Parking: Attached 2-car garage; Covered parking with 2 covered spaces; 2-car single door configuration
- Utilities: City water; City sewer; Concrete, curbs, and sidewalks; Located in a Municipal Utility District; Energy-efficient features including attic insulation (12"+), energy-efficient appliances, upgraded doors, and low-flow commodes
- Home design: Single family residence; Residential property; Two-story; New construction (incomplete) — year built 2025
- Construction: Siding exterior; Composition roof; Slab foundation
- Exterior features: Wood fencing; Interior lot
Interior
- Kitchen: Dishwasher; Disposal; Gas range; Microwave; Breakfast bar; Built-in cabinets; Kitchen island; Natural stone/granite countertops; Pantry
- Bedrooms: 4 bedrooms (primary bedroom on level 1; three bedrooms on level 2)
- Flooring: Carpet; Ceramic tile
- Bathrooms: 2 full bathrooms
- Heating & cooling: Central heating (electric and natural gas); Central air conditioning (electric); ENERGY STAR qualified equipment
- Interior features: Cable TV available; 8 total rooms; Two levels
- Laundry & utility: Appliances included (see kitchen and laundry sections)
Neighborhood map
What this means for you Summary
Snapshot
- This is a 4-bed/2.0-bath other listed at $281k. Condition is rated poor.
Deal economics
- At list price, monthly cash flow is $156 ($2k/yr) — positive.
- The deal already cash-flows at list — no discount required.
- To meet the 1% rule (rent ≥ 1% of price), the offer needs to be $239k (15.0% below list).
- Recommended offer: $239k (15.0% below list) — sets the bar for 1% rule.
- Cap rate 7.0% vs local median 3.9% in Fort Worth — top-decile yield for the area; either an underpriced asset or a hidden risk that comps aren't pricing in. Stress-test before assuming the spread holds.
Location & tenants
- Location reads 80/100 on livability (#49 in TX, #1,954 nationally) — a professional / high-income tenant draw. Strengths: amenities A+, cost of living A+, housing A+; Watch: crime F.
- Crowley ISD (urban): math 23% / reading 32% proficiency, ranked #643 of 826 in TX (top 78%) — low school quality limits family demand, transient renter base, plan for 1-2y turnover.
- Zoned schools: Sidney H Poynter (math 12% / reading 27%, grade F, #3,583 of 4,322 statewide, top 86%, 422 students, 81% FRL); H F Stevens Middle (math 16% / reading 26%, grade F, #1,387 of 1,662 statewide, top 85%, 747 students, 84% FRL); Crowley H S (math 23% / reading 36%, grade F, #1,112 of 1,632 statewide, top 70%, 2,351 students, 72% FRL) — zoned schools average 79% FRL vs 52% district-wide (27 pts higher); higher-poverty schools than district average — tighter screening recommended.
- Market conditions: Rents rising (+2.3%/yr); 1036 active listings in the ZIP; 40 comparable units currently listed for rent nearby; rentals at typical pace (median 26d on market — plan ~3-4 weeks tenant-placement turnaround); 42% of comp listings sitting > 30 days — soft ceiling on asking rent; solid renter incomes; 18,938 units permitted in Tarrant County in 2024 (8,336 in 5+ unit buildings).
Forward outlook
- Local home prices are declining (-3.0%/yr); year-one equity from $2k of loan paydown is wiped out by about $8k of value loss. Plan a longer hold.
- Tarrant County population projected at +41% by 2050 — long-run rental-demand tailwind backs the buy-and-hold thesis.
Negotiation context
- It's been on market 19 days — a 2% lower offer ($277k) is reasonable based on typical stale-listing flexibility.
- 3 sale attempts with the ask held roughly flat each time — persistent listings suggest the price (not the market) is what's stuck; bring a comps-based counter.
Questions for the listing agent
- Have any recent inspections been done? Can we get a copy of the seller's disclosures and any deferred-maintenance estimates?
- What does the HOA fee cover, when was the last increase, and are there any pending special assessments or reserve-fund shortfalls?
- Is there a deadline driving the sale (1031 exchange, divorce, estate, relocation)? That informs how much negotiation room exists.
- Schools are D-rated, which usually means shorter tenancies and higher turnover. Who's the typical renter profile here, and what's been the actual vacancy rate?
- Crime grade is F in this area — have there been break-ins, vandalism, or insurance claims at this property in the last 3 years? What carrier currently insures it and at what premium?
- The area grade is low — what's the realistic commute time and amenity access for the typical tenant pool here? Any planned neighborhood developments (good or bad) we should know about?
- What's the average days-on-market for RENTAL listings here right now (not sales)? A rising rental-DOM trend means longer vacancies and softer asking-rent achievability than the comps imply.
- What's the recent tenant-quality profile in this submarket — average credit score on applications, eviction rate, late-payment / NSF rate, and stable-employment percentage? A property-management company in the area should have these aggregated.
- How much new for-sale + rental construction is in the pipeline within 1–3 miles? Heavy new supply typically softens prices + rents 12–24 months out; constrained supply supports both.
Investment metrics
- 1% rule
- 0.85% ✗
- Cap rate
- 6.96%
- Cash-on-cash
- 2.37%
- DSCR
- 1.11
- GRM
- 9.8
CMA / ARV
No comps found within radius.
Projected returns pro-forma
-3.0% appreciation · 2.28% rent growth · sell at horizon
- IRR
- -13.3%
- Equity multiple
- 0.52×
- Total profit
- $-37,401
- Equity at exit
- $41,864
- IRR
- -5.5%
- Equity multiple
- 0.65×
- Total profit
- $-27,135
- Equity at exit
- $24,276
Cash invested: $78,615 (down + closing). Projections, not guarantees.
Landlord ↔ Tenant lean methodology
- Overall (STATE)
- 87 Strongly Landlord-Friendly
- State Texas
- 87 Strongly Landlord-Friendly · R+5
- County
- — inherits STATE
- City
- — inherits STATE
ZIP-level market 76036
- Home prices YoY
- -25.2%
- Rents YoY
- 2.3%
- Active inventory
- 1036
- Price-to-rent
- 9.8×
Monthly cashflow live
- Estimated rent
- $2,386 high interval (Pro) →
- Mortgage (P&I)
- −$1,472
- Tax from tax record
- −$110 /mo · $1,321/yr
- Insurance
- −$117
- HOA
- −$30
- Vacancy / Maint / Mgmt
- −$501
- Net cashflow
- $156
Break-even live
Sensitivity live
| Price | -10% $314 | -5% $235 | +0% $156 | +5% $76 | +10% $-3 |
|---|---|---|---|---|---|
| Rent | -10% $-33 | -5% $61 | +0% $156 | +5% $250 | +10% $344 |
| Rate | -1.0pp $297 | -0.5pp $227 | base $156 | +0.5pp $83 | +1.0pp $9 |
UW: 25.0% down · 7.5% · 30yr · 1.5% tax · 5.0% vac · 8.0% maint · 8.0% mgmt
Financing live
Cash to close
- Down payment
- $70,192
- Closing costs
- $8,423
- Reserves months
- —
- Total cash needed
- —
Loan-product check · same deal, 3 products live
Conventional
25% down · 7.5% · 30yr
- Down + closing
- —
- Monthly P&I
- —
- Monthly cashflow
- —
- DSCR
- —
- Eligible?
- —
Personal DTI + credit; lowest rate.
DSCR
20% down · 8.5% · 30yr
- Down + closing
- —
- Monthly P&I
- —
- Monthly cashflow
- —
- DSCR
- —
- Eligible?
- —
No personal income docs; deal must DSCR.
Hard money
10% down · 12.0% · 12mo
- Down + closing
- —
- Monthly P&I
- —
- Monthly cashflow
- —
- DSCR
- —
- Eligible?
- —
Short-term bridge; refi at stabilization.
Rent comps 40 comps
| Address | Beds | Baths | Sqft | Rent | $/sqft | DOM | Units | Dist |
|---|---|---|---|---|---|---|---|---|
| 4004 Arklow St Crowley, TX | 4.0 | 2.0 | 1668 | $2,200 | $1.32 | 26d | 1 | 0.15mi |
| 4004 Arklow St Crowley, TX | 4.0 | 2.0 | 1668 | $2,200 | $1.32 | 7d | 1 | 0.15mi |
| 4013 Drifters Bend Dr Crowley, TX | 4.0 | 2.0 | 1667 | $2,200 | $1.32 | 45d | 1 | 0.19mi |
| 4156 Summersweet Ln Crowley, TX | 3.0 | 2.0 | 1307 | $1,900 | $1.45 | 45d | 1 | 0.20mi |
| 4224 Old Timber Ln Crowley, TX | 3.0 | 2.0 | 2092 | $2,250 | $1.08 | 45d | 1 | 0.21mi |
| 4201 Summersweet Ln Crowley, TX | 3.0 | 2.0 | 1398 | $1,960 | $1.40 | 14d | 1 | 0.22mi |
| 4216 Summersweet Ln Crowley, TX | 3.0 | 2.0 | 1636 | $2,129 | $1.30 | 0d | 1 | 0.25mi |
| 4052 Dublin Ridge Dr Crowley, TX | 3.0 | 2.0 | 1464 | $1,895 | $1.29 | 23d | 1 | 0.35mi |
| 4213 Dublin Ridge Dr Crowley, TX | 3.0 | 2.0 | 1553 | $2,050 | $1.32 | 4d | 1 | 0.40mi |
| 4148 Crooked Bend Dr Crowley, TX | 3.0 | 2.0 | 1469 | $2,100 | $1.43 | 26d | 1 | 0.50mi |
| 4148 Crooked Bend Dr Crowley, TX | 3.0 | 2.0 | 1450 | $2,100 | $1.45 | 14d | 1 | 0.50mi |
| 1013 Verde Valley Ln Crowley, TX | 4.0 | 2.5 | 2225 | $2,400 | $1.08 | 26d | 1 | 0.61mi |
| 1032 Verde Valley Ln Crowley, TX | 3.0 | 2.5 | 2145 | $2,400 | $1.12 | 20d | 1 | 0.61mi |
| 4444 Sagecroft Rd Crowley, TX | 3.0 | 2.0 | 1534 | $2,050 | $1.34 | 45d | 1 | 0.64mi |
| 4505 Greyberry Dr Crowley, TX | 3.0 | 2.0 | 1429 | $2,100 | $1.47 | 20d | 1 | 0.73mi |
| 4533 Greenham Ln Crowley, TX | 3.0 | 2.0 | 1531 | $1,995 | $1.30 | 45d | 1 | 0.73mi |
| 10121 Wyseby Rd Crowley, TX | 3.0 | 2.0 | 1622 | $1,995 | $1.23 | 45d | 1 | 0.74mi |
| 4365 Mill Stream Ln Crowley, TX | 4.0 | 2.0 | 1602 | $2,300 | $1.44 | 26d | 1 | 0.75mi |
| 405 Bryan Dr Crowley, TX | 3.0 | 2.0 | 1343 | $1,795 | $1.34 | 26d | 1 | 0.80mi |
| 9505 Cypress Lake Dr Crowley, TX | 3.0 | 2.0 | 2028 | $2,670 | $1.32 | 26d | 1 | 0.81mi |
| 9512 Carson Ranch Rd Crowley, TX | 4.0 | 2.0 | 1782 | $2,995 | $1.68 | 23d | 1 | 0.81mi |
| 316 Quail Creek Dr Crowley, TX | 3.0 | 2.0 | 1317 | $1,683 | $1.28 | 14d | 1 | 0.91mi |
| 4633 Benham Dr Crowley, TX | 4.0 | 2.0 | 1740 | $2,000 | $1.15 | 6d | 1 | 0.93mi |
| 4633 Benham Dr Crowley, TX | 3.0 | 2.0 | 1740 | $2,000 | $1.15 | 45d | 1 | 0.93mi |
| 4644 Benham Dr Crowley, TX | 3.0 | 2.0 | 1422 | $1,995 | $1.40 | 45d | 1 | 0.95mi |
| 4413 Corner Brook Ln Fort Worth, TX | 4.0 | 2.0 | 1983 | $2,165 | $1.09 | 22d | 1 | 0.98mi |
| 9717 Snowbell Ln Crowley, TX | 4.0 | 2.0 | 1928 | $2,195 | $1.14 | 23d | 1 | 0.99mi |
| 3832 German Pointer Way Fort Worth, TX | 4.0 | 2.5 | 2532 | $3,299 | $1.30 | 7d | 1 | 0.99mi |
| 10432 Fort Bird Trl Crowley, TX | 4.0 | 2.0 | 2100 | $3,000 | $1.43 | 45d | 1 | 0.99mi |
| 109 N Heights Dr Crowley, TX | 3.0 | 2.0 | 1284 | $1,945 | $1.51 | 26d | 1 | 1.02mi |
| 9233 Cheswick Dr Fort Worth, TX | 4.0 | 3.0 | 2250 | $3,060 | $1.36 | 45d | 1 | 1.02mi |
| 3833 Foxhound Ln Fort Worth, TX | 3.0 | 2.0 | 1507 | $1,895 | $1.26 | 20d | 1 | 1.06mi |
| 4725 Sassafras Dr Crowley, TX | 4.0 | 2.0 | 2067 | $2,899 | $1.40 | 45d | 1 | 1.08mi |
| 9925 Ryegrass Ter Crowley, TX | 3.0 | 2.0 | 1487 | $2,350 | $1.58 | 45d | 1 | 1.11mi |
| 10381 Fort Ewell Trl Crowley, TX | 3.0 | 2.0 | 1494 | $2,149 | $1.44 | 45d | 1 | 1.12mi |
| 3416 Saint Vincent Rd Fort Worth, TX | 3.0 | 3.0 | 2033 | $1,895 | $0.93 | 45d | 1 | 1.13mi |
| 3408 Saint Vincent Rd Fort Worth, TX | 3.0 | 2.0 | 1400 | $2,195 | $1.57 | 45d | 1 | 1.14mi |
| 3469 Cayman Dr Fort Worth, TX | 3.0 | 2.0 | 1368 | $1,749 | $1.28 | 45d | 1 | 1.14mi |
| 10373 Fort Belknap Trl Crowley, TX | 4.0 | 2.0 | 1780 | $2,160 | $1.21 | 45d | 1 | 1.15mi |
| 221 Arnold St Crowley, TX | 3.0 | 2.0 | 1266 | $1,695 | $1.34 | 7d | 1 | 1.15mi |
HOA detail
- Monthly dues
- $30 · $360/yr
Listing history 13 events
-
2026-06-21days on market $280,769 Active 19 DOM
-
2026-06-18days on market $280,769 Active 16 DOM
-
2026-06-17days on market $280,769 Active 15 DOM
-
2026-06-16days on market $280,769 Active 14 DOM
-
2026-06-15days on market $280,769 Active 13 DOM
-
2026-06-13days on market $280,769 Active 11 DOM
-
2026-06-13days on market $280,769 Active 10 DOM
-
2026-06-09days on market $280,769 Active 7 DOM
-
2026-06-08days on market $280,769 Active 6 DOM
-
2026-06-07days on market $280,769 Active 5 DOM
-
2026-06-04days on market $280,769 Active 2 DOM
-
2026-06-02remarks 388-char remark
Show marketing remark (430 chars)
On the first floor of this spacious two-story home is a convenient and modern layout seamlessly connecting the kitchen, dining room and family room together. In a private corner is the tranquil owner's suite with an attached bathroom and walk-in closet. Upstairs is a sprawling central game room made for gatherings of all sizes, along with three secondary bedrooms to provide sleeping accommodations to family members and guests.
-
2026-06-02$280,769 Active 1 DOM
Show marketing remark (430 chars)
On the first floor of this spacious two-story home is a convenient and modern layout seamlessly connecting the kitchen, dining room and family room together. In a private corner is the tranquil owner's suite with an attached bathroom and walk-in closet. Upstairs is a sprawling central game room made for gatherings of all sizes, along with three secondary bedrooms to provide sleeping accommodations to family members and guests.
ⓘ Source: listings_history table (triggers on properties + properties_extension) + one-shot
backfill from property_details.listing_events for pre-trigger history.
Tax reassessment forecast TX · Resets to sale price
- Current annual tax
- $1,321 · $110/mo
- Projected year-2 tax
- $5,138 · $428/mo
- Expected delta
- +$3,817/yr (+$318/mo · 289.1%)
ⓘ Screening estimate from a state-policy table — verify with the county assessor before closing.
Nearby sold comps map
Loading sold comps map…
Walkable amenities ~0.75 mi
Loading nearby amenities…
Taxation est. · year 1
- Rental income
- $28,632
- − Mortgage interest
- −$15,727
- − Property taxes
- −$1,321
- − Insurance
- −$1,404
- − Repairs & maintenance
- −$2,291
- − Management
- −$2,291
- − HOA
- −$360
- − Depreciation
- −$8,168
- Taxable loss
- −$2,929
- Est. tax savings @ 24.0%
- +$703
- After-tax cash flow
- $2,569/yr
For passive investors: Depreciation is non-cash, so a rental often shows a tax loss while cash-flowing — sheltering income. Rental losses are passive: they offset passive income freely, and up to $25,000/yr can offset ordinary (W-2) income if you actively participate and your MAGI is under $100k (phasing out to $0 by $150k); unused losses carry forward. On sale, claimed depreciation is recaptured at up to 25%, and gains may owe capital-gains tax (a 1031 exchange can defer both). Figures are a year-1 estimate at your 24.0% rate — not tax advice; consult a CPA.
Condition & rehab AI · 0 photos
This home requires extensive repairs and updates to bring it up to a livable condition. Significant investment is needed to address the poor condition of the kitchen, bathrooms, flooring, and exterior, as well as the HVAC system. Once renovated, it could be a valuable property for both resale and rental markets.
Repairs flagged
- Major Kitchen countertops — Severe wear and tear, likely requiring replacement.
- Major Bathroom fixtures — Outdated and potentially in need of replacement.
- Major Flooring — Worn and in need of replacement.
- Major Paint — Peeling and discoloration, indicating a need for repainting.
- Major Roof — Visible signs of wear, likely requiring inspection and repair.
- Major Exterior siding — Peeling and in poor condition, indicating a need for repainting or replacement.
- Major Windows — Old and may need replacement or repair.
- Major Foundation — Signs of settling or damage, requiring professional inspection and repair.
- Major HVAC system — Outdated and likely in need of replacement or repair.
Value-add opportunities
- Resale Kitchen renovation — A new kitchen will attract buyers and increase the home's value.
- Resale Bathroom updates — Modern bathrooms will appeal to potential buyers and increase the home's value.
- Resale Flooring replacement — New flooring will improve the home's appearance and increase its value.
- Resale Painting and exterior repairs — Fresh paint and repairs will enhance the home's curb appeal and increase its value.
- Both HVAC system replacement — A new HVAC system will improve energy efficiency and comfort, benefiting both resale and rental value.
Renovation cost estimate screening
| Repair item | Severity | Est. cost |
|---|---|---|
| Kitchen countertops · Severe wear and tear, likely requiring replacement. | Major | $15,000–50,000 |
| Bathroom fixtures · Outdated and potentially in need of replacement. | Major | $15,000–50,000 |
| Flooring · Worn and in need of replacement. | Major | $15,000–50,000 |
| Paint · Peeling and discoloration, indicating a need for repainting. | Major | $15,000–50,000 |
| Roof · Visible signs of wear, likely requiring inspection and repair. | Major | $15,000–50,000 |
| Exterior siding · Peeling and in poor condition, indicating a need for repainting or replacement. | Major | $15,000–50,000 |
| Windows · Old and may need replacement or repair. | Major | $15,000–50,000 |
| Foundation · Signs of settling or damage, requiring professional inspection and repair. | Major | $15,000–50,000 |
| HVAC system · Outdated and likely in need of replacement or repair. | Major | $15,000–50,000 |
| Total estimated repair cost · 9 items | $135,000–450,000 |
Value-add ROI direction
- Resale Kitchen renovation — A new kitchen will attract buyers and increase the home's value. ↑
- Resale Bathroom updates — Modern bathrooms will appeal to potential buyers and increase the home's value. ↑
- Resale Flooring replacement — New flooring will improve the home's appearance and increase its value. ↑
- Resale Painting and exterior repairs — Fresh paint and repairs will enhance the home's curb appeal and increase its value. ↑
- Both HVAC system replacement — A new HVAC system will improve energy efficiency and comfort, benefiting both resale and rental value. ↑
ⓘ Cost ranges are severity-bucket heuristics (US national rule-of-thumb). Get contractor quotes + a written scope before underwriting a rehab budget.
Schools (NCES district)
- District
- Crowley ISD
- NCES district ID
- 4815910
- Math proficiency
- 23% ▼ -15.00%
- Reading proficiency
- 32% ▼ -6.00%
- Median HH income
- $59,810
- Composite
- 25.04/100
- National rank
- #7549
- State rank
- #643 of 826 in TX
Livability — Fort Worth
- Score
- 80/100
- State rank
- #49
- US rank
- #1954
Category grades
Schools grade is shown separately in the Schools card above.
Census & demographics
- Census place
- Fort Worth, TX
- County
- Tarrant County · 2,033,669 people
- City population
- 911,619
- Metro
- Dallas-Fort Worth-Arlington, TX
- Population (ZIP)
- 36,044
- Household income
- $97,973
- Rent vs Own
- Severe rent burden
- 584.0
Population outlook (Tarrant County) Hauer SSP2
- Today (2025)
- 2,380,417 people
- By 2030
- 2,578,900 · +8.3%
- By 2040
- 2,974,995 · +25.0%
- By 2050
- 3,350,489 · +40.8%
- By 2075
- 4,216,909 · +77.2%
- By 2100
- 4,741,527 · +99.2%
Race, ethnicity, and origin ACS 2023
- Neighborhood character
- Diverse neighborhood (Simpson 0.65)
- Race & ethnicity
- White 48% Hispanic / Latino 28% Black 20% Two or more races 14% Asian 2%
- Hispanic origin (detail)
- Mexican 23% Puerto Rican 2%
- Common ancestry
- Slovak 3% Italian 2% Serbian 1%
- Foreign-born
- 8% · Canada, Vietnam
- Languages at home
- 79% English-only · Spanish 18% Other Indo-European 1% Vietnamese 1%
Political lean MEDSL · Tarrant
- 2024 margin
- Lean R (+5.1) · D 46.7% · R 51.9% · Other 1.4%
- 2008→2024 swing
- +6.6pp toward D · 2008: -11.7pp · 2024: -5.1pp
- All cycles
- 2024: R+5.1 2020: D+0.2 2016: R+8.7 2012: R+15.7 2008: R+11.7
Not yet ingested
- Civics
- —
Market trends
- HPI YoY
- ▼ -80.45%
- Current HPI
- 238.6365
- Rent YoY
- ▲ 2.28%
- Metro
- Dallas-Fort Worth-Arlington, TX
- State GDP YoY
- ▲ 3.95%
- F500 in state
- 110
Industry mix (Fortune 500 HQ in TX)
| Industry | F500 HQs | Revenue |
|---|---|---|
| Energy | 16 | $1,198B |
|
||
| Technology | 5 | $198B |
|
||
| Engineering / Construction | 4 | $72B |
|
||
| Energy Services | 3 | $60B |
|
||
| Utilities | 3 | $41B |
|
||
| Healthcare | 2 | $330B |
|
||
Price history
-1.1% since first listed6 events — show timeline
- 2026-06-02 Price Changed $279,999 Zillow
- 2026-06-02 Relisted — Zillow
- 2026-06-02 Listed $280,769 NTREIS
- 2026-03-05 Delisted — Zillow
- 2026-02-28 Price Changed $278,999 Zillow
- 2026-02-27 Listed $282,999 Zillow
Cash-flow waterfall
monthlySold comps — $/sqft
last 12 mo · ≤1 miLoading sold comps…