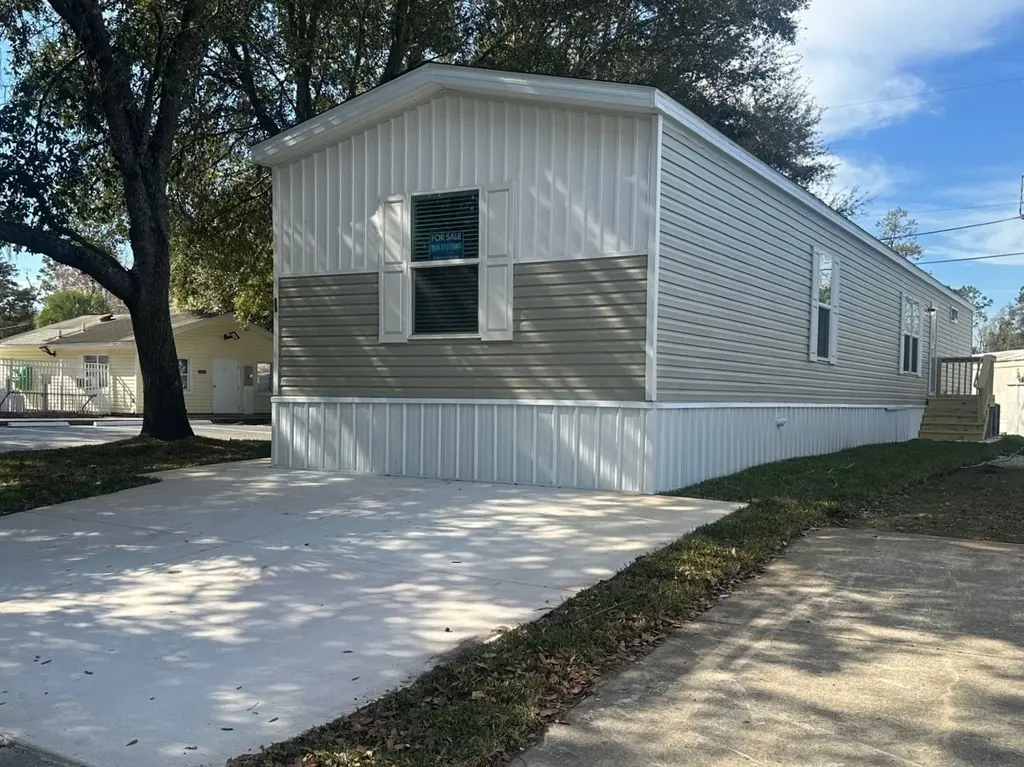
5515 118th St #48 · Jacksonville, FL
Flood risk 1/10 · Minimal
- FEMA flood zone
- X (unshaded)
- Chance of flooding over 30 yrs
- 0.0%
- Est. flood insurance / yr
- $507 – $1,088
Fire risk 3/10 · Minor
- Est. fire insurance / yr
- $947 – $1,759
Heat risk 8/10 · Major
- Hot days now (above 107°F)
- 7 days/yr
- Hot days in 30 yrs
- 19 days/yr
Wind risk 9/10 · Severe
- Chance of severe wind over 30 yrs
- 99.0%
Air-quality risk 3/10 · Minor
- Unhealthy air days now
- 3 days/yr
- Unhealthy air days in 30 yrs
- 3 days/yr
Risk factors via First Street. Map © Google.
Why this score? — see what drove the B grade
The composite is a weighted blend of 9 inputs, each scored 0–100. Each bar is that input's sub-score; the figure is the points it added to the 100-point composite (weight × sub-score).
- Cash flow +30.0/30.0
- 1% rule +10.0/10.0
- DSCR +10.0/10.0
- ARV discount +7.5/15.0
- Livability +4.2/5.0
- Condition / age +4.0/5.0
- Schools +3.9/10.0
- Rent growth +3.1/5.0
- Appreciation +0.0/10.0
$67,400
🖨 Deal sheet (PDF) 📄 Offer letter ✓ Due diligence
Listing remarks
Your brand new 3 bedroom, 2 bathroom home is waiting for you to move in! This comfortable home features premium entry doors, a modern bathroom, as well as new brand name appliances. In the community, enjoy with your friends and family all the amenities we have to offer such as a clubhouse, a swimming pool, and a playground. This home won't be on the market long, so call us today for more information or to schedule a tour. Deposits & Fees are subject to change.
Key facts
- Clubhouse
- Swimming pool
- Modern bathroom
Tags
Property features AI
Finance
- Financial info: List price $67,400
Exterior
- Utilities: Electric heating; Central air conditioning
- Home design: Condominium / townhouse style unit; Single-story unit
Interior
- Bedrooms: 3 bedrooms
- Bathrooms: 2 full bathrooms
- Heating & cooling: Electric heating; Central air conditioning
- Interior features: Apartment/unit in a multi-unit building
Neighborhood map
What this means for you Summary
Snapshot
- This is a 3-bed/2.0-bath manufactured listed at $67k. Condition is rated good.
Deal economics
- At list price, monthly cash flow is $774 ($9k/yr) — positive.
- The deal already cash-flows at list — no discount required.
- Meets the 1% rule at list price ($2k rent vs $67k).
- Cap rate 20.1% vs local median 4.0% in Jacksonville — top-decile yield for the area; either an underpriced asset or a hidden risk that comps aren't pricing in. Stress-test before assuming the spread holds.
Location & tenants
- Location reads 83/100 on livability (#50 in FL, #911 nationally) — a professional / high-income tenant draw. Strengths: amenities A+, commute A+, housing A+.
- Duval (urban): math 46% / reading 45% proficiency, ranked #48 of 73 in FL (top 66%) — families likely to look elsewhere, expect single-tenant / working-renter base with shorter leases.
- Market conditions: Rents rising (+2.2%/yr); 349 active listings in the ZIP; 40 comparable units currently listed for rent nearby; rentals at typical pace (median 15d on market — plan ~3-4 weeks tenant-placement turnaround); 6,503 units permitted in Duval County in 2024 (1,131 in 5+ unit buildings).
- This rent runs 30% of the median local income ($62k/yr) — at the standard rent-burdened threshold; future hikes will face affordability resistance.
Forward outlook
- Local home prices are declining (-3.0%/yr); year-one equity from $466 of loan paydown is wiped out by about $2k of value loss. Plan a longer hold.
- Duval County population projected at +19% by 2050 — long-run rental-demand tailwind backs the buy-and-hold thesis.
- At projected returns (-3.0% appreciation + 2.2% rent growth), your $19k cash investment doubles in ~3 years — after that, you're playing with house money.
Negotiation context
- Only 13 days on market — expect competitive offers; lowballing is unlikely to land.
Risks & watch-outs
- Climate carrying-cost: severe wind risk, 99% chance of damaging wind over 30y; extreme-heat days projected 7→19/yr by 2055 (HVAC capex compounding) — expect insurance premiums to compound above CPI over the hold.
Questions for the listing agent
- Is there a deadline driving the sale (1031 exchange, divorce, estate, relocation)? That informs how much negotiation room exists.
- Schools are B-rated — typically a magnet for longer-tenancy family renters. What's the average tenant stay here, and is there a school-zone premium baked into asking?
- What's the average days-on-market for RENTAL listings here right now (not sales)? A rising rental-DOM trend means longer vacancies and softer asking-rent achievability than the comps imply.
- What's the recent tenant-quality profile in this submarket — average credit score on applications, eviction rate, late-payment / NSF rate, and stable-employment percentage? A property-management company in the area should have these aggregated.
- How much new for-sale + rental construction is in the pipeline within 1–3 miles? Heavy new supply typically softens prices + rents 12–24 months out; constrained supply supports both.
Investment metrics
- 1% rule
- 2.33% ✓
- Cap rate
- 20.08%
- Cash-on-cash
- 49.24%
- DSCR
- 3.19
- GRM
- 3.6
CMA / ARV
- ARV (on-the-fly)
- $186,048
- Comps found
- 2
Show comp detail 2 sales within ~0.75 mi
| Address | Dist | Beds/Ba | Sqft | Sold | Price | $/sf | Match |
|---|---|---|---|---|---|---|---|
| 6387 Sundown Dr | 0.29mi | 3/2.0 | 1,296 (+7%) | 11mo | $158,000 | $122 | 66 |
| 6630 Seaboard Ave | 0.53mi | 2/2.0 (-1) | 1,173 (-4%) | 10mo | $180,000 | $153 | 56 |
Match score weights: distance 35% · size 25% · config 20% · recency 20%. Top-matched comps best support the ARV.
Projected returns pro-forma
-3.0% appreciation · 2.25% rent growth · sell at horizon
- IRR
- 46.0%
- Equity multiple
- 2.97×
- Total profit
- $37,245
- Equity at exit
- $10,050
- IRR
- 51.5%
- Equity multiple
- 5.84×
- Total profit
- $91,281
- Equity at exit
- $5,828
Cash invested: $18,872 (down + closing). Projections, not guarantees.
Landlord ↔ Tenant lean methodology
- Overall (STATE)
- 87 Strongly Landlord-Friendly
- State Florida
- 87 Strongly Landlord-Friendly · R+3
- County
- — inherits STATE
- City
- — inherits STATE
ZIP-level market 32244
- Home prices YoY
- -17.8%
- Rents YoY
- 2.2%
- Active inventory
- 349
- Price-to-rent
- 3.6×
Monthly cashflow live
- Estimated rent
- $1,570 high interval (Pro) →
- Mortgage (P&I)
- −$353
- Tax est. 1.5%
- −$84 /mo · $1,011/yr
- Insurance
- −$28
- HOA
- −$0
- Vacancy / Maint / Mgmt
- −$330
- Net cashflow
- $774
Break-even live
Sensitivity live
| Price | -10% $821 | -5% $798 | +0% $774 | +5% $751 | +10% $728 |
|---|---|---|---|---|---|
| Rent | -10% $650 | -5% $712 | +0% $774 | +5% $836 | +10% $898 |
| Rate | -1.0pp $808 | -0.5pp $791 | base $774 | +0.5pp $757 | +1.0pp $739 |
UW: 25.0% down · 7.5% · 30yr · 1.5% tax · 5.0% vac · 8.0% maint · 8.0% mgmt
Financing live
Cash to close
- Down payment
- $16,850
- Closing costs
- $2,022
- Reserves months
- —
- Total cash needed
- —
Loan-product check · same deal, 3 products live
Conventional
25% down · 7.5% · 30yr
- Down + closing
- —
- Monthly P&I
- —
- Monthly cashflow
- —
- DSCR
- —
- Eligible?
- —
Personal DTI + credit; lowest rate.
DSCR
20% down · 8.5% · 30yr
- Down + closing
- —
- Monthly P&I
- —
- Monthly cashflow
- —
- DSCR
- —
- Eligible?
- —
No personal income docs; deal must DSCR.
Hard money
10% down · 12.0% · 12mo
- Down + closing
- —
- Monthly P&I
- —
- Monthly cashflow
- —
- DSCR
- —
- Eligible?
- —
Short-term bridge; refi at stabilization.
Rent comps 40 comps
| Address | Beds | Baths | Sqft | Rent | $/sqft | DOM | Units | Dist |
|---|---|---|---|---|---|---|---|---|
| 6221 Alfredo Dr W Jacksonville, FL | 3.0 | 2.0 | 1133 | $1,710 | $1.51 | 4d | 1 | 0.60mi |
| 5558 Bennington Dr Jacksonville, FL | 2.0 | 2.0 | 988 | $1,275 | $1.29 | 5d | 1 | 0.60mi |
| 5626 Bryner Dr Jacksonville, FL | 2.0 | 3.0 | 1404 | $1,320 | $0.94 | 22d | 1 | 0.63mi |
| 5642 Bryner Dr Jacksonville, FL | 2.0 | 1.5 | 1406 | $1,290 | $0.92 | 22d | 1 | 0.64mi |
| 5640 Bryner Dr Jacksonville, FL | 2.0 | 2.0 | 1000 | $1,260 | $1.26 | 24d | 1 | 0.64mi |
| 5685 Marathon Pkwy Jacksonville, FL | 2.0 | 2.0 | 1015 | $1,000 | $0.99 | 20d | 1 | 0.68mi |
| 5939 Pueblo Ct Jacksonville, FL | 4.0 | 2.0 | 1288 | $1,495 | $1.16 | 8d | 1 | 0.77mi |
| 5700 Fishing Pen Creek Ct Jacksonville, FL | 2.0 | 1.0 | 854 | $1,100 | $1.29 | 3d | 8 | 0.78mi |
| 5983 Ortega Lake Dr Unit 1 Jacksonville, FL | 3.0 | 2.5 | 1400 | $1,950 | $1.39 | 24d | 1 | 0.92mi |
| 6051 Maggies Cir #107 Jacksonville, FL | 3.0 | 2.0 | 1335 | $1,400 | $1.05 | 22d | 1 | 0.94mi |
| 5664 Minocqua St Jacksonville, FL | 4.0 | 1.5 | 1023 | $1,545 | $1.51 | 4d | 1 | 0.96mi |
| 6063 Maggies Cir #110 Jacksonville, FL | 3.0 | 2.0 | 1335 | $1,350 | $1.01 | 5d | 1 | 0.97mi |
| 6063 Maggies Cir Jacksonville, FL | 2.0–3.0 | 2.0 | 1121 | $1,350 | $1.20 | 17d | 2 | 0.97mi |
| 6111 Maggies Cir #107 Jacksonville, FL | 3.0 | 2.0 | 1335 | $1,350 | $1.01 | 24d | 1 | 0.99mi |
| 6112 Maggies Cir #108 Jacksonville, FL | 3.0 | 2.0 | 1335 | $1,375 | $1.03 | 24d | 1 | 1.00mi |
| 6136 Blanding Blvd Jacksonville, FL | 1.0–3.0 | 1.0–2.0 | 1030 | $2,020 | $1.96 | 2d | 9 | 1.02mi |
| 6105 Maggies Cir #115 Jacksonville, FL | 3.0 | 2.0 | 1335 | $1,425 | $1.07 | 2d | 1 | 1.03mi |
| 6105 Maggies Cir Jacksonville, FL | 2.0–3.0 | 2.0 | 1121 | $1,445 | $1.29 | 18d | 2 | 1.03mi |
| 5327 Timuquana Rd Jacksonville, FL | 1.0–3.0 | 1.0–2.0 | 950 | $1,599 | $1.68 | 2d | 27 | 1.04mi |
| 6100 Maggies Cir #103 Jacksonville, FL | 2.0 | 2.0 | 907 | $1,300 | $1.43 | 13d | 1 | 1.06mi |
| 6094 Maggies Cir #107 Jacksonville, FL | 3.0 | 2.0 | 1335 | $1,425 | $1.07 | 15d | 1 | 1.07mi |
| 6099 Maggies Cir #101 Jacksonville, FL | 3.0 | 2.0 | 1335 | $1,650 | $1.24 | 18d | 1 | 1.08mi |
| 6985 Ortega Woods Dr Unit 8 Jacksonville, FL | 3.0 | 2.0 | 1157 | $1,350 | $1.17 | 3d | 1 | 1.11mi |
| 6087 Maggies Cir #104 Jacksonville, FL | 2.0 | 2.0 | 1099 | $1,275 | $1.16 | 24d | 1 | 1.11mi |
| 6880 Skaff Ave Jacksonville, FL | 2.0 | 2.0 | 940 | $1,285 | $1.37 | 24d | 1 | 1.14mi |
| 6915 Ortega Woods Dr Unit 11 Jacksonville, FL | 2.0 | 2.0 | 940 | $1,150 | $1.22 | 21d | 1 | 1.15mi |
| 5375 Ortega Farms Blvd #715 Jacksonville, FL | 2.0 | 2.0 | 1016 | $1,700 | $1.67 | 24d | 1 | 1.17mi |
| 5988 Creekside Crossing Dr Jacksonville, FL | 3.0 | 2.5 | 1404 | $1,850 | $1.32 | 15d | 1 | 1.20mi |
| 5984 Creekside Crossing Dr Jacksonville, FL | 3.0 | 2.5 | 1404 | $1,695 | $1.21 | 15d | 1 | 1.21mi |
| 5958 Creekside Crossing Dr Jacksonville, FL | 3.0 | 2.5 | 1404 | $1,895 | $1.35 | 11d | 1 | 1.21mi |
| 5058 Acre Estates Dr W Jacksonville, FL | 3.0 | 2.0 | 1402 | $1,825 | $1.30 | 3d | 1 | 1.21mi |
| 5900 Townsend Rd Jacksonville, FL | 1.0–3.0 | 1.0–2.0 | 1177 | $1,699 | $1.44 | 3d | 12 | 1.31mi |
| 4800 Ortega Farms Blvd Jacksonville, FL | 1.0–3.0 | 1.0 | 880 | $1,435 | $1.63 | 3d | 10 | 1.38mi |
| 4800 Ortega Farms Blvd Jacksonville, FL | 1.0–3.0 | 1.0 | 880 | $1,465 | $1.66 | 11d | 9 | 1.38mi |
| 5747 Antoinette Ln Jacksonville, FL | 2.0 | 1.0 | 1200 | $1,195 | $1.00 | 24d | 1 | 1.38mi |
| 5745 Antoinette Ln Jacksonville, FL | 2.0 | 1.0 | 1200 | $1,150 | $0.96 | 3d | 1 | 1.38mi |
| 5933 Jammes Rd Jacksonville, FL | 3.0 | 3.0 | 1071 | $1,900 | $1.77 | 24d | 1 | 1.39mi |
| 5984 Windsor Forest Dr Jacksonville, FL | 2.0 | 1.5 | 900 | $1,174 | $1.30 | 22d | 2 | 1.40mi |
| 5985 Windsor Forest Dr Unit 23 Jacksonville, FL | 2.0 | 1.5 | 900 | $999 | $1.11 | 22d | 1 | 1.43mi |
| 5985 Windsor Forest Dr Jacksonville, FL | 2.0 | 1.5 | 900 | $1,099 | $1.22 | 8d | 1 | 1.43mi |
Climate risk First Street
- Flood 1/10 Low FEMA zone X (unshaded) · 0% chance over 30 yrs
- Wildfire 3/10 Moderate
- Heat 8/10 Severe 7 d/yr ≥107°F today · 19 d/yr by 30 yrs out
- Wind 9/10 Extreme 99% chance of damaging wind over 30 yrs
- Air quality 3/10 Moderate 3 unhealthy d/yr today · 3 by 30 yrs out
Nearby sold comps map
Loading sold comps map…
Walkable amenities ~0.75 mi
Loading nearby amenities…
Taxation est. · year 1
- Rental income
- $18,837
- − Mortgage interest
- −$3,775
- − Property taxes
- −$1,011
- − Insurance
- −$337
- − Repairs & maintenance
- −$1,507
- − Management
- −$1,507
- − Depreciation
- −$1,961
- Taxable income
- $8,739
- Est. tax owed @ 24.0%
- −$2,097
- After-tax cash flow
- $7,195/yr
For passive investors: Depreciation is non-cash, so a rental often shows a tax loss while cash-flowing — sheltering income. Rental losses are passive: they offset passive income freely, and up to $25,000/yr can offset ordinary (W-2) income if you actively participate and your MAGI is under $100k (phasing out to $0 by $150k); unused losses carry forward. On sale, claimed depreciation is recaptured at up to 25%, and gains may owe capital-gains tax (a 1031 exchange can defer both). Figures are a year-1 estimate at your 24.0% rate — not tax advice; consult a CPA.
Condition & rehab AI · 5 photos
This move-in-ready manufactured home features a modern kitchen, bathrooms, and exterior, with no visible repairs or maintenance needed. Potential buyers and tenants will appreciate the fresh paint, landscaping, and smart home features that can be added to further enhance the home's value.
Value-add opportunities
- Both Painting the exterior and interior walls — Fresh paint can enhance curb appeal and interior aesthetics.
- Both Landscaping improvements — Enhanced landscaping can improve curb appeal and attract more potential buyers/tenants.
- Both Adding smart home features — Smart home features can increase the home's appeal and market value.
- Both Upgrading the kitchen appliances — Upgrading to more modern or energy-efficient appliances can increase the home's value and attract more buyers/tenants.
Renovation cost estimate screening
Value-add ROI direction
- Both Painting the exterior and interior walls — Fresh paint can enhance curb appeal and interior aesthetics. ↑
- Both Landscaping improvements — Enhanced landscaping can improve curb appeal and attract more potential buyers/tenants. ↑
- Both Adding smart home features — Smart home features can increase the home's appeal and market value. ↑
- Both Upgrading the kitchen appliances — Upgrading to more modern or energy-efficient appliances can increase the home's value and attract more buyers/tenants. ↑
ⓘ Cost ranges are severity-bucket heuristics (US national rule-of-thumb). Get contractor quotes + a written scope before underwriting a rehab budget.
Schools (NCES district)
- District
- Duval
- NCES district ID
- 1200480
- Math proficiency
- 46% ▼ -11.00%
- Reading proficiency
- 45% ▼ -4.00%
- Median HH income
- $48,987
- Composite
- 38.97/100
- National rank
- #4076
- State rank
- #48 of 73 in FL
Livability — Jacksonville
- Score
- 83/100
- State rank
- #50
- US rank
- #911
Category grades
Schools grade is shown separately in the Schools card above.
Census & demographics
- Census place
- Jacksonville, FL
- County
- Duval County · 1,015,274 people
- City population
- 979,034
- Metro
- Jacksonville, FL
- Population (ZIP)
- 63,592
- Household income
- $62,204
- Rent vs Own
- Severe rent burden
- 2799.0
Population outlook (Duval County) Hauer SSP2
- Today (2025)
- 1,013,010 people
- By 2030
- 1,059,228 · +4.6%
- By 2040
- 1,141,439 · +12.7%
- By 2050
- 1,205,258 · +19.0%
- By 2075
- 1,324,282 · +30.7%
- By 2100
- 1,319,620 · +30.3%
Race, ethnicity, and origin ACS 2023
- Neighborhood character
- Highly diverse neighborhood (Simpson 0.70)
- Race & ethnicity
- White 39% Black 35% Hispanic / Latino 15% Two or more races 10% Asian 6%
- Hispanic origin (detail)
- Mexican 3% Puerto Rican 6% Cuban 3%
- Common ancestry
- Hispanic 1% Lithuanian 1% Romanian 1%
- Foreign-born
- 12% · Canada, Vietnam, China
- Languages at home
- 83% English-only · Spanish 9% Tagalog/Filipino 3% French/Haitian/Cajun 2%
Political lean MEDSL · Duval
- 2024 margin
- Toss-up / Even · D 48.7% · R 50.1% · Other 1.2%
- 2008→2024 swing
- +0.4pp no change · 2008: -1.9pp · 2024: -1.5pp
- All cycles
- 2024: R+1.5 2020: D+3.8 2016: R+1.5 2012: R+3.6 2008: R+1.9
Not yet ingested
- Civics
- —
Market trends
- HPI YoY
- ▼ -64.22%
- Current HPI
- 296.5375
- Rent YoY
- ▲ 2.25%
- Metro
- Jacksonville, FL
- State GDP YoY
- ▲ 3.28%
- F500 in state
- 36
Industry mix (Fortune 500 HQ in FL)
| Industry | F500 HQs | Revenue |
|---|---|---|
| Industrial Technology | 2 | $29B |
|
||
| Insurance | 2 | $17B |
|
||
| Retail | 1 | $60B |
|
||
| Technology Distribution | 1 | $58B |
|
||
| Homebuilding | 1 | $35B |
|
||
| Technology Manufacturing | 1 | $35B |
|
||
Cash-flow waterfall
monthlySold comps — $/sqft
last 12 mo · ≤1 miLoading sold comps…