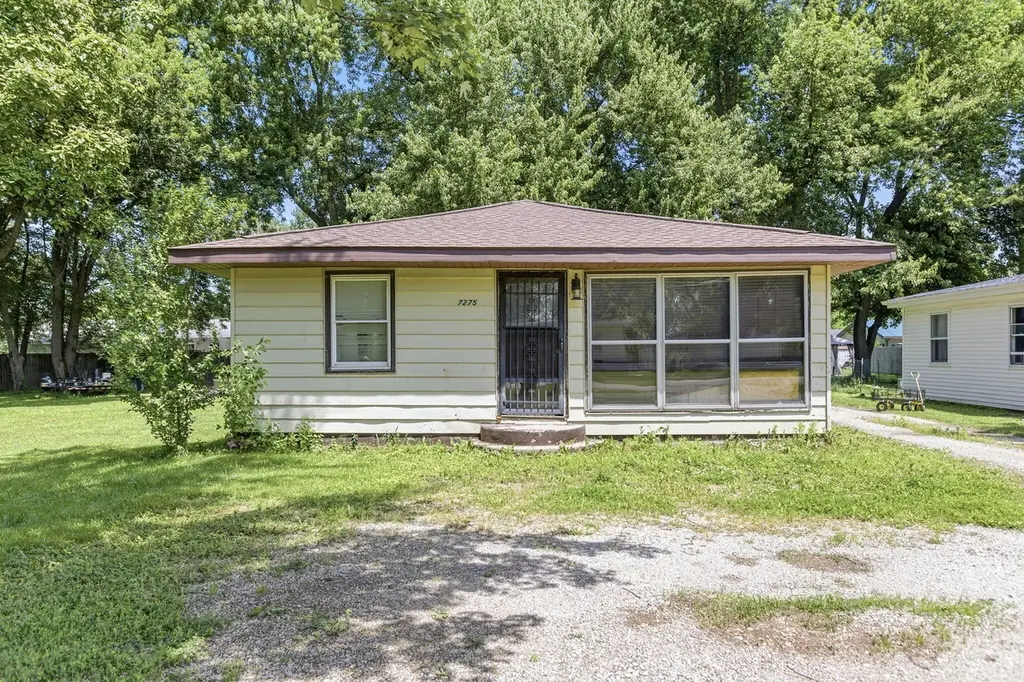
7275 Helen · Paw Paw Lake, MI
Flood risk 1/10 · Minimal
- FEMA flood zone
- X (unshaded)
- Chance of flooding over 30 yrs
- 0.0%
- Est. flood insurance / yr
- $473 – $860
Fire risk 2/10 · Minimal
- Est. fire insurance / yr
- $784 – $1,456
Heat risk 2/10 · Minimal
- Hot days now (above 99°F)
- 7 days/yr
- Hot days in 30 yrs
- 15 days/yr
Wind risk 2/10 · Minimal
- Chance of severe wind over 30 yrs
- —
Air-quality risk 4/10 · Minor
- Unhealthy air days now
- 4 days/yr
- Unhealthy air days in 30 yrs
- 7 days/yr
Risk factors via First Street. Map © Google.
Why this score? — see what drove the B grade
The composite is a weighted blend of 9 inputs, each scored 0–100. Each bar is that input's sub-score; the figure is the points it added to the 100-point composite (weight × sub-score).
- Cash flow +30.0/30.0
- ARV discount +15.0/15.0
- DSCR +10.0/10.0
- 1% rule +8.4/10.0
- Livability +3.3/5.0
- Rent growth +2.5/5.0
- Condition / age +2.5/5.0
- Schools +2.4/10.0
- Appreciation +0.0/10.0
$109,900
🖨 Deal sheet (PDF) 📄 Offer letter ✓ Due diligence
Listing remarks MLS
Charming 3-bed, 1-bath cottage minutes from Paw Paw Lake in peaceful Coloma. Set on a rare double lot, the property offers room to garden, play, or plan future additions. Inside, the cozy floor plan features a big living room, eat-in kitchen, and three comfortable bedrooms. Home does need a bit of TLC--perfect chance to add your style and build equity. Huge shed keeps all the lake toys, tools, and lawn gear organized. Whether you're dreaming of a weekend retreat, year-round residence, or investment, this cottage delivers small-town charm, generous outdoor space, and endless potential at an affordable price. Schedule your tour today and let your imagination take it from here!
Key facts
- Huge shed
- Double lot
- Outdoor space
Tags
Property features AI
Exterior
- Utilities: Well water
- Home design: Ranch-style single family home; Single-story
- Construction: Built in 1955; Vinyl siding; Asphalt roof; Crawl space foundation
- Exterior features: Paved road access; Storage shed on the property
Interior
- Kitchen: Refrigerator
- Bathrooms: 1 full bathroom
- Heating & cooling: Forced air heating; Has cooling
- Interior features: Total of 6 rooms; Refrigerator included; Crawl space basement
Neighborhood map
What this means for you Summary
Snapshot
- This is a 2-bed/1.0-bath single-family listed at $110k.
Deal economics
- At list price, monthly cash flow is $444 ($5k/yr) — positive.
- The deal already cash-flows at list — no discount required.
- Meets the 1% rule at list price ($1k rent vs $110k).
- Cap rate 11.1% vs local median 2.5% in Paw Paw Lake — top-decile yield for the area; either an underpriced asset or a hidden risk that comps aren't pricing in. Stress-test before assuming the spread holds.
Location & tenants
- Location reads 66/100 on livability (#420 in MI) — a middle-class / working-renter tenant base. Strengths: cost of living A+, housing A+, crime A; Watch: schools F, amenities F, commute F.
- Coloma Community Schools (town): math 17% / reading 39% proficiency, ranked #384 of 540 in MI (top 71%) — low school quality limits family demand, transient renter base, plan for 1-2y turnover.
- Market conditions: 43 active listings in the ZIP; 397 units permitted in Berrien County in 2024 (40 in 5+ unit buildings).
Forward outlook
- Local home prices are declining (-3.0%/yr); year-one equity from $760 of loan paydown is wiped out by about $3k of value loss. Plan a longer hold.
- Berrien County population projected at -16% by 2050 — secular population decline; favor cash flow + early exit over multi-decade hold.
- At projected returns (-3.0% appreciation + 3.0% rent growth), your $31k cash investment doubles in ~7 years — after that, you're playing with house money.
Negotiation context
- Only 2 days on market — expect competitive offers; lowballing is unlikely to land.
- 3 sale attempts with the ask held roughly flat each time — persistent listings suggest the price (not the market) is what's stuck; bring a comps-based counter.
Risks & watch-outs
- Watch-outs: built in 1955 — expect roof / HVAC / electrical / plumbing capex.
Questions for the listing agent
- Built in 1955 — when were the roof, HVAC, electrical panel, plumbing, and water heater last replaced?
- Is there a deadline driving the sale (1031 exchange, divorce, estate, relocation)? That informs how much negotiation room exists.
- Schools are F-rated, which usually means shorter tenancies and higher turnover. Who's the typical renter profile here, and what's been the actual vacancy rate?
- What's the average days-on-market for RENTAL listings here right now (not sales)? A rising rental-DOM trend means longer vacancies and softer asking-rent achievability than the comps imply.
- What's the recent tenant-quality profile in this submarket — average credit score on applications, eviction rate, late-payment / NSF rate, and stable-employment percentage? A property-management company in the area should have these aggregated.
- How much new for-sale + rental construction is in the pipeline within 1–3 miles? Heavy new supply typically softens prices + rents 12–24 months out; constrained supply supports both.
Investment metrics
- 1% rule
- 1.34% ✓
- Cap rate
- 11.14%
- Cash-on-cash
- 17.32%
- DSCR
- 1.77
- GRM
- 6.2
CMA / ARV
- ARV (on-the-fly)
- $176,400
- Comps found
- 7
Show comp detail 7 sales within ~0.75 mi
| Address | Dist | Beds/Ba | Sqft | Sold | Price | $/sf | Match |
|---|---|---|---|---|---|---|---|
| 7273 Sylvester | 0.06mi | 2/1.0 | 924 (-8%) | 13mo | $219,000 | $237 | 73 |
| 7234 Sylvester | 0.11mi | 3/1.0 (+1) | 1,008 (0%) | 24mo | $176,000 | $175 | 70 |
| 6185 N Shore Dr | 0.29mi | 3/1.0 (+1) | 964 (-4%) | 12mo | $220,000 | $228 | 65 |
| 6020 Johnson Rd | 0.04mi | 3/1.5 (+1) | 1,064 (+6%) | 24mo | $115,000 | $108 | 62 |
| 7141 Little Paw Paw Lake Rd | 0.36mi | 3/1.0 (+1) | 1,040 (+3%) | 20mo | $180,000 | $173 | 56 |
| 6820 Cherry St | 0.73mi | 3/1.0 (+1) | 1,124 (+12%) | 8mo | $135,000 | $120 | 35 |
| 5598 Johnson Rd | 0.48mi | 3/2.0 (+1) | 1,112 (+10%) | 23mo | $230,000 | $207 | 33 |
Match score weights: distance 35% · size 25% · config 20% · recency 20%. Top-matched comps best support the ARV.
Projected returns pro-forma
-3.0% appreciation · 3.0% rent growth · sell at horizon
- IRR
- 8.7%
- Equity multiple
- 1.34×
- Total profit
- $10,481
- Equity at exit
- $16,386
- IRR
- 17.9%
- Equity multiple
- 2.48×
- Total profit
- $45,542
- Equity at exit
- $9,502
Cash invested: $30,772 (down + closing). Projections, not guarantees.
Landlord ↔ Tenant lean methodology
- Overall (STATE)
- 62 Landlord-Friendly
- State Michigan
- 62 Landlord-Friendly · EVEN
- County
- — inherits STATE
- City
- — inherits STATE
ZIP-level market 49038
- Active inventory
- 43
- Price-to-rent
- 6.2×
Monthly cashflow live
- Estimated rent
- $1,469 medium interval (Pro) →
- Mortgage (P&I)
- −$576
- Tax from tax record
- −$94 /mo · $1,126/yr
- Insurance
- −$46
- HOA
- −$0
- Vacancy / Maint / Mgmt
- −$308
- Net cashflow
- $444
Break-even live
Sensitivity live
| Price | -10% $506 | -5% $475 | +0% $444 | +5% $413 | +10% $382 |
|---|---|---|---|---|---|
| Rent | -10% $328 | -5% $386 | +0% $444 | +5% $502 | +10% $560 |
| Rate | -1.0pp $500 | -0.5pp $472 | base $444 | +0.5pp $416 | +1.0pp $387 |
UW: 25.0% down · 7.5% · 30yr · 1.5% tax · 5.0% vac · 8.0% maint · 8.0% mgmt
Financing live
Cash to close
- Down payment
- $27,475
- Closing costs
- $3,297
- Reserves months
- —
- Total cash needed
- —
Loan-product check · same deal, 3 products live
Conventional
25% down · 7.5% · 30yr
- Down + closing
- —
- Monthly P&I
- —
- Monthly cashflow
- —
- DSCR
- —
- Eligible?
- —
Personal DTI + credit; lowest rate.
DSCR
20% down · 8.5% · 30yr
- Down + closing
- —
- Monthly P&I
- —
- Monthly cashflow
- —
- DSCR
- —
- Eligible?
- —
No personal income docs; deal must DSCR.
Hard money
10% down · 12.0% · 12mo
- Down + closing
- —
- Monthly P&I
- —
- Monthly cashflow
- —
- DSCR
- —
- Eligible?
- —
Short-term bridge; refi at stabilization.
Listing history 4 events
-
2026-06-14status $109,900 Pending 2 DOM
-
2026-06-13days on market $109,900 Active 2 DOM
-
2026-06-12remarks 683-char remark
-
2026-06-12$109,900 Active 1 DOM
ⓘ Source: listings_history table (triggers on properties + properties_extension) + one-shot
backfill from property_details.listing_events for pre-trigger history.
Tax reassessment forecast MI · Partial reset (capped growth)
- Current annual tax
- $1,126 · $94/mo
- Projected year-2 tax
- $1,409 · $117/mo
- Expected delta
- +$283/yr (+$24/mo · 25.1%)
ⓘ Screening estimate from a state-policy table — verify with the county assessor before closing.
Climate risk First Street
- Flood 1/10 Low FEMA zone X (unshaded) · 0% chance over 30 yrs
- Wildfire 2/10 Low
- Heat 2/10 Low 7 d/yr ≥99°F today · 15 d/yr by 30 yrs out
- Wind 2/10 Low
- Air quality 4/10 Moderate 4 unhealthy d/yr today · 7 by 30 yrs out
Nearby sold comps map
Loading sold comps map…
Walkable amenities ~0.75 mi
Loading nearby amenities…
Taxation est. · year 1
- Rental income
- $17,624
- − Mortgage interest
- −$6,156
- − Property taxes
- −$1,126
- − Insurance
- −$550
- − Repairs & maintenance
- −$1,410
- − Management
- −$1,410
- − Depreciation
- −$3,197
- Taxable income
- $3,775
- Est. tax owed @ 24.0%
- −$906
- After-tax cash flow
- $4,425/yr
For passive investors: Depreciation is non-cash, so a rental often shows a tax loss while cash-flowing — sheltering income. Rental losses are passive: they offset passive income freely, and up to $25,000/yr can offset ordinary (W-2) income if you actively participate and your MAGI is under $100k (phasing out to $0 by $150k); unused losses carry forward. On sale, claimed depreciation is recaptured at up to 25%, and gains may owe capital-gains tax (a 1031 exchange can defer both). Figures are a year-1 estimate at your 24.0% rate — not tax advice; consult a CPA.
Schools (NCES district)
- District
- Coloma Community Schools
- NCES district ID
- 2610380
- Math proficiency
- 17% ▼ -5.00%
- Reading proficiency
- 39% ▲ 2.00%
- Median HH income
- $48,135
- Composite
- 24.28/100
- National rank
- #7715
- State rank
- #384 of 540 in MI
Livability — Paw Paw Lake
- Score
- 66/100
- State rank
- #420
- US rank
- #11496
Category grades
Schools grade is shown separately in the Schools card above.
Census & demographics
- Census place
- Paw Paw Lake, MI
- Population (ZIP)
- 8,577
Population outlook (Berrien County) Hauer SSP2
- Today (2025)
- 149,273 people
- By 2030
- 145,211 · -2.7%
- By 2040
- 135,435 · -9.3%
- By 2050
- 125,543 · -15.9%
- By 2075
- 103,986 · -30.3%
- By 2100
- 82,256 · -44.9%
Race, ethnicity, and origin ACS 2023
- Neighborhood character
- Predominantly White (82%)
- Race & ethnicity
- White 82% Two or more races 9% Black 6% Hispanic / Latino 4%
- Common ancestry
- Italian 4% Romanian 4% Iranian 3%
- Foreign-born
- 3% · Canada
- Languages at home
- 96% English-only · Spanish 2% Other Indo-European 1% German/W. Germanic 1%
Political lean MEDSL · Berrien
- 2024 margin
- Lean R (+7.9) · D 45.4% · R 53.2% · Other 1.4%
- 2008→2024 swing
- -13.3pp toward R · 2008: 5.5pp · 2024: -7.9pp
- All cycles
- 2024: R+7.9 2020: R+7.4 2016: R+12.7 2012: R+6.6 2008: D+5.5
Not yet ingested
- Civics
- —
Market trends
- HPI YoY
- ▼ -149.33%
- Current HPI
- 237.5873
- Rent YoY
- —
- Metro
- —
- State GDP YoY
- ▲ 1.37%
- F500 in state
- 28
Industry mix (Fortune 500 HQ in MI)
| Industry | F500 HQs | Revenue |
|---|---|---|
| Automotive Parts | 3 | $48B |
|
||
| Automotive | 2 | $372B |
|
||
| Chemicals | 1 | $45B |
|
||
| Automotive Retail | 1 | $29B |
|
||
| Healthcare / Medical Devices | 1 | $23B |
|
||
| Automotive Technology | 1 | $20B |
|
||
Price history
+0.0% since first listed3 events — show timeline
- 2026-06-11 Listed $109,900 REALCOMP
- 2026-06-11 Listed $109,900 MiRealSource-MiMLS
- 2026-06-11 Listed $109,900 SW Michigan MLS
Property tax history
+4.3%/yrLatest (2024): $1,126 · +9.2% YoY. Source: county tax records.
Cash-flow waterfall
monthlySold comps — $/sqft
last 12 mo · ≤1 miLoading sold comps…