190 Labelle Ave · Blasdell, NY
Flood risk 1/10 · Minimal
- FEMA flood zone
- X (unshaded)
- Chance of flooding over 30 yrs
- 0.0%
- Est. flood insurance / yr
- $473 – $860
Fire risk 1/10 · Minimal
- Est. fire insurance / yr
- $691 – $1,283
Heat risk 2/10 · Minimal
- Hot days now (above 92°F)
- 7 days/yr
- Hot days in 30 yrs
- 16 days/yr
Wind risk 1/10 · Minimal
- Chance of severe wind over 30 yrs
- —
Air-quality risk 4/10 · Minor
- Unhealthy air days now
- 3 days/yr
- Unhealthy air days in 30 yrs
- 8 days/yr
Risk factors via First Street. Map © Google.
Why this score? — see what drove the B grade
The composite is a weighted blend of 9 inputs, each scored 0–100. Each bar is that input's sub-score; the figure is the points it added to the 100-point composite (weight × sub-score).
- Cash flow +30.0/30.0
- 1% rule +10.0/10.0
- DSCR +10.0/10.0
- ARV discount +7.5/15.0
- Schools +4.7/10.0
- Livability +3.3/5.0
- Rent growth +2.5/5.0
- Condition / age +2.5/5.0
- Appreciation +0.0/10.0
$59,000
🖨 Deal sheet 📄 Offer letter ✓ Due diligence
Listing remarks MLS
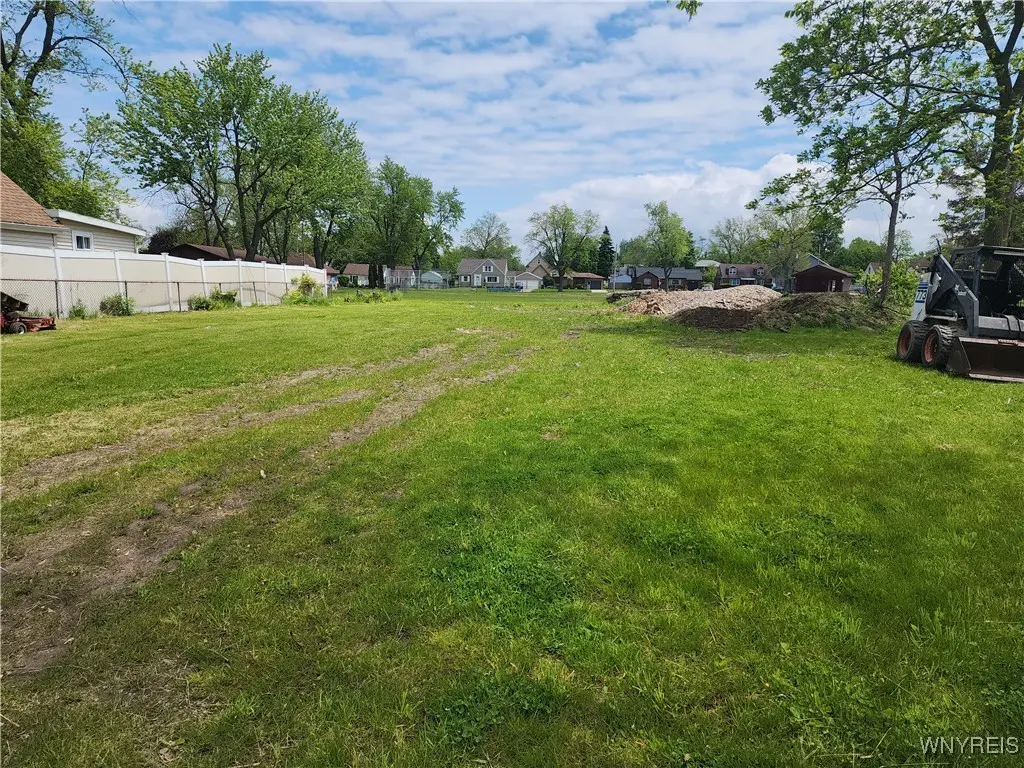
Buildable lot on Labelle Ave. Extra wide and deep. 100 ft. x 175 This includes four tax ID numbers Survey available. Rear of the lot backs up to a park. Great location near all conveniences. Easy access to S. Park Ave. Neighborhood street. Frontier school district. Permission is needed to walk the lot. There are 4 SBL #'s all lots are all connected. 100 ft. x 175 ft. - 75 ft, x 175 ft, additional parcel 65 ft. x 60 ft. .
Key facts
- Easy access
- Buildable lot
- Great location
Tags
Neighborhood map
What this means for you Summary
Snapshot
- This is a 3-bed/1.0-bath single-family listed at $59k.
Deal economics
- At list price, monthly cash flow is $1k ($17k/yr) — positive.
- The deal already cash-flows at list — no discount required.
- Meets the 1% rule at list price ($2k rent vs $59k).
- Recommended offer: $52k (12.0% below list) — sets the bar for market timing.
- Cap rate 34.5% vs local median 4.5% in Blasdell — top-decile yield for the area; either an underpriced asset or a hidden risk that comps aren't pricing in. Stress-test before assuming the spread holds.
Location & tenants
- Location reads 66/100 on livability (#643 in NY) — a middle-class / working-renter tenant base. Strengths: cost of living A+, housing A+, health & safety A+; Watch: employment D, schools D-, amenities F.
- Frontier Central School District (suburban): math 54% / reading 55% proficiency, ranked #301 of 590 in NY (top 51%) — acceptable for families but not a draw, mixed tenant base, ~2y average lease; only 20% free/reduced lunch — higher-income household profile.
- Market conditions: 44 active listings in the ZIP; 1 comparable units currently listed for rent nearby; 1,244 units permitted in Erie County in 2024 (563 in 5+ unit buildings).
Forward outlook
- Local home prices are declining (-3.0%/yr); year-one equity from $408 of loan paydown is wiped out by about $2k of value loss. Plan a longer hold.
- At projected returns (-3.0% appreciation + 3.0% rent growth), your $17k cash investment doubles in ~2 years — after that, you're playing with house money.
Negotiation context
- It's been on market 163 days — a 12% lower offer ($52k) is reasonable based on typical stale-listing flexibility.
- 6 sale attempts since 10y ago with the ask held roughly flat each time — persistent listings suggest the price (not the market) is what's stuck; bring a comps-based counter.
- Current owner paid $25k; list at $59k implies a 136% gain — meaningful room to come down on a strong offer.
Risks & watch-outs
- Watch-outs: built in 1900 — expect roof / HVAC / electrical / plumbing capex.
Questions for the listing agent
- It's been on market 163 days. Have you received any prior offers? Is the seller open to a 12% concession, seller financing, or rate buy-down credit?
- Built in 1900 — when were the roof, HVAC, electrical panel, plumbing, and water heater last replaced?
- Why hasn't it sold? Are there any deal-killer items the seller is aware of (foundation, flood, title, zoning, code violations)?
- Is there a deadline driving the sale (1031 exchange, divorce, estate, relocation)? That informs how much negotiation room exists.
- Schools are D-rated, which usually means shorter tenancies and higher turnover. Who's the typical renter profile here, and what's been the actual vacancy rate?
- What's the average days-on-market for RENTAL listings here right now (not sales)? A rising rental-DOM trend means longer vacancies and softer asking-rent achievability than the comps imply.
- What's the recent tenant-quality profile in this submarket — average credit score on applications, eviction rate, late-payment / NSF rate, and stable-employment percentage? A property-management company in the area should have these aggregated.
- How much new for-sale + rental construction is in the pipeline within 1–3 miles? Heavy new supply typically softens prices + rents 12–24 months out; constrained supply supports both.
Investment metrics
- 1% rule
- 3.73% ✓
- Cap rate
- 34.54%
- Cash-on-cash
- 100.87%
- DSCR
- 5.49
- GRM
- 2.2
CMA / ARV
- ARV (median comp)
- $18,243
- List price
- $59,000
- Delta
- 223.41%
- Verdict
- OVERPRICED
- Comps
- 1 within 2.0 mi
Show comp detail 12 sales within ~0.75 mi
| Address | Dist | Beds/Ba | Sqft | Sold | Price | $/sf | Match |
|---|---|---|---|---|---|---|---|
| 92 Helen Ave | 0.15mi | 3/2.0 | 1,744 (+6%) | 8mo | $229,900 | $132 | 72 |
| 116 Madison Ave | 0.19mi | 3/2.0 | 1,544 (-6%) | 8mo | $385,000 | $249 | 71 |
| 50 Maple Ave | 0.27mi | 4/1.5 (+1) | 1,758 (+7%) | 0mo | $285,000 | $162 | 68 |
| 66 Salisbury Ave | 0.18mi | 3/2.0 | 1,501 (-8%) | 6mo | $191,000 | $127 | 68 |
| 3667 Fuller Ave | 0.72mi | 3/2.0 | 1,644 (+0%) | 1mo | $290,000 | $176 | 61 |
| 15 Kent Ave | 0.23mi | 3/1.5 | 1,410 (-14%) | 8mo | $240,000 | $170 | 57 |
| 24 Lake Ave | 0.36mi | 3/1.5 | 1,410 (-14%) | 4mo | $202,900 | $144 | 55 |
| 3668 Grafton Ave | 0.55mi | 3/2.0 | 1,572 (-4%) | 14mo | $210,000 | $134 | 52 |
| 121 Pearl Ave | 0.52mi | 3/2.0 | 1,800 (+10%) | 7mo | $375,000 | $208 | 50 |
| 131 Orchard Ave | 0.47mi | 3/1.0 | 1,404 (-14%) | 12mo | $195,000 | $139 | 44 |
| 3727 Salisbury Ave | 0.69mi | 3/1.5 | 1,484 (-10%) | 15mo | $205,000 | $138 | 37 |
| 4257 Salem Dr | 0.74mi | 4/3.0 (+1) | 1,695 (+3%) | 13mo | $296,000 | $175 | 36 |
Match score weights: distance 35% · size 25% · config 20% · recency 20%. Top-matched comps best support the ARV.
Projected returns pro-forma
-3.0% appreciation · 3.0% rent growth · sell at horizon
- IRR
- —
- Equity multiple
- 5.77×
- Total profit
- $78,881
- Equity at exit
- $8,797
- IRR
- —
- Equity multiple
- 12.05×
- Total profit
- $182,563
- Equity at exit
- $5,101
Cash invested: $16,520 (down + closing). Projections, not guarantees.
Landlord ↔ Tenant lean methodology
- Overall (STATE)
- 15 Strongly Tenant-Friendly
- State New York
- 15 Strongly Tenant-Friendly · D+10
- County
- — inherits STATE
- City
- — inherits STATE
ZIP-level market 14219
- Home prices YoY
- -19.4%
- Active inventory
- 44
- Price-to-rent
- 2.2×
Monthly cashflow live
- Estimated rent
- $2,200 medium interval (Pro) →
- Mortgage (P&I)
- −$309
- Tax from tax record
- −$15 /mo · $184/yr
- Insurance
- −$25
- HOA
- −$0
- Vacancy / Maint / Mgmt
- −$462
- Net cashflow
- $1,389
Break-even live
UW: 25.0% down · 7.5% · 30yr · 1.5% tax · 5.0% vac · 8.0% maint · 8.0% mgmt
Financing live
Cash to close
- Down payment
- $14,750
- Closing costs
- $1,770
- Reserves months
- —
- Total cash needed
- —
Loan-product check · same deal, 3 products live
Conventional
25% down · 7.5% · 30yr
- Down + closing
- —
- Monthly P&I
- —
- Monthly cashflow
- —
- DSCR
- —
- Eligible?
- —
Personal DTI + credit; lowest rate.
DSCR
20% down · 8.5% · 30yr
- Down + closing
- —
- Monthly P&I
- —
- Monthly cashflow
- —
- DSCR
- —
- Eligible?
- —
No personal income docs; deal must DSCR.
Hard money
10% down · 12.0% · 12mo
- Down + closing
- —
- Monthly P&I
- —
- Monthly cashflow
- —
- DSCR
- —
- Eligible?
- —
Short-term bridge; refi at stabilization.
Rent comps 1 comps
| Address | Beds | Baths | Sqft | Rent | $/sqft | DOM | Units | Dist |
|---|---|---|---|---|---|---|---|---|
| 3365 McKinley Pkwy Buffalo, NY | 3.0 | 1.0 | 2016 | $2,200 | $1.09 | 2d | 1 | 0.99mi |
Listing history 29 events
-
2026-06-18days on market $59,000 Active 163 DOM
-
2026-06-17days on market $59,000 Active 162 DOM
-
2026-06-16days on market $59,000 Active 161 DOM
-
2026-06-15days on market $59,000 Active 160 DOM
-
2026-06-13days on market $59,000 Active 158 DOM
-
2026-06-10days on market $59,000 Active 155 DOM
-
2026-06-09days on market $59,000 Active 154 DOM
-
2026-06-08days on market $59,000 Active 153 DOM
-
2026-06-07days on market $59,000 Active 152 DOM
-
2026-06-05days on market $59,000 Active 149 DOM
-
2026-06-03days on market $59,000 Active 148 DOM
-
2026-06-02days on market $59,000 Active 147 DOM
-
2026-06-01days on market $59,000 Active 146 DOM
-
2026-05-31days on market $59,000 Active 145 DOM
-
2026-01-06$59,000 Active 426-char remark
Show marketing remark (426 chars)
Buildable lot on Labelle Ave. Extra wide and deep. 100 ft. x 175 This includes four tax ID numbers Survey available. Rear of the lot backs up to a park. Great location near all conveniences. Easy access to S. Park Ave. Neighborhood street. Frontier school district. Permission is needed to walk the lot. There are 4 SBL #'s all lots are all connected. 100 ft. x 175 ft. - 75 ft, x 175 ft, additional parcel 65 ft. x 60 ft. .
-
2026-01-06historical
Show marketing remark (426 chars)
Buildable lot on Labelle Ave. Extra wide and deep. 100 ft. x 175 This includes four tax ID numbers Survey available. Rear of the lot backs up to a park. Great location near all conveniences. Easy access to S. Park Ave. Neighborhood street. Frontier school district. Permission is needed to walk the lot. There are 4 SBL #'s all lots are all connected. 100 ft. x 175 ft. - 75 ft, x 175 ft, additional parcel 65 ft. x 60 ft. .
-
2025-06-06$75,000 Active
-
2020-07-17soldstatus $25,000 Closed Sale or Rented
-
2020-07-17soldstatus $25,000
-
2020-02-25status Pending Sale
-
2019-12-30status Under Contract- Do Not Show
-
2019-07-23price $24,900
-
2019-07-01$27,900 Active
-
2019-02-28historical
-
2018-08-28$34,900 Active
-
2018-01-07historical
-
2017-07-10$35,900 Active
-
2017-05-31historical
-
2016-11-08$50,000 Active
ⓘ Source: listings_history table (triggers on properties + properties_extension) + one-shot
backfill from property_details.listing_events for pre-trigger history.
Tax reassessment forecast NY · Partial reset (capped growth)
- Current annual tax
- $184 · $15/mo
- Projected year-2 tax
- $591 · $49/mo
- Expected delta
- +$406/yr (+$34/mo · 220.5%)
ⓘ Screening estimate from a state-policy table — verify with the county assessor before closing.
Climate risk First Street
- Flood 1/10 Low FEMA zone X (unshaded) · 0% chance over 30 yrs
- Wildfire 1/10 Low
- Heat 2/10 Low 7 d/yr ≥92°F today · 16 d/yr by 30 yrs out
- Wind 1/10 Low
- Air quality 4/10 Moderate 3 unhealthy d/yr today · 8 by 30 yrs out
Nearby sold comps map
Loading sold comps map…
Walkable amenities ~0.75 mi
Loading nearby amenities…
Taxation est. · year 1
- Rental income
- $26,400
- − Mortgage interest
- −$3,305
- − Property taxes
- −$184
- − Insurance
- −$295
- − Repairs & maintenance
- −$2,112
- − Management
- −$2,112
- − Depreciation
- −$1,716
- Taxable income
- $16,675
- Est. tax owed @ 24.0%
- −$4,002
- After-tax cash flow
- $12,662/yr
For passive investors: Depreciation is non-cash, so a rental often shows a tax loss while cash-flowing — sheltering income. Rental losses are passive: they offset passive income freely, and up to $25,000/yr can offset ordinary (W-2) income if you actively participate and your MAGI is under $100k (phasing out to $0 by $150k); unused losses carry forward. On sale, claimed depreciation is recaptured at up to 25%, and gains may owe capital-gains tax (a 1031 exchange can defer both). Figures are a year-1 estimate at your 24.0% rate — not tax advice; consult a CPA.
Schools (NCES district)
- District
- Frontier Central School District
- NCES district ID
- 3611670
- Math proficiency
- 54% ▼ -16.00%
- Reading proficiency
- 55% ▼ -10.00%
- Median HH income
- $58,807
- Composite
- 47.36/100
- National rank
- #2291
- State rank
- #301 of 590 in NY
Livability — Blasdell
- Score
- 66/100
- State rank
- #643
- US rank
- #12059
Category grades
Schools grade is shown separately in the Schools card above.
Census & demographics
- Census place
- Blasdell, NY
- Population (ZIP)
- 10,894
Population outlook (Erie County) Hauer SSP2
- Today (2025)
- 933,037 people
- By 2030
- 935,181 · +0.2%
- By 2040
- 928,531 · -0.5%
- By 2050
- 905,725 · -2.9%
- By 2075
- 834,037 · -10.6%
- By 2100
- 708,033 · -24.1%
Race, ethnicity, and origin ACS 2023
- Neighborhood character
- Predominantly White (87%)
- Race & ethnicity
- White 87% Two or more races 5% Hispanic / Latino 5% Asian 2% Black 2%
- Common ancestry
- Romanian 21% Slovak 5% Lithuanian 2%
- Foreign-born
- 3% · Canada
- Languages at home
- 93% English-only · Russian/Polish/Slavic 3% Other Indo-European 2% Spanish 1%
Political lean MEDSL · Erie
- 2024 margin
- Lean D (+9.7) · D 54.8% · R 45.2%
- 2008→2024 swing
- -7.9pp toward R · 2008: 17.5pp · 2024: 9.7pp
- All cycles
- 2024: D+9.7 2020: D+14.7 2016: D+4.8 2012: D+15.6 2008: D+17.5
Not yet ingested
- Civics
- —
Market trends
- HPI YoY
- ▼ -80.33%
- Current HPI
- 332.7314
- Rent YoY
- —
- Metro
- —
- State GDP YoY
- ▲ 2.60%
- F500 in state
- 92
Industry mix (Fortune 500 HQ in NY)
| Industry | F500 HQs | Revenue |
|---|---|---|
| Financial Services | 10 | $950B |
|
||
| Consumer Goods | 9 | $162B |
|
||
| Insurance | 4 | $225B |
|
||
| Telecommunications | 2 | $144B |
|
||
| Pharmaceuticals | 2 | $112B |
|
||
| Media / Entertainment | 2 | $69B |
|
||
Price history
+18.0% since first listed15 events — show timeline
- 2026-01-06 Listing Removed — WNYREIS
- 2026-01-06 Listed $59,000 WNYREIS
- 2025-06-06 Listed $75,000 WNYREIS
- 2020-07-17 Sold (Public Records) $25,000 Public Records
- 2020-07-17 Sold (MLS) $25,000 WNYREIS
- 2020-02-25 Pending — WNYREIS
- 2019-12-30 Pending — WNYREIS
- 2019-07-23 Price Changed $24,900 WNYREIS
- 2019-07-01 Listed $27,900 WNYREIS
- 2019-02-28 Listing Removed — WNYREIS
- 2018-08-28 Listed $34,900 WNYREIS
- 2018-01-07 Listing Removed — WNYREIS
- 2017-07-10 Listed $35,900 WNYREIS
- 2017-05-31 Listing Removed — WNYREIS
- 2016-11-08 Listed $50,000 WNYREIS
Property tax history
-22.5%/yrLatest (2025): $184 · -32.7% YoY. Source: county tax records.
Cash-flow waterfall
monthlySold comps — $/sqft
last 12 mo · ≤1 miLoading sold comps…