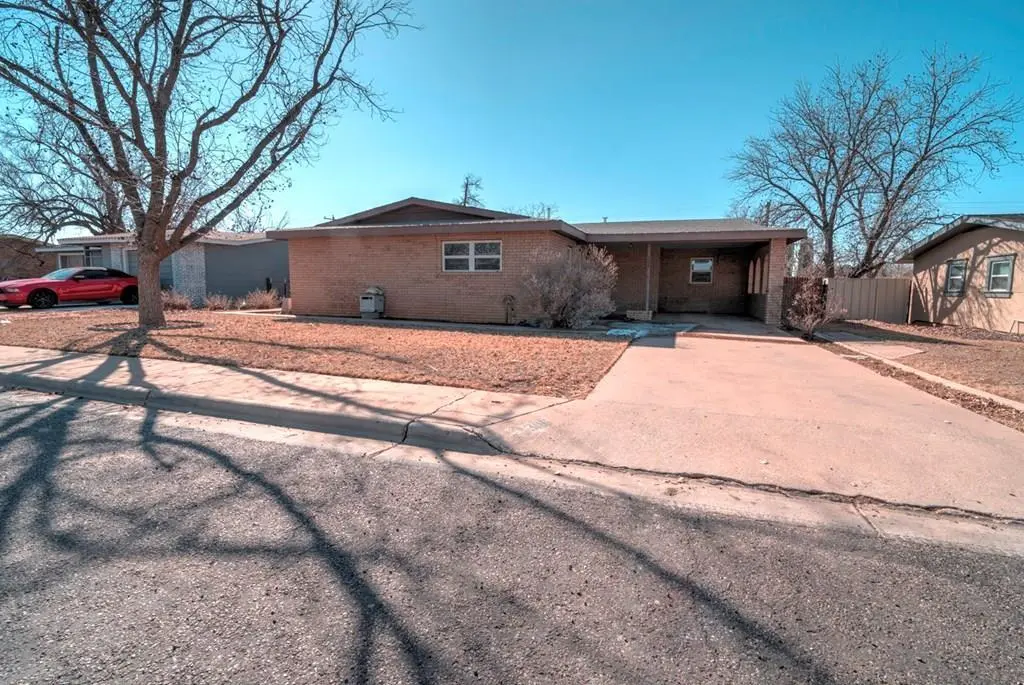
306 SW 12th St · Andrews, TX
Flood risk 1/10 · Minimal
- FEMA flood zone
- —
- Chance of flooding over 30 yrs
- 0.0%
- Est. flood insurance / yr
- —
Fire risk 9/10 · Severe
- Est. fire insurance / yr
- $1,222 – $2,270
Heat risk 5/10 · Moderate
- Hot days now (above 101°F)
- 6 days/yr
- Hot days in 30 yrs
- 17 days/yr
Wind risk 2/10 · Minimal
- Chance of severe wind over 30 yrs
- 3.0%
Air-quality risk 2/10 · Minimal
- Unhealthy air days now
- 1 days/yr
- Unhealthy air days in 30 yrs
- 1 days/yr
Risk factors via First Street. Map © Google.
Why this score? — see what drove the D grade
The composite is a weighted blend of 9 inputs, each scored 0–100. Each bar is that input's sub-score; the figure is the points it added to the 100-point composite (weight × sub-score).
- Cash flow +10.3/30.0
- ARV discount +7.7/15.0
- Appreciation +5.0/10.0
- Livability +3.8/5.0
- Schools +3.7/10.0
- 1% rule +3.1/10.0
- DSCR +3.0/10.0
- Rent growth +2.5/5.0
- Condition / age +2.2/5.0
$210,000
🖨 Deal sheet 📄 Offer letter ✓ Due diligence
Listing remarks MLS
Unlock the potential of this three bedroom, three bath home! This home is being sold as-is and needs some cosmetic attention. The kitchen has lots of storage, an island, & a huge pantry/laundry room. Spacious living room with custom built in cabinets. Step down study/office/game room/second living room. RV storage with alley access & electrical hookup attached to a work shop which includes a cellar & electricity. A small storage shed in back yard. Attached double car carport & driveway in front.
Key facts
- Huge pantry
- Alley access
- Step down study
Tags
Neighborhood map
What this means for you Summary
Snapshot
- This is a 3-bed/3.0-bath single-family listed at $210k. Condition is rated fair.
Deal economics
- At list price, monthly cash flow is $-115 ($-1k/yr) — negative.
- To cash-flow at today's rent, offer at most $193k (8.0% below list).
- To meet the 1% rule (rent ≥ 1% of price), the offer needs to be $169k (19.5% below list).
- Recommended offer: $169k (19.5% below list) — sets the bar for 1% rule.
Location & tenants
- Location reads 75/100 on livability (#151 in TX, #4,199 nationally) — a middle-class / working-renter tenant base. Strengths: cost of living A+, housing A+, health & safety A+; Watch: schools C-, amenities F, commute F.
- Andrews ISD (town): math 41% / reading 42% proficiency, ranked #311 of 826 in TX (top 38%) — families likely to look elsewhere, expect single-tenant / working-renter base with shorter leases.
- Market conditions: 1 active listings in the ZIP; 3 comparable units currently listed for rent nearby; rentals lingering (median 44d on market — plan ~5-8 weeks vacancy on turnover, expect pricing pressure); 100% of comp listings sitting > 30 days — soft ceiling on asking rent; 72 units permitted in Andrews County in 2024 (48 in 5+ unit buildings).
Forward outlook
- In year one you build about $8k of equity ($1k loan paydown + $6k appreciation (3.0% local appreciation)).
- Andrews County population projected at +90% by 2050 — long-run rental-demand tailwind backs the buy-and-hold thesis.
- By year 5, paydown + projected appreciation supports a ~$34k cash-out refi (75% LTV) — recoverable capital for the next deal without selling this one.
Negotiation context
- It's been on market 127 days — a 12% lower offer ($185k) is reasonable based on typical stale-listing flexibility.
Risks & watch-outs
- Watch-outs: built in 1959 — expect roof / HVAC / electrical / plumbing capex.
- Climate carrying-cost: severe wildfire risk; extreme-heat days projected 6→17/yr by 2055 (HVAC capex compounding) — expect insurance premiums to compound above CPI over the hold.
Questions for the listing agent
- What do current leases actually rent for vs. the listed asking? Can we see a recent rent roll and the last 12 months of T-12 income?
- It's been on market 127 days. Have you received any prior offers? Is the seller open to a 19% concession, seller financing, or rate buy-down credit?
- Have any recent inspections been done? Can we get a copy of the seller's disclosures and any deferred-maintenance estimates?
- Built in 1959 — when were the roof, HVAC, electrical panel, plumbing, and water heater last replaced?
- Why hasn't it sold? Are there any deal-killer items the seller is aware of (foundation, flood, title, zoning, code violations)?
- Is there a deadline driving the sale (1031 exchange, divorce, estate, relocation)? That informs how much negotiation room exists.
- The area grade is low — what's the realistic commute time and amenity access for the typical tenant pool here? Any planned neighborhood developments (good or bad) we should know about?
- What's the average days-on-market for RENTAL listings here right now (not sales)? A rising rental-DOM trend means longer vacancies and softer asking-rent achievability than the comps imply.
- What's the recent tenant-quality profile in this submarket — average credit score on applications, eviction rate, late-payment / NSF rate, and stable-employment percentage? A property-management company in the area should have these aggregated.
- How much new for-sale + rental construction is in the pipeline within 1–3 miles? Heavy new supply typically softens prices + rents 12–24 months out; constrained supply supports both.
Investment metrics
- 1% rule
- 0.81% ✗
- Cap rate
- 5.63%
- Cash-on-cash
- -2.36%
- DSCR
- 0.90
- GRM
- 10.3
CMA / ARV
- ARV (median comp)
- $211,086
- List price
- $210,000
- Delta
- -0.51%
- Verdict
- FAIR
- Comps
- 3 within 2.0 mi
Projected returns pro-forma
3.0% appreciation · 3.0% rent growth · sell at horizon
- IRR
- 5.3%
- Equity multiple
- 1.31×
- Total profit
- $17,971
- Equity at exit
- $94,425
- IRR
- 8.4%
- Equity multiple
- 2.26×
- Total profit
- $74,346
- Equity at exit
- $145,520
Cash invested: $58,800 (down + closing). Projections, not guarantees.
Landlord ↔ Tenant lean methodology
- Overall (STATE)
- 87 Strongly Landlord-Friendly
- State Texas
- 87 Strongly Landlord-Friendly · R+5
- County
- — inherits STATE
- City
- — inherits STATE
ZIP-level market 74714
- Active inventory
- 1
- Price-to-rent
- 10.3×
Monthly cashflow live
- Estimated rent
- $1,691 medium interval (Pro) →
- Mortgage (P&I)
- −$1,101
- Tax est. 1.5%
- −$262 /mo · $3,150/yr
- Insurance
- −$88
- HOA
- −$0
- Vacancy / Maint / Mgmt
- −$355
- Net cashflow
- $-115
Break-even live
UW: 25.0% down · 7.5% · 30yr · 1.5% tax · 5.0% vac · 8.0% maint · 8.0% mgmt
Financing live
Cash to close
- Down payment
- $52,500
- Closing costs
- $6,300
- Reserves months
- —
- Total cash needed
- —
Loan-product check · same deal, 3 products live
Conventional
25% down · 7.5% · 30yr
- Down + closing
- —
- Monthly P&I
- —
- Monthly cashflow
- —
- DSCR
- —
- Eligible?
- —
Personal DTI + credit; lowest rate.
DSCR
20% down · 8.5% · 30yr
- Down + closing
- —
- Monthly P&I
- —
- Monthly cashflow
- —
- DSCR
- —
- Eligible?
- —
No personal income docs; deal must DSCR.
Hard money
10% down · 12.0% · 12mo
- Down + closing
- —
- Monthly P&I
- —
- Monthly cashflow
- —
- DSCR
- —
- Eligible?
- —
Short-term bridge; refi at stabilization.
Rent comps 3 comps
| Address | Beds | Baths | Sqft | Rent | $/sqft | DOM | Units | Dist |
|---|---|---|---|---|---|---|---|---|
| 400 NW 12th St Andrews, TX | 3.0 | 2.0 | 1152 | $1,450 | $1.26 | 43d | 1 | 0.41mi |
| 601 NW 12th Pl Andrews, TX | 3.0 | 2.0 | 1705 | $1,875 | $1.10 | 43d | 1 | 0.55mi |
| 200 NW Avenue M Andrews, TX | 1.0–3.0 | 1.0–2.0 | 900 | $1,900 | $2.11 | 43d | 12 | 1.47mi |
Listing history 16 events
-
2026-06-19days on market $210,000 Active 127 DOM
-
2026-06-18days on market $210,000 Active 126 DOM
-
2026-06-17days on market $210,000 Active 125 DOM
-
2026-06-16days on market $210,000 Active 124 DOM
-
2026-06-15days on market $210,000 Active 123 DOM
-
2026-06-14days on market $210,000 Active 121 DOM
-
2026-06-12days on market $210,000 Active 120 DOM
-
2026-06-09days on market $210,000 Active 117 DOM
-
2026-06-08days on market $210,000 Active 116 DOM
-
2026-06-07pricedays on market $210,000 Active 115 DOM
-
2026-06-03days on market $214,000 Active 111 DOM
-
2026-06-02days on market $214,000 Active 110 DOM
-
2026-06-01days on market $214,000 Active 109 DOM
-
2026-05-31days on market $214,000 Active 108 DOM
-
2026-05-30days on market $214,000 Active 107 DOM
-
2026-02-12$214,000 Active 523-char remark
Show marketing remark (523 chars)
Unlock the potential of this three bedroom, three bath home! This home is being sold as-is and needs some cosmetic attention. The kitchen has lots of storage, an island, & a huge pantry/laundry room. Spacious living room with custom built in cabinets. Step down study/office/game room/second living room. RV storage with alley access & electrical hookup attached to a work shop which includes a cellar & electricity. A small storage shed in back yard. Attached double car carport & driveway in front.
ⓘ Source: listings_history table (triggers on properties + properties_extension) + one-shot
backfill from property_details.listing_events for pre-trigger history.
Climate risk First Street
- Flood 1/10 Low 0% chance over 30 yrs
- Wildfire 9/10 Extreme
- Heat 5/10 Major 6 d/yr ≥101°F today · 17 d/yr by 30 yrs out
- Wind 2/10 Low 3% chance of damaging wind over 30 yrs
- Air quality 2/10 Low 1 unhealthy d/yr today · 1 by 30 yrs out
Nearby sold comps map
Loading sold comps map…
Walkable amenities ~0.75 mi
Loading nearby amenities…
Taxation est. · year 1
- Rental income
- $20,291
- − Mortgage interest
- −$11,763
- − Property taxes
- −$3,150
- − Insurance
- −$1,050
- − Repairs & maintenance
- −$1,623
- − Management
- −$1,623
- − Depreciation
- −$6,109
- Taxable loss
- −$5,028
- Est. tax savings @ 24.0%
- +$1,207
- After-tax cash flow
- $-179/yr
For passive investors: Depreciation is non-cash, so a rental often shows a tax loss while cash-flowing — sheltering income. Rental losses are passive: they offset passive income freely, and up to $25,000/yr can offset ordinary (W-2) income if you actively participate and your MAGI is under $100k (phasing out to $0 by $150k); unused losses carry forward. On sale, claimed depreciation is recaptured at up to 25%, and gains may owe capital-gains tax (a 1031 exchange can defer both). Figures are a year-1 estimate at your 24.0% rate — not tax advice; consult a CPA.
Condition & rehab AI · 12 photos
This home requires moderate renovations, focusing on painting, updating the kitchen, and landscaping to improve its resale and rental value.
Repairs flagged
- Minor paint — peeling paint in some areas
- Minor kitchen cabinets — wooden cabinets need touch-up
Value-add opportunities
- Resale painting — Fresh paint can make a significant difference in curb appeal
- Resale kitchen cabinets — Updating the cabinets can add value and functionality
- Both landscaping — Landscaping can improve curb appeal and add value
- Both HVAC — Upgrading HVAC can improve comfort and energy efficiency
Renovation cost estimate screening
| Repair item | Severity | Est. cost |
|---|---|---|
| paint · peeling paint in some areas | Minor | $500–3,000 |
| kitchen cabinets · wooden cabinets need touch-up | Minor | $500–3,000 |
| Total estimated repair cost · 2 items | $1,000–6,000 |
Value-add ROI direction
- Resale painting — Fresh paint can make a significant difference in curb appeal ↑
- Resale kitchen cabinets — Updating the cabinets can add value and functionality ↑
- Both landscaping — Landscaping can improve curb appeal and add value ↑
- Both HVAC — Upgrading HVAC can improve comfort and energy efficiency ↑
ⓘ Cost ranges are severity-bucket heuristics (US national rule-of-thumb). Get contractor quotes + a written scope before underwriting a rehab budget.
Schools (NCES district)
- District
- Andrews ISD
- NCES district ID
- 4808280
- Math proficiency
- 41% ▼ -6.00%
- Reading proficiency
- 42% ▲ 2.00%
- Median HH income
- $59,795
- Composite
- 36.68/100
- National rank
- #4606
- State rank
- #311 of 826 in TX
Livability — Andrews
- Score
- 75/100
- State rank
- #151
- US rank
- #4199
Category grades
Schools grade is shown separately in the Schools card above.
Census & demographics
- Census place
- Andrews, TX
Population outlook (Andrews County) Hauer SSP2
- Today (2025)
- 25,215 people
- By 2030
- 29,208 · +15.8%
- By 2040
- 38,047 · +50.9%
- By 2050
- 47,841 · +89.7%
- By 2075
- 74,028 · +193.6%
- By 2100
- 94,141 · +273.4%
Not yet ingested
- Political lean
- —
- Race & ethnicity
- —
- Common origin
- —
- Civics
- —
Market trends
- HPI YoY
- —
- Current HPI
- —
- Rent YoY
- —
- Metro
- —
- State GDP YoY
- ▲ 3.95%
- F500 in state
- 110
Industry mix (Fortune 500 HQ in TX)
| Industry | F500 HQs | Revenue |
|---|---|---|
| Energy | 16 | $1,198B |
|
||
| Technology | 5 | $198B |
|
||
| Engineering / Construction | 4 | $72B |
|
||
| Energy Services | 3 | $60B |
|
||
| Utilities | 3 | $41B |
|
||
| Healthcare | 2 | $330B |
|
||
Price history
1 event — show timeline
- 2026-02-12 Listed $214,000 ODMLS
Cash-flow waterfall
monthlySold comps — $/sqft
last 12 mo · ≤1 miLoading sold comps…