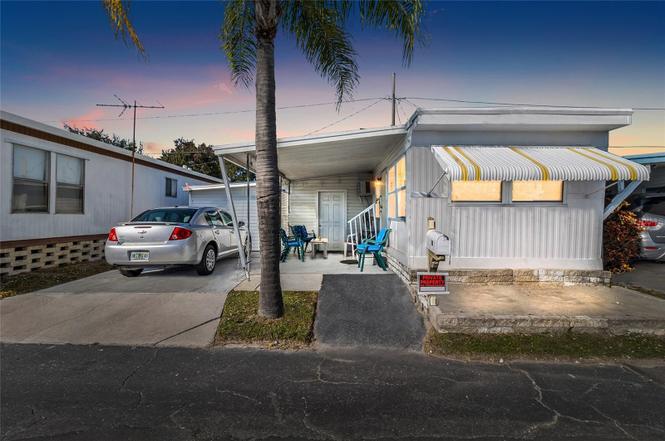
12766 Seminole Blvd #10 · Largo, FL
Flood risk 1/10 · Minimal
- FEMA flood zone
- X (unshaded)
- Chance of flooding over 30 yrs
- 0.0%
- Est. flood insurance / yr
- $507 – $1,088
Fire risk 1/10 · Minimal
- Est. fire insurance / yr
- $947 – $1,759
Heat risk 10/10 · Severe
- Hot days now (above 107°F)
- 7 days/yr
- Hot days in 30 yrs
- 25 days/yr
Wind risk 10/10 · Severe
- Chance of severe wind over 30 yrs
- 99.0%
Air-quality risk 3/10 · Minor
- Unhealthy air days now
- 2 days/yr
- Unhealthy air days in 30 yrs
- 3 days/yr
Risk factors via First Street. Map © Google.
Why this score? — see what drove the B grade
The composite is a weighted blend of 9 inputs, each scored 0–100. Each bar is that input's sub-score; the figure is the points it added to the 100-point composite (weight × sub-score).
- Cash flow +30.0/30.0
- 1% rule +10.0/10.0
- DSCR +10.0/10.0
- ARV discount +7.5/15.0
- Schools +4.3/10.0
- Livability +4.1/5.0
- Rent growth +2.8/5.0
- Condition / age +2.5/5.0
- Appreciation +0.0/10.0
$59,900
🖨 Deal sheet 📄 Offer letter ✓ Due diligence
Listing remarks
Welcome to this clean, well-maintained 2-bedroom, 1 and half-bath home offering exceptional value and comfort in a peaceful 55+ community. This property features a cozy covered front porch—perfect for morning coffee or evening relaxation—and a convenient carport with private driveway parking. Inside, you’ll find a bright and functional kitchen with ample cabinet space, vintage charm, and plenty of natural light. The home offers a comfortable layout, including a spacious bedroom, an additional bonus room, and a large utility/laundry area with extra storage. Recent improvements include updated flooring, fresh interior paint, efficient cooling options, and thoughtful finishes
Key facts
- Covered front porch
- Updated flooring
- Fresh interior paint
Tags
Property features AI
Finance
- Other: Furnished; Total living area about 740 square feet (building area listed as 893); Public records listed living area source
- Financial info: Lease restrictions apply
- HOA & community: Has HOA (monthly fee $143; $1,716 annually); Association approval required; Association name: Gloria Reed; Senior community; Cats allowed
Exterior
- Parking: Carport (1 space)
- Utilities: Public water; Public sewer; Broadband/high-speed internet available; Cable connected; Electricity connected; Water connected; Sewer connected
- Home design: Mobile home (single wide); One level; Faces east; Entry on main level
- Construction: Vinyl siding with frame construction; Membrane roof; Pillar/post/pier foundation; Built as single wide
- Exterior features: Paved lot; Asphalt road; Shed(s)
Interior
- Kitchen: Cooktop; Dishwasher; Disposal; Microwave; Refrigerator; Electric water heater
- Bedrooms: 2 bedrooms
- Flooring: Laminate; Tile
- Bathrooms: 1 full bathroom; 1 half bathroom
- Heating & cooling: Central heating (electric); Central air; Mini-split unit(s)
- Interior features: Ceiling fans; Storage; Shade shutters
- Laundry & utility: Washer; Dryer; Laundry closet
Neighborhood map
What this means for you Summary
Snapshot
- This is a 2-bed/1.0-bath manufactured listed at $60k.
Deal economics
- At list price, monthly cash flow is $833 ($10k/yr) — positive.
- The deal already cash-flows at list — no discount required.
- Meets the 1% rule at list price ($2k rent vs $60k).
- Recommended offer: $53k (12.0% below list) — sets the bar for market timing.
- Cap rate 23.0% vs local median 4.2% in Largo — top-decile yield for the area; either an underpriced asset or a hidden risk that comps aren't pricing in. Stress-test before assuming the spread holds.
Location & tenants
- Location reads 82/100 on livability (#82 in FL, #1,240 nationally) — a professional / high-income tenant draw. Strengths: commute A+, cost of living A+, housing A+; Watch: employment D+, amenities F.
- Pinellas (suburban): math 51% / reading 51% proficiency, ranked #31 of 73 in FL (top 42%) — acceptable for families but not a draw, mixed tenant base, ~2y average lease.
- Market conditions: Rents rising (+1.4%/yr); 139 active listings in the ZIP; 2,676 units permitted in Pinellas County in 2024 (1,422 in 5+ unit buildings).
- This rent runs 31% of the median local income ($65k/yr) — at the standard rent-burdened threshold; future hikes will face affordability resistance.
Forward outlook
- Local home prices are declining (-3.0%/yr); year-one equity from $414 of loan paydown is wiped out by about $2k of value loss. Plan a longer hold.
- Pinellas County population projected at +14% by 2050 — modest demand growth; plan on rents tracking national, not racing it.
- At projected returns (-3.0% appreciation + 1.4% rent growth), your $17k cash investment doubles in ~2 years — after that, you're playing with house money.
Negotiation context
- It's been on market 208 days — a 12% lower offer ($53k) is reasonable based on typical stale-listing flexibility.
- 2 sale attempts; this cycle's ask has dropped $15k (20%) from the opening price — seller is motivated, your offer sets the floor, not the list.
Risks & watch-outs
- Climate carrying-cost: severe wind risk, 99% chance of damaging wind over 30y; extreme-heat days projected 7→25/yr by 2055 (HVAC capex compounding) — expect insurance premiums to compound above CPI over the hold.
Questions for the listing agent
- It's been on market 208 days. Have you received any prior offers? Is the seller open to a 12% concession, seller financing, or rate buy-down credit?
- Built in 1963 — when were the roof, HVAC, electrical panel, plumbing, and water heater last replaced?
- What does the HOA fee cover, when was the last increase, and are there any pending special assessments or reserve-fund shortfalls?
- Why hasn't it sold? Are there any deal-killer items the seller is aware of (foundation, flood, title, zoning, code violations)?
- Is there a deadline driving the sale (1031 exchange, divorce, estate, relocation)? That informs how much negotiation room exists.
- What's the average days-on-market for RENTAL listings here right now (not sales)? A rising rental-DOM trend means longer vacancies and softer asking-rent achievability than the comps imply.
- What's the recent tenant-quality profile in this submarket — average credit score on applications, eviction rate, late-payment / NSF rate, and stable-employment percentage? A property-management company in the area should have these aggregated.
- How much new for-sale + rental construction is in the pipeline within 1–3 miles? Heavy new supply typically softens prices + rents 12–24 months out; constrained supply supports both.
Investment metrics
- 1% rule
- 2.84% ✓
- Cap rate
- 22.99%
- Cash-on-cash
- 59.63%
- DSCR
- 3.65
- GRM
- 2.9
CMA / ARV
No comps found within radius.
Projected returns pro-forma
-3.0% appreciation · 1.38% rent growth · sell at horizon
- IRR
- 56.4%
- Equity multiple
- 3.43×
- Total profit
- $40,733
- Equity at exit
- $8,931
- IRR
- 60.7%
- Equity multiple
- 6.56×
- Total profit
- $93,326
- Equity at exit
- $5,179
Cash invested: $16,772 (down + closing). Projections, not guarantees.
Landlord ↔ Tenant lean methodology
- Overall (STATE)
- 87 Strongly Landlord-Friendly
- State Florida
- 87 Strongly Landlord-Friendly · R+3
- County
- — inherits STATE
- City
- — inherits STATE
ZIP-level market 33778
- Rents YoY
- 1.4%
- Active inventory
- 139
- Price-to-rent
- 2.9×
Monthly cashflow live
- Estimated rent
- $1,702 medium interval (Pro) →
- Mortgage (P&I)
- −$314
- Tax from tax record
- −$29 /mo · $348/yr
- Insurance
- −$25
- HOA
- −$143
- Vacancy / Maint / Mgmt
- −$357
- Net cashflow
- $833
Break-even live
UW: 25.0% down · 7.5% · 30yr · 1.5% tax · 5.0% vac · 8.0% maint · 8.0% mgmt
Financing live
Cash to close
- Down payment
- $14,975
- Closing costs
- $1,797
- Reserves months
- —
- Total cash needed
- —
Loan-product check · same deal, 3 products live
Conventional
25% down · 7.5% · 30yr
- Down + closing
- —
- Monthly P&I
- —
- Monthly cashflow
- —
- DSCR
- —
- Eligible?
- —
Personal DTI + credit; lowest rate.
DSCR
20% down · 8.5% · 30yr
- Down + closing
- —
- Monthly P&I
- —
- Monthly cashflow
- —
- DSCR
- —
- Eligible?
- —
No personal income docs; deal must DSCR.
Hard money
10% down · 12.0% · 12mo
- Down + closing
- —
- Monthly P&I
- —
- Monthly cashflow
- —
- DSCR
- —
- Eligible?
- —
Short-term bridge; refi at stabilization.
HOA detail
- Monthly dues
- $143 · $1,716/yr
Listing history 18 events
-
2026-06-18days on market $59,900 Active 208 DOM
-
2026-06-17days on market $59,900 Active 207 DOM
-
2026-06-16days on market $59,900 Active 206 DOM
-
2026-06-15days on market $59,900 Active 205 DOM
-
2026-06-13days on market $59,900 Active 203 DOM
-
2026-06-09days on market $59,900 Active 199 DOM
-
2026-06-08days on market $59,900 Active 198 DOM
-
2026-06-07days on market $59,900 Active 197 DOM
-
2026-06-04days on market $59,900 Active 194 DOM
-
2026-06-03days on market $59,900 Active 193 DOM
-
2026-06-01days on market $59,900 Active 191 DOM
-
2026-05-31days on market $59,900 Active 190 DOM
-
2026-05-20price $59,900
-
2026-04-16status Active
-
2026-04-14historical
-
2026-02-22price $64,900
-
2025-12-17price $69,900
-
2025-11-20$75,000 Active
ⓘ Source: listings_history table (triggers on properties + properties_extension) + one-shot
backfill from property_details.listing_events for pre-trigger history.
Tax reassessment forecast FL · Resets to sale price
- Current annual tax
- $348 · $29/mo
- Projected year-2 tax
- $497 · $41/mo
- Expected delta
- +$149/yr (+$12/mo · 42.7%)
ⓘ Screening estimate from a state-policy table — verify with the county assessor before closing.
Climate risk First Street
- Flood 1/10 Low FEMA zone X (unshaded) · 0% chance over 30 yrs
- Wildfire 1/10 Low
- Heat 10/10 Extreme 7 d/yr ≥107°F today · 25 d/yr by 30 yrs out
- Wind 10/10 Extreme 99% chance of damaging wind over 30 yrs
- Air quality 3/10 Moderate 2 unhealthy d/yr today · 3 by 30 yrs out
Nearby sold comps map
Loading sold comps map…
Walkable amenities ~0.75 mi
Loading nearby amenities…
Taxation est. · year 1
- Rental income
- $20,424
- − Mortgage interest
- −$3,355
- − Property taxes
- −$348
- − Insurance
- −$300
- − Repairs & maintenance
- −$1,634
- − Management
- −$1,634
- − HOA
- −$1,716
- − Depreciation
- −$1,743
- Taxable income
- $9,694
- Est. tax owed @ 24.0%
- −$2,327
- After-tax cash flow
- $7,675/yr
For passive investors: Depreciation is non-cash, so a rental often shows a tax loss while cash-flowing — sheltering income. Rental losses are passive: they offset passive income freely, and up to $25,000/yr can offset ordinary (W-2) income if you actively participate and your MAGI is under $100k (phasing out to $0 by $150k); unused losses carry forward. On sale, claimed depreciation is recaptured at up to 25%, and gains may owe capital-gains tax (a 1031 exchange can defer both). Figures are a year-1 estimate at your 24.0% rate — not tax advice; consult a CPA.
Schools (NCES district)
- District
- Pinellas
- NCES district ID
- 1201560
- Math proficiency
- 51% ▼ -5.00%
- Reading proficiency
- 51% ▼ -3.00%
- Median HH income
- $46,270
- Composite
- 43.27/100
- National rank
- #3046
- State rank
- #31 of 73 in FL
Livability — Largo
- Score
- 82/100
- State rank
- #82
- US rank
- #1240
Category grades
Schools grade is shown separately in the Schools card above.
Census & demographics
- Census place
- Largo, FL
- County
- Pinellas County · 939,478 people
- City population
- 106,311
- Metro
- Tampa-St. Petersburg-Clearwater, FL
- Population (ZIP)
- 16,807
- Household income
- $65,355
- Rent vs Own
- Severe rent burden
- 261.0
Population outlook (Pinellas County) Hauer SSP2
- Today (2025)
- 1,027,532 people
- By 2030
- 1,063,586 · +3.5%
- By 2040
- 1,125,020 · +9.5%
- By 2050
- 1,168,637 · +13.7%
- By 2075
- 1,265,188 · +23.1%
- By 2100
- 1,260,357 · +22.7%
Race, ethnicity, and origin ACS 2023
- Neighborhood character
- Predominantly White (72%)
- Race & ethnicity
- White 72% Hispanic / Latino 15% Two or more races 11% Black 9% Asian 2%
- Hispanic origin (detail)
- Puerto Rican 3% Cuban 6%
- Common ancestry
- Romanian 3% Italian 3% Lithuanian 3%
- Foreign-born
- 13% · Canada, Vietnam, Jamaica
- Languages at home
- 85% English-only · Spanish 10% Vietnamese 1% French/Haitian/Cajun 1%
Political lean MEDSL · Pinellas
- 2024 margin
- Lean R (+5.2) · D 46.9% · R 52.1%
- 2008→2024 swing
- -13.5pp toward R · 2008: 8.3pp · 2024: -5.2pp
- All cycles
- 2024: R+5.2 2020: D+0.2 2016: R+1.1 2012: D+5.6 2008: D+8.3
Not yet ingested
- Civics
- —
Market trends
- HPI YoY
- ▼ -320.64%
- Current HPI
- 369.3008
- Rent YoY
- ▲ 1.38%
- Metro
- Tampa-St. Petersburg-Clearwater, FL
- State GDP YoY
- ▲ 3.28%
- F500 in state
- 36
Industry mix (Fortune 500 HQ in FL)
| Industry | F500 HQs | Revenue |
|---|---|---|
| Industrial Technology | 2 | $29B |
|
||
| Insurance | 2 | $17B |
|
||
| Retail | 1 | $60B |
|
||
| Technology Distribution | 1 | $58B |
|
||
| Homebuilding | 1 | $35B |
|
||
| Technology Manufacturing | 1 | $35B |
|
||
Price history
-20.1% since first listed6 events — show timeline
- 2026-05-20 Price Changed $59,900 Stellar MLS as Distributed by MLS Grid
- 2026-04-16 Relisted — Stellar MLS as Distributed by MLS Grid
- 2026-04-14 Listing Removed — Stellar MLS as Distributed by MLS Grid
- 2026-02-22 Price Changed $64,900 Stellar MLS as Distributed by MLS Grid
- 2025-12-17 Price Changed $69,900 Stellar MLS as Distributed by MLS Grid
- 2025-11-20 Listed $75,000 Stellar MLS as Distributed by MLS Grid
Property tax history
+0.4%/yrLatest (2025): $348 · +66.3% YoY. Source: county tax records.
Cash-flow waterfall
monthlySold comps — $/sqft
last 12 mo · ≤1 miLoading sold comps…