2637 Lantern Ln Unit A · South Fulton, GA
Flood risk 1/10 · Minimal
- FEMA flood zone
- X (unshaded)
- Chance of flooding over 30 yrs
- 0.0%
- Est. flood insurance / yr
- $507 – $1,088
Fire risk 3/10 · Minor
- Est. fire insurance / yr
- $963 – $1,789
Heat risk 6/10 · Moderate
- Hot days now (above 105°F)
- 7 days/yr
- Hot days in 30 yrs
- 18 days/yr
Wind risk 6/10 · Moderate
- Chance of severe wind over 30 yrs
- 27.0%
Air-quality risk 4/10 · Minor
- Unhealthy air days now
- 4 days/yr
- Unhealthy air days in 30 yrs
- 6 days/yr
Risk factors via First Street. Map © Google.
Why this score? — see what drove the D+ grade
The composite is a weighted blend of 9 inputs, each scored 0–100. Each bar is that input's sub-score; the figure is the points it added to the 100-point composite (weight × sub-score).
- Cash flow +15.1/30.0
- Appreciation +10.0/10.0
- DSCR +4.6/10.0
- Schools +4.5/10.0
- 1% rule +4.2/10.0
- Rent growth +2.7/5.0
- Livability +2.5/5.0
- Condition / age +2.5/5.0
- ARV discount +0.0/15.0
$180,000
🖨 Deal sheet 📄 Offer letter ✓ Due diligence
Listing remarks MLS
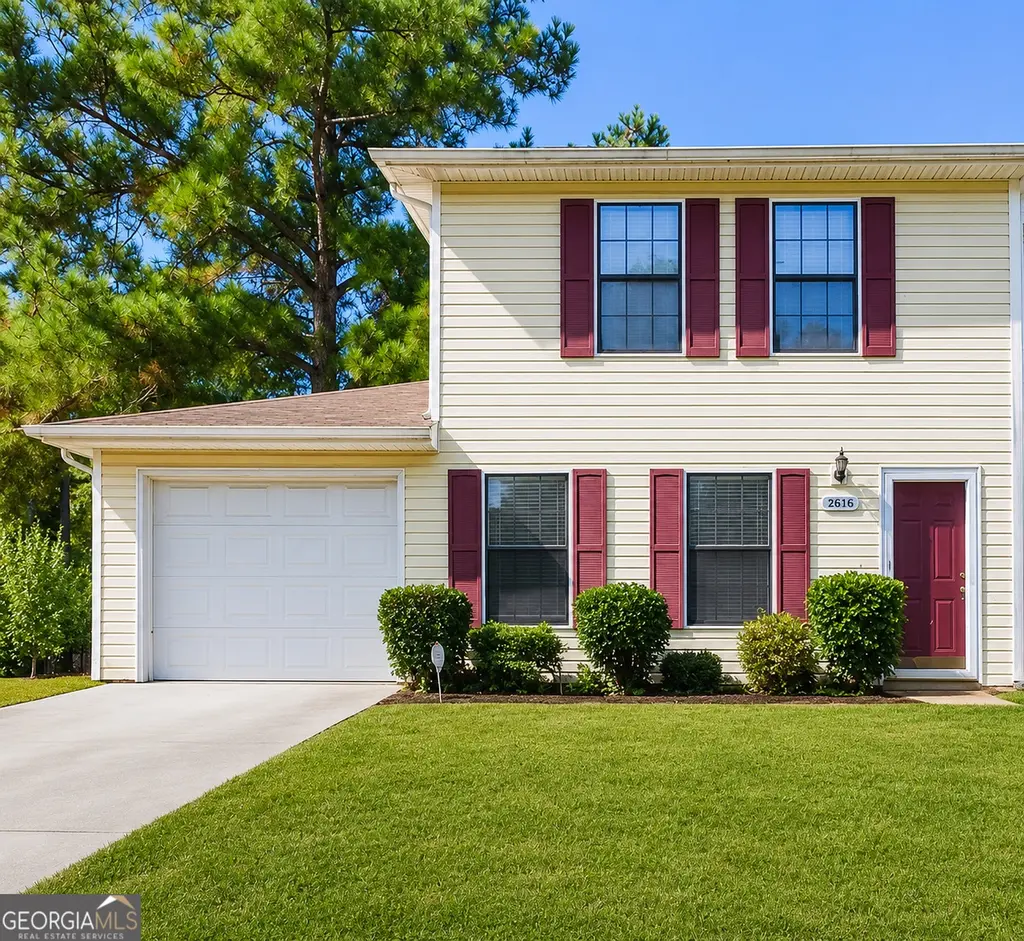
Welcome home to this beautifully maintained 2-bedroom, 2.5-bath roommate-style townhome in the heart of South Fulton! Thoughtfully designed for comfort and privacy, this spacious home features two generously sized bedrooms, each with its own private full bath, making it ideal for roommates, guests, or a home office setup. The open-concept living and dining area provides a warm and inviting space for entertaining or relaxing, while the functional kitchen offers ample cabinet storage and everyday convenience. Enjoy low-maintenance living in a convenient location just minutes from shopping, dining, major interstates, and Hartsfield-Jackson Atlanta International Airport. Whether you're a first-time homebuyer, downsizing, or looking to expand your investment portfolio, this home is a fantastic opportunity. Seller is offering $5,000 toward buyer repairs, adding even more value. Don't miss your chance to make this South Fulton gem your own!
Key facts
- Garage
- Built 1986
- Listed 9 days
Property features AI
Finance
- Financial info: Property is a single unit in the community (1 unit)
Exterior
- Parking: Driveway; Detached garage that faces front (1 garage space); Total parking for 1 vehicle; Open parking available
- Utilities: Public water; Public sewer; Electricity available; Natural gas available; Cable available; Phone available; Water available
- Home design: Two levels; Resale property; Vinyl siding; Shingle roof; Brick/mortar and combination foundation; Ownership: Other
- Construction: Vinyl siding construction; Shingle roof; Brick/mortar and combination foundation
- Exterior features: Paved road access
Interior
- Kitchen: Eat-in kitchen; Laminate countertops; Pantry; Dishwasher; Gas range; Microwave; Range hood; Refrigerator
- Bedrooms: Two main-level bedrooms; Roommate floor plan
- Flooring: Carpet; Laminate; Tile
- Bathrooms: Two full bathrooms; One half bathroom; Master bathroom with tub/shower combo
- Heating & cooling: Central heating; Central air; Ceiling fans
- Interior features: 1 common wall (townhome/attached); Other interior features; Open concept dining area; Attic
- Laundry & utility: Washer and dryer included; Laundry located on main level, in hall, and lower level (multiple hookups/locations)
Neighborhood map
What this means for you Summary
Snapshot
- This is a 2-bed/2.5-bath townhouse listed at $180k.
Deal economics
- At list price, monthly cash flow is $59 ($708/yr) — positive.
- The deal already cash-flows at list — no discount required.
- To meet the 1% rule (rent ≥ 1% of price), the offer needs to be $165k (8.1% below list).
- Recommended offer: $165k (8.1% below list) — sets the bar for 1% rule.
- Cap rate 6.7% vs local median 4.6% in South Fulton — top-decile yield for the area; either an underpriced asset or a hidden risk that comps aren't pricing in. Stress-test before assuming the spread holds.
Location & tenants
- Location reads: area grade D — affects rentability + tenant quality, not the cash-flow math above.
- Fulton County (suburban): math 49% / reading 53% proficiency, ranked #12 of 174 in GA (top 7%) — acceptable for families but not a draw, mixed tenant base, ~2y average lease.
- Market conditions: Rents flat; 651 active listings in the ZIP; 40 comparable units currently listed for rent nearby; rentals at typical pace (median 24d on market — plan ~3-4 weeks tenant-placement turnaround); 45% of comp listings sitting > 30 days — soft ceiling on asking rent; 11,565 units permitted in Fulton County in 2024 (8,159 in 5+ unit buildings).
Forward outlook
- In year one you build about $19k of equity ($1k loan paydown + $18k appreciation (10.0% local appreciation)).
- Fulton County population projected at +38% by 2050 — long-run rental-demand tailwind backs the buy-and-hold thesis.
- At projected returns (10.0% appreciation + 0.9% rent growth), your $50k cash investment doubles in ~3 years — after that, you're playing with house money.
- By year 2, paydown + projected appreciation supports a ~$31k cash-out refi (75% LTV) — recoverable capital for the next deal without selling this one.
Negotiation context
- Only 9 days on market — expect competitive offers; lowballing is unlikely to land.
- 2 sale attempts since 4y ago; this cycle's ask is 9% above the opening price — seller raised mid-cycle; expect resistance to lowballs.
- Current owner paid $150k; 20% above their basis — modest negotiation headroom, anchor on the comps not their cost.
Risks & watch-outs
- Climate carrying-cost: major wind risk, 27% chance of damaging wind over 30y; extreme-heat days projected 7→18/yr by 2055 (HVAC capex compounding) — expect insurance premiums to compound above CPI over the hold.
Questions for the listing agent
- Is there a deadline driving the sale (1031 exchange, divorce, estate, relocation)? That informs how much negotiation room exists.
- The area grade is low — what's the realistic commute time and amenity access for the typical tenant pool here? Any planned neighborhood developments (good or bad) we should know about?
- What's the average days-on-market for RENTAL listings here right now (not sales)? A rising rental-DOM trend means longer vacancies and softer asking-rent achievability than the comps imply.
- What's the recent tenant-quality profile in this submarket — average credit score on applications, eviction rate, late-payment / NSF rate, and stable-employment percentage? A property-management company in the area should have these aggregated.
- How much new for-sale + rental construction is in the pipeline within 1–3 miles? Heavy new supply typically softens prices + rents 12–24 months out; constrained supply supports both.
Investment metrics
- 1% rule
- 0.92% ✗
- Cap rate
- 6.69%
- Cash-on-cash
- 1.41%
- DSCR
- 1.06
- GRM
- 9.1
CMA / ARV
- ARV (on-the-fly)
- $125,440
- Comps found
- 7
Show comp detail 7 sales within ~0.75 mi
| Address | Dist | Beds/Ba | Sqft | Sold | Price | $/sf | Match |
|---|---|---|---|---|---|---|---|
| 5680 Hampton Ct | 0.15mi | 2/2.5 | 1,296 (+1%) | 12mo | $200,000 | $154 | 81 |
| 2560 Picardy Cir N Unit A | 0.05mi | 3/2.5 (+1) | 1,426 (+11%) | 3mo | $140,000 | $98 | 72 |
| 1310 Camelot Dr #1310 | 0.31mi | 3/2.0 (+1) | 1,282 (+0%) | 12mo | $45,500 | $35 | 68 |
| 5485 Hampton Ct | 0.24mi | 2/2.5 | 1,196 (-7%) | 17mo | $180,000 | $151 | 64 |
| 1016 Camelot Dr | 0.36mi | 3/2.0 (+1) | 1,449 (+13%) | 6mo | $13,000 | $9 | 49 |
| 2555 Flat Shoals Rd #1405 | 0.50mi | 2/2.5 | 1,430 (+12%) | 12mo | $219,000 | $153 | 47 |
| 1014 Camelot Dr | 0.36mi | 3/2.0 (+1) | 1,449 (+13%) | 22mo | $70,000 | $48 | 36 |
Match score weights: distance 35% · size 25% · config 20% · recency 20%. Top-matched comps best support the ARV.
Projected returns pro-forma
10.0% appreciation · 0.95% rent growth · sell at horizon
- IRR
- 24.6%
- Equity multiple
- 2.95×
- Total profit
- $98,477
- Equity at exit
- $162,158
- IRR
- 21.2%
- Equity multiple
- 6.57×
- Total profit
- $280,866
- Equity at exit
- $349,700
Cash invested: $50,400 (down + closing). Projections, not guarantees.
Landlord ↔ Tenant lean methodology
- Overall (STATE)
- 90 Strongly Landlord-Friendly
- State Georgia
- 90 Strongly Landlord-Friendly · R+3
- County
- — inherits STATE
- City
- — inherits STATE
ZIP-level market 30349
- Home prices YoY
- 4.6%
- Rents YoY
- 0.9%
- Active inventory
- 651
- Price-to-rent
- 9.1×
Monthly cashflow live
- Estimated rent
- $1,654 high interval (Pro) →
- Mortgage (P&I)
- −$944
- Tax from tax record
- −$228 /mo · $2,741/yr
- Insurance
- −$75
- HOA
- −$0
- Vacancy / Maint / Mgmt
- −$347
- Net cashflow
- $59
Break-even live
UW: 25.0% down · 7.5% · 30yr · 1.5% tax · 5.0% vac · 8.0% maint · 8.0% mgmt
Financing live
Cash to close
- Down payment
- $45,000
- Closing costs
- $5,400
- Reserves months
- —
- Total cash needed
- —
Loan-product check · same deal, 3 products live
Conventional
25% down · 7.5% · 30yr
- Down + closing
- —
- Monthly P&I
- —
- Monthly cashflow
- —
- DSCR
- —
- Eligible?
- —
Personal DTI + credit; lowest rate.
DSCR
20% down · 8.5% · 30yr
- Down + closing
- —
- Monthly P&I
- —
- Monthly cashflow
- —
- DSCR
- —
- Eligible?
- —
No personal income docs; deal must DSCR.
Hard money
10% down · 12.0% · 12mo
- Down + closing
- —
- Monthly P&I
- —
- Monthly cashflow
- —
- DSCR
- —
- Eligible?
- —
Short-term bridge; refi at stabilization.
Rent comps 40 comps
| Address | Beds | Baths | Sqft | Rent | $/sqft | DOM | Units | Dist |
|---|---|---|---|---|---|---|---|---|
| 5690 Hampton Ct Atlanta, GA | 2.0 | 3.0 | 1184 | $1,495 | $1.26 | 43d | 1 | 0.14mi |
| 5460 Hampton Ct Atlanta, GA | 2.0 | 3.5 | 1554 | $1,500 | $0.97 | 43d | 1 | 0.22mi |
| 2565 Lantern Ln Atlanta, GA | 1.0 | 1.0 | 1522 | $634 | $0.42 | 1d | 1 | 0.29mi |
| 6056 Carriage Ct Atlanta, GA | 3.0 | 2.0 | 1400 | $1,599 | $1.14 | 5d | 1 | 0.44mi |
| 2555 Flat Shoals Rd #3005 Atlanta, GA | 3.0 | 2.5 | 1724 | $1,850 | $1.07 | 5d | 1 | 0.47mi |
| 2555 Flat Shoals Rd #404 College Park, GA | 3.0 | 2.5 | 1408 | $1,700 | $1.21 | 24d | 1 | 0.47mi |
| 2500 Pleasant Hill Rd Atlanta, GA | 2.0–3.0 | 1.5–2.5 | 1405 | $1,149 | $0.82 | 24d | 2 | 0.50mi |
| 5410 Twin Lakes Dr Atlanta, GA | 3.0 | 2.0 | 1277 | $2,040 | $1.60 | 43d | 1 | 0.50mi |
| 2555 Flat Shoals Rd #401 Atlanta, GA | 3.0 | 2.5 | 1550 | $2,050 | $1.32 | 43d | 1 | 0.54mi |
| 5645 Deerfield Trl Atlanta, GA | 3.0 | 1.5 | 1496 | $1,495 | $1.00 | 22d | 1 | 0.57mi |
| 5625 Montilly Cir Atlanta, GA | 1.0 | 1.0 | 1000 | $1,350 | $1.35 | 43d | 1 | 0.72mi |
| 2890 Jerome Rd Atlanta, GA | 3.0 | 1.5 | 1229 | $1,761 | $1.43 | 43d | 1 | 0.73mi |
| 6090 Emerald Pointe Cir Atlanta, GA | 3.0 | 2.0 | 1200 | $1,875 | $1.56 | 18d | 1 | 0.75mi |
| 320 Emerald Green Ct Atlanta, GA | 3.0 | 2.0 | 1575 | $2,050 | $1.30 | 43d | 1 | 0.76mi |
| 6230 Cedar Wood Dr Atlanta, GA | 3.0 | 2.0 | 1238 | $1,694 | $1.37 | 43d | 1 | 0.80mi |
| 5370 Longmeadow Ln Atlanta, GA | 3.0 | 2.0 | 1248 | $1,600 | $1.28 | 16d | 1 | 0.85mi |
| 6027 Oak Bend Ct Riverdale, GA | 3.0 | 2.5 | 1530 | $2,070 | $1.35 | 5d | 1 | 0.86mi |
| 5515 Scofield Rd Atlanta, GA | 3.0 | 2.0 | 1109 | $1,788 | $1.61 | 10d | 1 | 0.86mi |
| 2300 Flat Shoals Rd Unit 2 Riverdale, GA | 2.0 | 3.0 | 1000 | $1,425 | $1.43 | 24d | 1 | 0.87mi |
| 6560 Emerald Pointe Cir Atlanta, GA | 3.0 | 2.0 | 1309 | $1,500 | $1.15 | 22d | 1 | 0.88mi |
| 6048 Oak Bend Ct Riverdale, GA | 3.0 | 2.5 | 1500 | $1,750 | $1.17 | 22d | 1 | 0.92mi |
| 6278 Rockaway Rd Atlanta, GA | 3.0 | 2.5 | 1524 | $2,000 | $1.31 | 43d | 1 | 0.97mi |
| 855 Old Rocky Rd Atlanta, GA | 3.0 | 2.0 | 1310 | $1,710 | $1.31 | 24d | 1 | 0.98mi |
| 6078 Oak Bend Ct Riverdale, GA | 3.0 | 2.5 | 1622 | $1,800 | $1.11 | 24d | 1 | 0.98mi |
| 395 Fox Trail Dr Atlanta, GA | 3.0 | 2.0 | 1400 | $1,980 | $1.41 | 11d | 1 | 0.99mi |
| 5442 Scofield Rd Atlanta, GA | 3.0 | 1.5 | 1368 | $1,775 | $1.30 | 43d | 1 | 1.03mi |
| 2710 Dunmoreland Ter Atlanta, GA | 3.0 | 1.0 | 1198 | $1,540 | $1.29 | 43d | 1 | 1.05mi |
| 5866 Summerglen Ln Atlanta, GA | 3.0 | 2.0 | 1400 | $1,450 | $1.04 | 43d | 1 | 1.08mi |
| 5730 N Castlegate Dr Unit A Atlanta, GA | 2.0 | 2.5 | 1125 | $1,395 | $1.24 | 43d | 1 | 1.09mi |
| 2592 Rocky Ct Atlanta, GA | 2.0 | 2.5 | 1424 | $2,000 | $1.40 | 43d | 1 | 1.09mi |
| 2667 Rocky Ct Atlanta, GA | 3.0 | 2.5 | 1432 | $2,200 | $1.54 | 43d | 1 | 1.11mi |
| 5750 Buffington Rd Atlanta, GA | 1.0–3.0 | 1.0–2.0 | 1142 | $1,458 | $1.28 | 1d | 19 | 1.14mi |
| 2036 Laboon Cir Unit C Atlanta, GA | 1.0 | 1.0 | 1000 | $1,100 | $1.10 | 5d | 1 | 1.15mi |
| 3105 Garnet Way Atlanta, GA | 3.0 | 2.0 | 1470 | $1,660 | $1.13 | 12d | 1 | 1.16mi |
| 5380 Sand Bar Ln Atlanta, GA | 3.0 | 2.0 | 1361 | $1,961 | $1.44 | 3d | 1 | 1.16mi |
| 5867 Sheldon Ct Atlanta, GA | 1.0 | 1.0 | 1244 | $825 | $0.66 | 44d | 1 | 1.16mi |
| 6345 Peppermill Ln Atlanta, GA | 3.0 | 2.5 | 1224 | $1,800 | $1.47 | 43d | 1 | 1.22mi |
| 6165 Radford Dr Riverdale, GA | 3.0 | 2.0 | 1232 | $1,750 | $1.42 | 22d | 1 | 1.24mi |
| 6165 Radford Dr Riverdale, GA | 3.0 | 2.0 | 1232 | $1,799 | $1.46 | 43d | 1 | 1.24mi |
| 6165 Radford Dr Riverdale, GA | 3.0 | 2.0 | 1232 | $1,695 | $1.38 | 5d | 1 | 1.24mi |
Listing history 10 events
-
2026-06-18days on market $180,000 Active 9 DOM
-
2026-06-17days on market $180,000 Active 8 DOM
-
2026-06-16days on market $180,000 Active 7 DOM
-
2026-06-15days on market $180,000 Active 6 DOM
-
2026-06-13days on market $180,000 Active 4 DOM
-
2026-06-10statusdays on market $180,000 Active 1 DOM
-
2026-06-09days on market $180,000 Coming Soon 5 DOM
-
2026-06-08days on market $180,000 Coming Soon 4 DOM
-
2026-06-07remarks 699-char remark
-
2026-06-07$180,000 Coming Soon 3 DOM
ⓘ Source: listings_history table (triggers on properties + properties_extension) + one-shot
backfill from property_details.listing_events for pre-trigger history.
Tax reassessment forecast GA · Resets to sale price
- Current annual tax
- $2,741 · $228/mo
- Projected year-2 tax
- $2,741 · $228/mo
- Expected delta
- $0/yr ($0/mo · 0.0%)
ⓘ Screening estimate from a state-policy table — verify with the county assessor before closing.
Climate risk First Street
- Flood 1/10 Low FEMA zone X (unshaded) · 0% chance over 30 yrs
- Wildfire 3/10 Moderate
- Heat 6/10 Major 7 d/yr ≥105°F today · 18 d/yr by 30 yrs out
- Wind 6/10 Major 27% chance of damaging wind over 30 yrs
- Air quality 4/10 Moderate 4 unhealthy d/yr today · 6 by 30 yrs out
Nearby sold comps map
Loading sold comps map…
Walkable amenities ~0.75 mi
Loading nearby amenities…
Taxation est. · year 1
- Rental income
- $19,844
- − Mortgage interest
- −$10,083
- − Property taxes
- −$2,741
- − Insurance
- −$900
- − Repairs & maintenance
- −$1,588
- − Management
- −$1,588
- − Depreciation
- −$5,236
- Taxable loss
- −$2,291
- Est. tax savings @ 24.0%
- +$550
- After-tax cash flow
- $1,258/yr
For passive investors: Depreciation is non-cash, so a rental often shows a tax loss while cash-flowing — sheltering income. Rental losses are passive: they offset passive income freely, and up to $25,000/yr can offset ordinary (W-2) income if you actively participate and your MAGI is under $100k (phasing out to $0 by $150k); unused losses carry forward. On sale, claimed depreciation is recaptured at up to 25%, and gains may owe capital-gains tax (a 1031 exchange can defer both). Figures are a year-1 estimate at your 24.0% rate — not tax advice; consult a CPA.
Schools (NCES district)
- District
- Fulton County
- NCES district ID
- 1302280
- Math proficiency
- 49% ▼ -2.00%
- Reading proficiency
- 53% ▬ 0.00%
- Median HH income
- $68,035
- Composite
- 45.33/100
- National rank
- #2640
- State rank
- #12 of 174 in GA
Livability — South Fulton
No livability data for this city. (Only ~50 U.S. cities are tracked.)
Census & demographics
- Census place
- South Fulton, GA
- County
- Fulton County · 1,094,430 people
- City population
- 127,674
- Metro
- Atlanta-Sandy Springs-Alpharetta, GA
- Population (ZIP)
- 79,872
- Household income
- $67,023
- Rent vs Own
- Severe rent burden
- 4258.0
Population outlook (Fulton County) Hauer SSP2
- Today (2025)
- 1,203,707 people
- By 2030
- 1,299,706 · +8.0%
- By 2040
- 1,488,256 · +23.6%
- By 2050
- 1,664,580 · +38.3%
- By 2075
- 2,036,072 · +69.2%
- By 2100
- 2,222,402 · +84.6%
Race, ethnicity, and origin ACS 2023
- Neighborhood character
- Predominantly Black (89%)
- Race & ethnicity
- Black 89% Hispanic / Latino 5% Two or more races 4% White 3%
- Foreign-born
- 9% · Canada
- Languages at home
- 88% English-only · Spanish 6% French/Haitian/Cajun 1%
Political lean MEDSL · Fulton
- 2024 margin
- Solid D (+44.9) · D 71.9% · R 27.0% · Other 1.1%
- 2008→2024 swing
- +9.8pp toward D · 2008: 35.0pp · 2024: 44.9pp
- All cycles
- 2024: D+44.9 2020: D+46.4 2016: D+42.1 2012: D+29.6 2008: D+35.0
Not yet ingested
- Civics
- —
Market trends
- HPI YoY
- ▲ 18.01%
- Current HPI
- 407.99
- Rent YoY
- ▲ 0.95%
- Metro
- Atlanta-Sandy Springs-Alpharetta, GA
- State GDP YoY
- ▲ 2.66%
- F500 in state
- 28
Industry mix (Fortune 500 HQ in GA)
| Industry | F500 HQs | Revenue |
|---|---|---|
| Paper / Packaging | 2 | $29B |
|
||
| Retail | 1 | $160B |
|
||
| Transportation / Logistics | 1 | $91B |
|
||
| Airlines | 1 | $62B |
|
||
| Consumer Goods | 1 | $47B |
|
||
| Utilities | 1 | $25B |
|
||
Price history
+233.3% since first listed11 events — show timeline
- 2026-06-04 Coming Soon $180,000 GAMLS
- 2026-06-04 Coming Soon $180,000 FMLS
- 2022-03-23 Sold (Public Records) $150,000 Public Records
- 2022-03-17 Sold (MLS) $150,000 GAMLS
- 2022-03-17 Sold (MLS) $150,000 FMLS
- 2022-02-03 Pending — GAMLS
- 2022-02-03 Pending — FMLS
- 2022-01-25 Listed $165,000 GAMLS
- 2022-01-25 Listed $165,000 FMLS
- 2021-08-16 Sold (Public Records) $141,300 Public Records
- 2003-03-19 Sold (Public Records) $54,000 Public Records
Property tax history
+6.2%/yrLatest (2025): $2,741 · +3.7% YoY. Source: county tax records.
Cash-flow waterfall
monthlySold comps — $/sqft
last 12 mo · ≤1 miLoading sold comps…