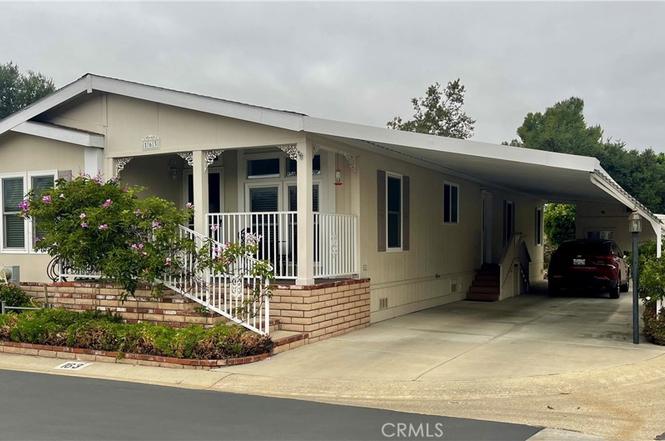
1245 W Cienega #163 · San Dimas, CA
Flood risk 1/10 · Minimal
- FEMA flood zone
- X (unshaded)
- Chance of flooding over 30 yrs
- 0.0%
- Est. flood insurance / yr
- $507 – $1,088
Fire risk 7/10 · Major
- Est. fire insurance / yr
- $659 – $1,223
Heat risk 7/10 · Major
- Hot days now (above 99°F)
- 7 days/yr
- Hot days in 30 yrs
- 20 days/yr
Wind risk 1/10 · Minimal
- Chance of severe wind over 30 yrs
- —
Air-quality risk 8/10 · Major
- Unhealthy air days now
- 17 days/yr
- Unhealthy air days in 30 yrs
- 21 days/yr
Risk factors via First Street. Map © Google.
Why this score? — see what drove the B- grade
The composite is a weighted blend of 9 inputs, each scored 0–100. Each bar is that input's sub-score; the figure is the points it added to the 100-point composite (weight × sub-score).
- Cash flow +28.5/30.0
- DSCR +10.0/10.0
- ARV discount +9.6/15.0
- 1% rule +6.8/10.0
- Schools +5.9/10.0
- Livability +3.6/5.0
- Condition / age +2.5/5.0
- Rent growth +2.3/5.0
- Appreciation +0.0/10.0
$265,000
🖨 Deal sheet 📄 Offer letter ✓ Due diligence
Listing remarks
WELCOME to this beautiful spacious home with 2 bedrooms/2 baths. Built in 2005 and has been well maintained. It is located in the highly sought after ALL AGE community of Cienega Valley Estates. This home offers high and coffered ceilings, a large kitchen with a butcher block island, formal dining area, spacious living room, and a large laundry room. The primary bedroom is large enough to accommodate a king size bed and it also has a large walk-in closet plenty of shelving for storage. The other bedroom is of ample size and able to accommodate a queen size bed. The bonus room can easily be transformed to meet your needs, whether you need a dedicated home office, or a cozy guest room. It als
Key facts
- Landscaped backyard
- Walk-in closet
- Indoor jacuzzi
Tags
Property features AI
Finance
- Other: Rent includes pool; Manager approval may be required for occupancy; Pets allowed
- Financial info: Land lease (monthly) — park-managed
- HOA & community: Part of association; Association amenities include: pool, spa, sauna, clubhouse, meeting/card rooms, billiard room, gym/exercise room, controlled access, security, common RV parking, other courts; pets permitted
Exterior
- Parking: Attached carport with 3 spaces; Park name: Cienega Valley Estates
- Security: Gated community; Controlled access; Resident manager
- Utilities: Public sewer; District/public water; Natural gas connected; Electricity connected; Telephone available in street; Cable available; Sewer connected; Water connected
- Home design: Mobile/double-wide model 4603M (28' x 60') — mobile home remains; Turnkey condition; Single-story
- Construction: Year built per public records
- Exterior features: Covered front porch; Patio; Community pool; Shed (1)
Interior
- Kitchen: Garbage disposal; Microwave; Free-standing range / Gas range; Dishwasher
- Bedrooms: All bedrooms on main level; Primary suite; Walk-in closet
- Flooring: Carpet; Laminate
- Bathrooms: One full bath; One 3/4 bath; Bathtub and separate shower; shower-in-tub
- Heating & cooling: Forced air heating; Central cooling
- Interior features: High ceilings (9+ feet); Pantry; Storage space; Coffered ceilings; One-level entry (front door); Gated community with resident manager; Community spa
- Laundry & utility: Washer included; Dryer included; Laundry room
Neighborhood map
What this means for you Summary
Snapshot
- This is a 2-bed/2.0-bath manufactured listed at $265k.
Deal economics
- At list price, monthly cash flow is $869 ($10k/yr) — positive.
- The deal already cash-flows at list — no discount required.
- Meets the 1% rule at list price ($3k rent vs $265k).
- Cap rate 10.2% vs local median 2.6% in San Dimas — top-decile yield for the area; either an underpriced asset or a hidden risk that comps aren't pricing in. Stress-test before assuming the spread holds.
Location & tenants
- Location reads 72/100 on livability (#192 in CA) — a middle-class / working-renter tenant base. Strengths: employment A+, commute A, schools B; Watch: cost of living F, health & safety F.
- Bonita Unified (suburban): math 59% / reading 70% proficiency, ranked #151 of 1,400 in CA (top 11%) — acceptable for families but not a draw, mixed tenant base, ~2y average lease.
- Market conditions: Rents soft (-1.0%/yr); 85 active listings in the ZIP; 16 comparable units currently listed for rent nearby; rentals at typical pace (median 25d on market — plan ~3-4 weeks tenant-placement turnaround); solid renter incomes; 19,697 units permitted in Los Angeles County in 2024 (9,426 in 5+ unit buildings).
- This rent runs 36% of the median local income ($105k/yr) — at the standard rent-burdened threshold; future hikes will face affordability resistance.
Forward outlook
- Local home prices are declining (-3.0%/yr); year-one equity from $2k of loan paydown is wiped out by about $8k of value loss. Plan a longer hold.
- Los Angeles County population projected at +9% by 2050 — modest demand growth; plan on rents tracking national, not racing it.
Negotiation context
- Only 1 days on market — expect competitive offers; lowballing is unlikely to land.
Risks & watch-outs
- Climate carrying-cost: major wildfire risk; extreme-heat days projected 7→20/yr by 2055 (HVAC capex compounding) — expect insurance premiums to compound above CPI over the hold.
Questions for the listing agent
- Is there a deadline driving the sale (1031 exchange, divorce, estate, relocation)? That informs how much negotiation room exists.
- Schools are B-rated — typically a magnet for longer-tenancy family renters. What's the average tenant stay here, and is there a school-zone premium baked into asking?
- What's the average days-on-market for RENTAL listings here right now (not sales)? A rising rental-DOM trend means longer vacancies and softer asking-rent achievability than the comps imply.
- What's the recent tenant-quality profile in this submarket — average credit score on applications, eviction rate, late-payment / NSF rate, and stable-employment percentage? A property-management company in the area should have these aggregated.
- How much new for-sale + rental construction is in the pipeline within 1–3 miles? Heavy new supply typically softens prices + rents 12–24 months out; constrained supply supports both.
Investment metrics
- 1% rule
- 1.18% ✓
- Cap rate
- 10.23%
- Cash-on-cash
- 14.05%
- DSCR
- 1.63
- GRM
- 7.1
CMA / ARV
- ARV (on-the-fly)
- $277,760
- Comps found
- 12
Show comp detail 12 sales within ~0.75 mi
| Address | Dist | Beds/Ba | Sqft | Sold | Price | $/sf | Match |
|---|---|---|---|---|---|---|---|
| 1245 W Cienega Ave #18 | 0.00mi | 2/2.0 | 1,680 (-3%) | 4mo | $239,900 | $143 | 91 |
| 1245 W Cienega Ave #70 | 0.00mi | 3/2.0 (+1) | 1,800 (+4%) | 7mo | $250,000 | $139 | 83 |
| 1245 W Cienega Ave #234 | 0.00mi | 3/2.0 (+1) | 1,694 (-2%) | 11mo | $412,000 | $243 | 82 |
| 1245 Cienega Ave W #73 | 0.00mi | 3/2.0 (+1) | 1,650 (-5%) | 12mo | $270,000 | $164 | 77 |
| 1245 W Cienega Ave #181 | 0.00mi | 3/2.0 (+1) | 1,624 (-6%) | 9mo | $260,000 | $160 | 76 |
| 1245 W Cienega #76 | 0.00mi | 3/2.0 (+1) | 1,792 (+3%) | 16mo | $431,000 | $241 | 76 |
| 1245 W Cienega Ave #183 | 0.00mi | 2/1.0 | 1,536 (-12%) | 4mo | $125,000 | $81 | 73 |
| 1245 W Cienega Ave #83 | 0.00mi | 3/2.0 (+1) | 1,638 (-6%) | 16mo | $257,000 | $157 | 73 |
| 1245 W Cienega Ave #46 | 0.00mi | 3/2.0 (+1) | 1,512 (-13%) | 1mo | $270,000 | $179 | 72 |
| 1245 Cienega Ave W #38 | 0.00mi | 3/2.0 (+1) | 1,600 (-8%) | 15mo | $245,000 | $153 | 70 |
| 1635 W Covina #53 | 0.52mi | 3/2.0 (+1) | 1,484 (-14%) | 3mo | $285,000 | $192 | 44 |
| 1630 W Covina Blvd #52 | 0.60mi | 3/2.0 (+1) | 1,552 (-11%) | 18mo | $150,000 | $97 | 35 |
Match score weights: distance 35% · size 25% · config 20% · recency 20%. Top-matched comps best support the ARV.
Projected returns pro-forma
-3.0% appreciation · 0.0% rent growth · sell at horizon
- IRR
- 1.1%
- Equity multiple
- 1.04×
- Total profit
- $3,108
- Equity at exit
- $39,512
- IRR
- 7.8%
- Equity multiple
- 1.51×
- Total profit
- $38,095
- Equity at exit
- $22,912
Cash invested: $74,200 (down + closing). Projections, not guarantees.
Landlord ↔ Tenant lean methodology
- Overall (STATE)
- 18 Strongly Tenant-Friendly
- State California
- 18 Strongly Tenant-Friendly · D+13
- County
- — inherits STATE
- City
- — inherits STATE
ZIP-level market 91773
- Rents YoY
- -1.0%
- Active inventory
- 85
- Price-to-rent
- 7.1×
Monthly cashflow live
- Estimated rent
- $3,132 high interval (Pro) →
- Mortgage (P&I)
- −$1,390
- Tax from tax record
- −$106 /mo · $1,268/yr
- Insurance
- −$110
- HOA
- −$0
- Vacancy / Maint / Mgmt
- −$658
- Net cashflow
- $869
Break-even live
UW: 25.0% down · 7.5% · 30yr · 1.5% tax · 5.0% vac · 8.0% maint · 8.0% mgmt
Financing live
Cash to close
- Down payment
- $66,250
- Closing costs
- $7,950
- Reserves months
- —
- Total cash needed
- —
Loan-product check · same deal, 3 products live
Conventional
25% down · 7.5% · 30yr
- Down + closing
- —
- Monthly P&I
- —
- Monthly cashflow
- —
- DSCR
- —
- Eligible?
- —
Personal DTI + credit; lowest rate.
DSCR
20% down · 8.5% · 30yr
- Down + closing
- —
- Monthly P&I
- —
- Monthly cashflow
- —
- DSCR
- —
- Eligible?
- —
No personal income docs; deal must DSCR.
Hard money
10% down · 12.0% · 12mo
- Down + closing
- —
- Monthly P&I
- —
- Monthly cashflow
- —
- DSCR
- —
- Eligible?
- —
Short-term bridge; refi at stabilization.
Rent comps 16 comps
| Address | Beds | Baths | Sqft | Rent | $/sqft | DOM | Units | Dist |
|---|---|---|---|---|---|---|---|---|
| 1189 Strawberry Ln Glendora, CA | 2.0 | 2.5 | 1292 | $2,900 | $2.24 | 44d | 1 | 0.48mi |
| 1430 W Badillo St San Dimas, CA | 3.0 | 1.5 | 1200 | $3,000 | $2.50 | 1d | 1 | 0.52mi |
| 1471 Cypress St San Dimas, CA | 2.0 | 2.0 | 1127 | $900 | $0.80 | 7d | 1 | 0.53mi |
| 1447 S Valley Center Ave Glendora, CA | 3.0 | 2.0 | 1345 | $3,500 | $2.60 | 1d | 1 | 0.65mi |
| 1746 S Sunflower Ave Unit 7 Glendora, CA | 2.0 | 2.0 | 1100 | $2,400 | $2.18 | 24d | 1 | 0.78mi |
| 1746 S Sunflower Ave Unit 10 Glendora, CA | 2.0 | 1.5 | 1100 | $2,400 | $2.18 | 44d | 1 | 0.78mi |
| 644 Pearlanna Dr San Dimas, CA | 3.0 | 1.5 | 1350 | $3,500 | $2.59 | 1d | 1 | 0.95mi |
| 522 W 4th St San Dimas, CA | 3.0 | 1.0 | 1113 | $3,550 | $3.19 | 44d | 1 | 1.01mi |
| 608 Claraday St Glendora, CA | 3.0 | 2.5 | 1600 | $3,500 | $2.19 | 44d | 1 | 1.16mi |
| 432 W Caldwell Ct San Dimas, CA | 2.0 | 3.0 | 1502 | $3,100 | $2.06 | 44d | 1 | 1.17mi |
| 807 Avenida Loma Vis San Dimas, CA | 3.0 | 2.0 | 1740 | $4,500 | $2.59 | 10d | 1 | 1.29mi |
| 220 W 1st St San Dimas, CA | 3.0 | 1.0 | 1200 | $845 | $0.70 | 17d | 1 | 1.32mi |
| 235 W 4th St San Dimas, CA | 3.0 | 2.0 | 1200 | $3,499 | $2.92 | 1d | 1 | 1.36mi |
| 204 San Luis Rey Dr San Dimas, CA | 2.0 | 3.0 | 1287 | $3,165 | $2.46 | 5d | 1 | 1.40mi |
| 20254 E Arrow Hwy Unit B Covina, CA | 3.0 | 2.5 | 1477 | $3,100 | $2.10 | 24d | 1 | 1.43mi |
| 20240 E Arrow Hwy Unit D Covina, CA | 3.0 | 2.5 | 1477 | $3,350 | $2.27 | 44d | 1 | 1.44mi |
Listing history 2 events
-
2026-06-18remarks 699-char remark
-
2026-06-18$265,000 Coming Soon 1 DOM
ⓘ Source: listings_history table (triggers on properties + properties_extension) + one-shot
backfill from property_details.listing_events for pre-trigger history.
Tax reassessment forecast CA · Resets to sale price
- Current annual tax
- $1,268 · $106/mo
- Projected year-2 tax
- $2,014 · $168/mo
- Expected delta
- +$746/yr (+$62/mo · 58.9%)
ⓘ Screening estimate from a state-policy table — verify with the county assessor before closing.
Climate risk First Street
- Flood 1/10 Low FEMA zone X (unshaded) · 0% chance over 30 yrs
- Wildfire 7/10 Severe
- Heat 7/10 Severe 7 d/yr ≥99°F today · 20 d/yr by 30 yrs out
- Wind 1/10 Low
- Air quality 8/10 Severe 17 unhealthy d/yr today · 21 by 30 yrs out
Nearby sold comps map
Loading sold comps map…
Walkable amenities ~0.75 mi
Loading nearby amenities…
Taxation est. · year 1
- Rental income
- $37,584
- − Mortgage interest
- −$14,844
- − Property taxes
- −$1,268
- − Insurance
- −$1,325
- − Repairs & maintenance
- −$3,007
- − Management
- −$3,007
- − Depreciation
- −$7,709
- Taxable income
- $6,425
- Est. tax owed @ 24.0%
- −$1,542
- After-tax cash flow
- $8,881/yr
For passive investors: Depreciation is non-cash, so a rental often shows a tax loss while cash-flowing — sheltering income. Rental losses are passive: they offset passive income freely, and up to $25,000/yr can offset ordinary (W-2) income if you actively participate and your MAGI is under $100k (phasing out to $0 by $150k); unused losses carry forward. On sale, claimed depreciation is recaptured at up to 25%, and gains may owe capital-gains tax (a 1031 exchange can defer both). Figures are a year-1 estimate at your 24.0% rate — not tax advice; consult a CPA.
Schools (NCES district)
- District
- Bonita Unified
- NCES district ID
- 0605610
- Math proficiency
- 59% ▲ 3.00%
- Reading proficiency
- 70% ▬ 0.00%
- Median HH income
- $76,196
- Composite
- 58.71/100
- National rank
- #2001
- State rank
- #151 of 1400 in CA
Livability — San Dimas
- Score
- 72/100
- State rank
- #192
- US rank
- #6164
Category grades
Schools grade is shown separately in the Schools card above.
Census & demographics
- Census place
- San Dimas, CA
- County
- Los Angeles County · 9,444,647 people
- City population
- 33,598
- Metro
- Los Angeles-Long Beach-Anaheim, CA
- Population (ZIP)
- 33,598
- Household income
- $105,338
- Rent vs Own
- Severe rent burden
- 1238.0
Population outlook (Los Angeles County) Hauer SSP2
- Today (2025)
- 10,940,515 people
- By 2030
- 11,256,481 · +2.9%
- By 2040
- 11,729,929 · +7.2%
- By 2050
- 11,948,407 · +9.2%
- By 2075
- 11,818,114 · +8.0%
- By 2100
- 10,842,928 · -0.9%
Race, ethnicity, and origin ACS 2023
- Neighborhood character
- Diverse neighborhood (Simpson 0.69)
- Race & ethnicity
- White 38% Hispanic / Latino 37% Two or more races 19% Asian 18% Black 3% Native American 1%
- Hispanic origin (detail)
- Mexican 27% Puerto Rican 1%
- Common ancestry
- Romanian 2% Lithuanian 2% Slovak 2%
- Foreign-born
- 22% · Canada, China, Vietnam
- Languages at home
- 64% English-only · Spanish 18% Chinese 8% Tagalog/Filipino 2%
Political lean MEDSL · Los Angeles
- 2024 margin
- Solid D (+32.9) · D 64.8% · R 31.9% · Other 3.3%
- 2008→2024 swing
- -7.4pp toward R · 2008: 40.4pp · 2024: 32.9pp
- All cycles
- 2024: D+32.9 2020: D+44.2 2016: D+48.0 2012: D+40.0 2008: D+40.4
Not yet ingested
- Civics
- —
Market trends
- HPI YoY
- ▼ -778.24%
- Current HPI
- 379.5269
- Rent YoY
- ▼ -0.97%
- Metro
- Los Angeles-Long Beach-Anaheim, CA
- State GDP YoY
- ▲ 3.21%
- F500 in state
- 116
Industry mix (Fortune 500 HQ in CA)
| Industry | F500 HQs | Revenue |
|---|---|---|
| Technology | 27 | $1,492B |
|
||
| Financial Services | 3 | $174B |
|
||
| Retail | 3 | $44B |
|
||
| Insurance | 3 | $26B |
|
||
| Media / Entertainment | 2 | $115B |
|
||
| Pharmaceuticals / Biotech | 2 | $62B |
|
||
Price history
1 event — show timeline
- 2026-06-18 Coming Soon $265,000 CRMLS
Property tax history
+5.4%/yrLatest (2025): $1,268 · +5.4% YoY. Source: county tax records.
Cash-flow waterfall
monthlySold comps — $/sqft
last 12 mo · ≤1 miLoading sold comps…