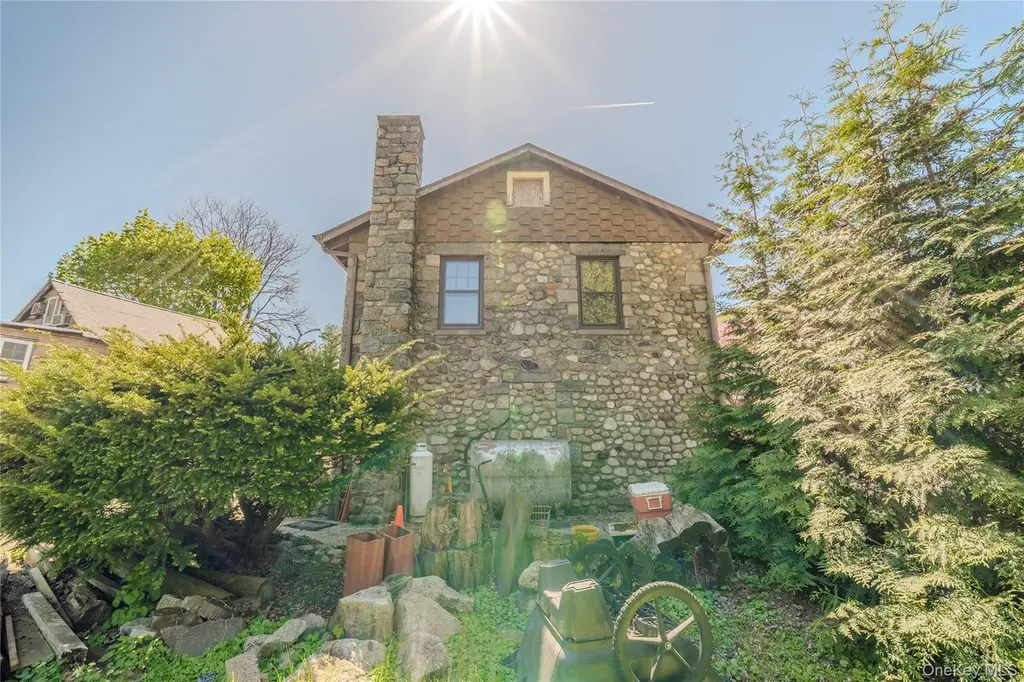
26 Rock St · Cold Spring, NY
Flood risk 9/10 · Severe
- FEMA flood zone
- X (unshaded)
- Chance of flooding over 30 yrs
- 0.99%
- Est. flood insurance / yr
- $473 – $860
Fire risk 3/10 · Minor
- Est. fire insurance / yr
- $691 – $1,283
Heat risk 5/10 · Moderate
- Hot days now (above 101°F)
- 8 days/yr
- Hot days in 30 yrs
- 17 days/yr
Wind risk 4/10 · Minor
- Chance of severe wind over 30 yrs
- 17.0%
Air-quality risk 3/10 · Minor
- Unhealthy air days now
- 2 days/yr
- Unhealthy air days in 30 yrs
- 3 days/yr
Risk factors via First Street. Map © Google.
Why this score? — see what drove the A- grade
The composite is a weighted blend of 9 inputs, each scored 0–100. Each bar is that input's sub-score; the figure is the points it added to the 100-point composite (weight × sub-score).
- Cash flow +30.0/30.0
- ARV discount +15.0/15.0
- 1% rule +10.0/10.0
- DSCR +10.0/10.0
- Schools +6.6/10.0
- Livability +4.0/5.0
- Rent growth +2.5/5.0
- Condition / age +2.5/5.0
- Appreciation +0.0/10.0
$459,000
🖨 Deal sheet 📄 Offer letter ✓ Due diligence
Listing remarks MLS
Come Enjoy this Stone build colonial in downtown Cold Spring. Home was built with stones right from the local ground. Roof was just done in the past 7 years and Furnace was installed 5 years ago. The woodwork amazes you as you walk around this home. Very large rooms and a good size lot. Easy walking distance to the Metro north Train Station and a quick 1 hr 15min ride into Manhattans Grand Central. Located just off Main Street within a short walk to the train, riverfront, hiking trails, shops, galleries and restaurants. Additional Information: HeatingFuel:Oil Above Ground,
Key facts
- Exposed brick
- Large backyard
- Original wood floors
Tags
Property features AI
Finance
- Financial info: Tax year 2025 (tax amount not included per instructions)
Exterior
- Parking: Common parking and driveway access; No carport
- Utilities: Electricity connected (Central Hudson); Public sewer
- Home design: Single family residence; Living area reported from public records
- Construction: Frame and stone construction materials; Foundation includes stone and other materials
- Exterior features: Not waterfront; Frame and stone construction
Interior
- Kitchen: No appliances listed
- Bedrooms: Total of 8 rooms (bedroom count not specified)
- Flooring: Combination flooring; Hardwood flooring
- Bathrooms: 1 full bathroom; 1 half bathroom
- Heating & cooling: No cooling; No primary heating listed (Other)
- Interior features: Other interior features; Combination and hardwood flooring; Full unfinished basement (see remarks)
- Laundry & utility: No laundry appliances listed
Neighborhood map
What this means for you Summary
Snapshot
- This is a 4-bed/2.5-bath single-family listed at $459k.
Deal economics
- At list price, monthly cash flow is $3k ($32k/yr) — positive.
- The deal already cash-flows at list — no discount required.
- Meets the 1% rule at list price ($8k rent vs $459k).
- Recommended offer: $445k (3.0% below list) — sets the bar for market timing.
Location & tenants
- Location reads 81/100 on livability (#97 in NY, #1,466 nationally) — a professional / high-income tenant draw. Strengths: crime A+, employment A+, housing A+; Watch: commute C-, amenities F, cost of living F.
- Haldane Central School District (town): math 65% / reading 83% proficiency, ranked #84 of 590 in NY (top 14%) — strong family-tenant draw, lease renewals of 3-5y typical; only 8% free/reduced lunch — higher-income household profile.
- Zoned schools: Haldane Elementary School (math 57% / reading 77%, grade B+, #525 of 2,108 statewide, top 27%, 292 students, 18% FRL); Haldane Middle School (math 57% / reading 82%, grade A, #89 of 729 statewide, top 12%, 197 students, 16% FRL); Haldane High School (math 98% / reading 92%, grade A+, #93 of 1,100 statewide, top 10%, 314 students, 17% FRL).
- Market conditions: 38 active listings in the ZIP; 1 comparable units currently listed for rent nearby; 142 units permitted in Putnam County in 2024 (75 in 5+ unit buildings).
Forward outlook
- Local home prices are declining (-3.0%/yr); year-one equity from $3k of loan paydown is wiped out by about $14k of value loss. Plan a longer hold.
- Putnam County population projected to shrink 3% by 2050 — rents likely to lag national; underwrite the cash flow, not the appreciation.
- At projected returns (-3.0% appreciation + 3.0% rent growth), your $129k cash investment doubles in ~5 years — after that, you're playing with house money.
Negotiation context
- It's been on market 51 days — a 3% lower offer ($445k) is reasonable based on typical stale-listing flexibility.
- 8 sale attempts since 29y ago with the ask held roughly flat each time — persistent listings suggest the price (not the market) is what's stuck; bring a comps-based counter.
- Current owner paid $390k; 18% above their basis — modest negotiation headroom, anchor on the comps not their cost.
Risks & watch-outs
- Watch-outs: property tax is 2.6% of price; flood insurance adds $56/mo; built in 1897 — expect roof / HVAC / electrical / plumbing capex.
- Climate carrying-cost: severe flood risk; extreme-heat days projected 8→17/yr by 2055 (HVAC capex compounding) — expect insurance premiums to compound above CPI over the hold.
Questions for the listing agent
- It's been on market 51 days. Have you received any prior offers? Is the seller open to a 3% concession, seller financing, or rate buy-down credit?
- Built in 1897 — when were the roof, HVAC, electrical panel, plumbing, and water heater last replaced?
- Property tax is high relative to price — has the assessment been appealed recently, and will the sale trigger a re-assessment?
- What's the actual annual flood-insurance premium (NFIP or private), and is the property in a SFHA with mandatory coverage?
- Is there a deadline driving the sale (1031 exchange, divorce, estate, relocation)? That informs how much negotiation room exists.
- Schools are A-rated — typically a magnet for longer-tenancy family renters. What's the average tenant stay here, and is there a school-zone premium baked into asking?
- What's the average days-on-market for RENTAL listings here right now (not sales)? A rising rental-DOM trend means longer vacancies and softer asking-rent achievability than the comps imply.
- What's the recent tenant-quality profile in this submarket — average credit score on applications, eviction rate, late-payment / NSF rate, and stable-employment percentage? A property-management company in the area should have these aggregated.
- How much new for-sale + rental construction is in the pipeline within 1–3 miles? Heavy new supply typically softens prices + rents 12–24 months out; constrained supply supports both.
Investment metrics
- 1% rule
- 1.74% ✓
- Cap rate
- 13.47%
- Cash-on-cash
- 25.63%
- DSCR
- 2.14
- GRM
- 4.8
CMA / ARV
- ARV (median comp)
- $901,860
- List price
- $459,000
- Delta
- -49.11%
- Verdict
- UNDERPRICED
- Comps
- 20 within 1.0 mi
Show comp detail 8 sales within ~0.75 mi
| Address | Dist | Beds/Ba | Sqft | Sold | Price | $/sf | Match |
|---|---|---|---|---|---|---|---|
| 23 Kemble Ave | 0.08mi | 3/2.0 (-1) | 1,404 (-5%) | 9mo | $718,000 | $511 | 74 |
| 6 Church St | 0.14mi | 3/1.5 (-1) | 1,440 (-2%) | 10mo | $830,000 | $576 | 72 |
| 14 Fair St | 0.10mi | 3/1.0 (-1) | 1,552 (+5%) | 18mo | $918,500 | $592 | 60 |
| 13 Church St | 0.14mi | 3/1.0 (-1) | 1,359 (-8%) | 14mo | $695,000 | $511 | 58 |
| 174 Main St | 0.20mi | 4/2.5 | 1,663 (+13%) | 15mo | $695,000 | $418 | 56 |
| 2 Hamilton St | 0.39mi | 3/2.5 (-1) | 1,404 (-5%) | 17mo | $930,000 | $662 | 55 |
| 10 High St | 0.20mi | 3/1.0 (-1) | 1,377 (-6%) | 20mo | $570,000 | $414 | 52 |
| 1710 Route 9D | 0.68mi | 3/2.0 (-1) | 1,680 (+14%) | 2mo | $750,000 | $446 | 37 |
Match score weights: distance 35% · size 25% · config 20% · recency 20%. Top-matched comps best support the ARV.
Projected returns pro-forma
-3.0% appreciation · 3.0% rent growth · sell at horizon
- IRR
- 18.7%
- Equity multiple
- 1.76×
- Total profit
- $97,297
- Equity at exit
- $68,438
- IRR
- 27.1%
- Equity multiple
- 3.39×
- Total profit
- $306,900
- Equity at exit
- $39,686
Cash invested: $128,520 (down + closing). Projections, not guarantees.
Landlord ↔ Tenant lean methodology
- Overall (STATE)
- 15 Strongly Tenant-Friendly
- State New York
- 15 Strongly Tenant-Friendly · D+10
- County
- — inherits STATE
- City
- — inherits STATE
ZIP-level market 10516
- Home prices YoY
- -31.9%
- Active inventory
- 38
- Price-to-rent
- 4.8×
Monthly cashflow live
- Estimated rent
- $8,000 medium interval (Pro) →
- Mortgage (P&I)
- −$2,407
- Tax from tax record
- −$977 /mo · $11,724/yr
- Insurance
- −$191
- Flood insurance flood zone
- −$56 /mo · $666/yr
- HOA
- −$0
- Vacancy / Maint / Mgmt
- −$1,680
- Net cashflow
- $2,689
Break-even live
UW: 25.0% down · 7.5% · 30yr · 1.5% tax · 5.0% vac · 8.0% maint · 8.0% mgmt
Financing live
Cash to close
- Down payment
- $114,750
- Closing costs
- $13,770
- Reserves months
- —
- Total cash needed
- —
Loan-product check · same deal, 3 products live
Conventional
25% down · 7.5% · 30yr
- Down + closing
- —
- Monthly P&I
- —
- Monthly cashflow
- —
- DSCR
- —
- Eligible?
- —
Personal DTI + credit; lowest rate.
DSCR
20% down · 8.5% · 30yr
- Down + closing
- —
- Monthly P&I
- —
- Monthly cashflow
- —
- DSCR
- —
- Eligible?
- —
No personal income docs; deal must DSCR.
Hard money
10% down · 12.0% · 12mo
- Down + closing
- —
- Monthly P&I
- —
- Monthly cashflow
- —
- DSCR
- —
- Eligible?
- —
Short-term bridge; refi at stabilization.
Rent comps 1 comps
| Address | Beds | Baths | Sqft | Rent | $/sqft | DOM | Units | Dist |
|---|---|---|---|---|---|---|---|---|
| 6 Church St Cold Spring, NY | 3.0 | 1.5 | 1440 | $8,000 | $5.56 | 23d | 1 | 0.12mi |
Listing history 32 events
-
2026-06-18days on market $459,000 Active 51 DOM
-
2026-06-17days on market $459,000 Active 50 DOM
-
2026-06-16days on market $459,000 Active 49 DOM
-
2026-06-15days on market $459,000 Active 48 DOM
-
2026-06-14days on market $459,000 Active 46 DOM
-
2026-06-10days on market $459,000 Active 43 DOM
-
2026-06-09days on market $459,000 Active 42 DOM
-
2026-06-08days on market $459,000 Active 41 DOM
-
2026-06-07days on market $459,000 Active 40 DOM
-
2026-06-03days on market $459,000 Active 36 DOM
-
2026-06-02days on market $459,000 Active 35 DOM
-
2026-06-01days on market $459,000 Active 34 DOM
-
2026-05-31days on market $459,000 Active 33 DOM
-
2026-05-30days on market $459,000 Active 32 DOM
-
2026-04-28$459,000 Active 1574-char remark
-
2024-02-02historical
-
2018-02-23soldstatus $390,000
-
2018-02-06soldstatus $390,000 Sold
Show marketing remark (582 chars)
Come Enjoy this Stone build colonial in downtown Cold Spring. Home was built with stones right from the local ground. Roof was just done in the past 7 years and Furnace was installed 5 years ago. The woodwork amazes you as you walk around this home. Very large rooms and a good size lot. Easy walking distance to the Metro north Train Station and a quick 1 hr 15min ride into Manhattans Grand Central. Located just off Main Street within a short walk to the train, riverfront, hiking trails, shops, galleries and restaurants. Additional Information: HeatingFuel:Oil Above Ground,
-
2017-12-08historical Pending
Show marketing remark (582 chars)
Come Enjoy this Stone build colonial in downtown Cold Spring. Home was built with stones right from the local ground. Roof was just done in the past 7 years and Furnace was installed 5 years ago. The woodwork amazes you as you walk around this home. Very large rooms and a good size lot. Easy walking distance to the Metro north Train Station and a quick 1 hr 15min ride into Manhattans Grand Central. Located just off Main Street within a short walk to the train, riverfront, hiking trails, shops, galleries and restaurants. Additional Information: HeatingFuel:Oil Above Ground,
-
2017-09-28$419,000 Active
Show marketing remark (582 chars)
Come Enjoy this Stone build colonial in downtown Cold Spring. Home was built with stones right from the local ground. Roof was just done in the past 7 years and Furnace was installed 5 years ago. The woodwork amazes you as you walk around this home. Very large rooms and a good size lot. Easy walking distance to the Metro north Train Station and a quick 1 hr 15min ride into Manhattans Grand Central. Located just off Main Street within a short walk to the train, riverfront, hiking trails, shops, galleries and restaurants. Additional Information: HeatingFuel:Oil Above Ground,
-
2015-12-07historical Withdrawn
-
2015-12-07historical
-
2015-10-13Active
-
2015-10-12$379,000
-
2015-10-12$379,000
-
2015-09-30historical Withdrawn
-
2015-09-30historical
-
2014-11-15historical Pending
-
2014-05-18price
-
2014-05-18Active
-
2014-05-17$349,000
-
1997-05-25
ⓘ Source: listings_history table (triggers on properties + properties_extension) + one-shot
backfill from property_details.listing_events for pre-trigger history.
Tax reassessment forecast NY · Partial reset (capped growth)
- Current annual tax
- $11,724 · $977/mo
- Projected year-2 tax
- $11,724 · $977/mo
- Expected delta
- $0/yr ($0/mo · 0.0%)
ⓘ Screening estimate from a state-policy table — verify with the county assessor before closing.
Climate risk First Street
- Flood 9/10 Extreme FEMA zone X (unshaded) · 99% chance over 30 yrs
- Wildfire 3/10 Moderate
- Heat 5/10 Major 8 d/yr ≥101°F today · 17 d/yr by 30 yrs out
- Wind 4/10 Moderate 17% chance of damaging wind over 30 yrs
- Air quality 3/10 Moderate 2 unhealthy d/yr today · 3 by 30 yrs out
Nearby sold comps map
Loading sold comps map…
Walkable amenities ~0.75 mi
Loading nearby amenities…
Taxation est. · year 1
- Rental income
- $96,000
- − Mortgage interest
- −$25,711
- − Property taxes
- −$11,724
- − Insurance
- −$2,962
- − Repairs & maintenance
- −$7,680
- − Management
- −$7,680
- − Depreciation
- −$13,353
- Taxable income
- $26,890
- Est. tax owed @ 24.0%
- −$6,454
- After-tax cash flow
- $25,816/yr
For passive investors: Depreciation is non-cash, so a rental often shows a tax loss while cash-flowing — sheltering income. Rental losses are passive: they offset passive income freely, and up to $25,000/yr can offset ordinary (W-2) income if you actively participate and your MAGI is under $100k (phasing out to $0 by $150k); unused losses carry forward. On sale, claimed depreciation is recaptured at up to 25%, and gains may owe capital-gains tax (a 1031 exchange can defer both). Figures are a year-1 estimate at your 24.0% rate — not tax advice; consult a CPA.
Schools (NCES district)
- District
- Haldane Central School District
- NCES district ID
- 3613230
- Math proficiency
- 65% ▼ -8.00%
- Reading proficiency
- 83% ▲ 11.00%
- Median HH income
- $81,824
- Composite
- 65.66/100
- National rank
- #462
- State rank
- #84 of 590 in NY
Livability — Cold Spring
- Score
- 81/100
- State rank
- #97
- US rank
- #1466
Category grades
Schools grade is shown separately in the Schools card above.
Census & demographics
- Census place
- Cold Spring, NY
- Population (ZIP)
- 5,607
Population outlook (Putnam County) Hauer SSP2
- Today (2025)
- 99,705 people
- By 2030
- 99,650 · -0.1%
- By 2040
- 98,641 · -1.1%
- By 2050
- 96,348 · -3.4%
- By 2075
- 94,412 · -5.3%
- By 2100
- 88,728 · -11.0%
Race, ethnicity, and origin ACS 2023
- Neighborhood character
- Predominantly White (87%)
- Race & ethnicity
- White 87% Hispanic / Latino 5% Black 5% Two or more races 4%
- Common ancestry
- Russian 5% Romanian 4% Italian 3%
- Foreign-born
- 8% · Canada
- Languages at home
- 90% English-only · Spanish 4% French/Haitian/Cajun 3% Other Indo-European 1%
Political lean MEDSL · Putnam
- 2024 margin
- R (+13.7) · D 43.2% · R 56.8%
- 2008→2024 swing
- -6.2pp toward R · 2008: -7.5pp · 2024: -13.7pp
- All cycles
- 2024: R+13.7 2020: R+7.9 2016: R+17.8 2012: R+11.2 2008: R+7.5
Not yet ingested
- Civics
- —
Market trends
- HPI YoY
- ▼ -121.80%
- Current HPI
- 259.5306
- Rent YoY
- —
- Metro
- —
- State GDP YoY
- ▲ 2.60%
- F500 in state
- 92
Industry mix (Fortune 500 HQ in NY)
| Industry | F500 HQs | Revenue |
|---|---|---|
| Financial Services | 10 | $950B |
|
||
| Consumer Goods | 9 | $162B |
|
||
| Insurance | 4 | $225B |
|
||
| Telecommunications | 2 | $144B |
|
||
| Pharmaceuticals | 2 | $112B |
|
||
| Media / Entertainment | 2 | $69B |
|
||
Price history
+31.5% since first listed18 events — show timeline
- 2026-04-28 Listed $459,000 OneKey® MLS as Distributed by MLS Grid
- 2024-02-02 Listing Removed — OneKey® MLS as Distributed by MLS Grid
- 2018-02-23 Sold (Public Records) $390,000 Public Records
- 2018-02-06 Sold (MLS) $390,000 OneKey® MLS as Distributed by MLS Grid
- 2017-12-08 Contingent — OneKey® MLS as Distributed by MLS Grid
- 2017-09-28 Listed $419,000 OneKey® MLS as Distributed by MLS Grid
- 2015-12-07 Delisted — HGMLS
- 2015-12-07 Listing Removed — OneKey® MLS as Distributed by MLS Grid
- 2015-10-13 Listed — HGMLS
- 2015-10-12 Listed $379,000 OneKey® MLS as Distributed by MLS Grid
- 2015-10-12 Listed $379,000 OneKey® MLS as Distributed by MLS Grid
- 2015-09-30 Delisted — HGMLS
- 2015-09-30 Listing Removed — OneKey® MLS as Distributed by MLS Grid
- 2014-11-15 Contingent — HGMLS
- 2014-05-18 Price Changed — HGMLS
- 2014-05-18 Listed — HGMLS
- 2014-05-17 Listed $349,000 OneKey® MLS as Distributed by MLS Grid
- 1997-05-25 Listed — HGMLS
Property tax history
+21.1%/yrLatest (2025): $11,724 · +2.0% YoY. Source: county tax records.
Cash-flow waterfall
monthlySold comps — $/sqft
last 12 mo · ≤1 miLoading sold comps…