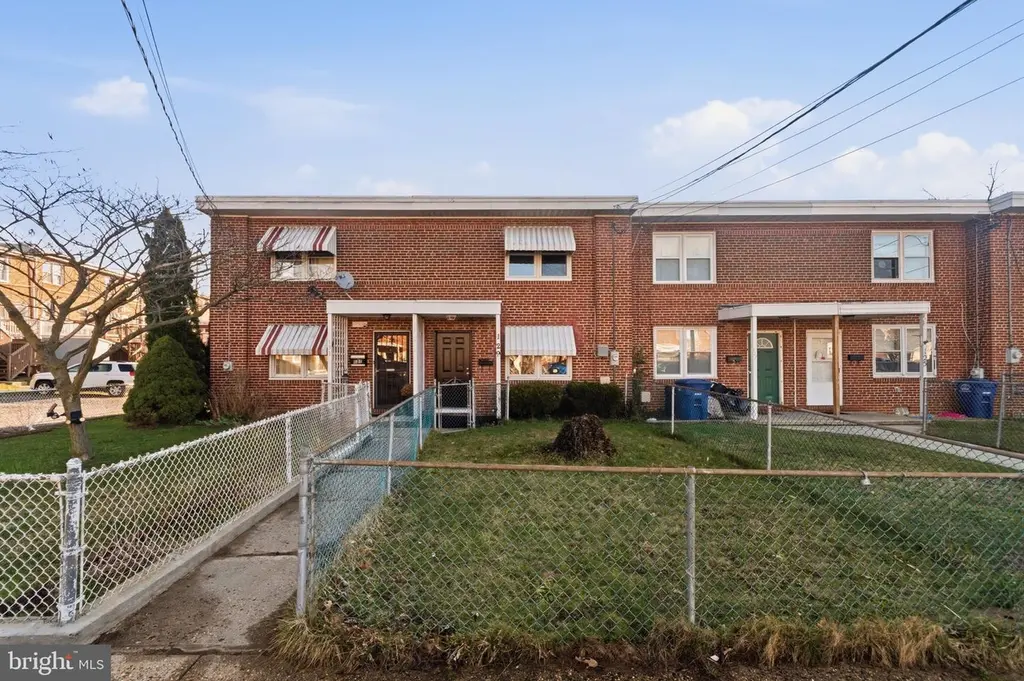
129 Brown St · Vincentown, NJ
Flood risk 9/10 · Severe
- FEMA flood zone
- X (shaded)
- Chance of flooding over 30 yrs
- 0.99%
- Est. flood insurance / yr
- $507 – $1,088
Fire risk 2/10 · Minimal
- Est. fire insurance / yr
- $526 – $976
Heat risk 7/10 · Major
- Hot days now (above 104°F)
- 7 days/yr
- Hot days in 30 yrs
- 15 days/yr
Wind risk 6/10 · Moderate
- Chance of severe wind over 30 yrs
- 51.0%
Air-quality risk 4/10 · Minor
- Unhealthy air days now
- 5 days/yr
- Unhealthy air days in 30 yrs
- 7 days/yr
Risk factors via First Street. Map © Google.
Why this score? — see what drove the D+ grade
The composite is a weighted blend of 9 inputs, each scored 0–100. Each bar is that input's sub-score; the figure is the points it added to the 100-point composite (weight × sub-score).
- Cash flow +21.5/30.0
- DSCR +6.9/10.0
- 1% rule +5.4/10.0
- Schools +3.4/10.0
- Rent growth +2.9/5.0
- Livability +2.5/5.0
- Condition / age +2.5/5.0
- ARV discount +0.0/15.0
- Appreciation +0.0/10.0
$250,000
🖨 Deal sheet 📄 Offer letter ✓ Due diligence
Listing remarks MLS
This 3 BR, 1 BA row home is priced for a quick sale. It features updated kitchen and bath, and has been freshly painted with new carpet and laminate flooring. Ideal location--within walking from downtown and public transportation. So don't snooze on it. Instead; schedule a showing today!
Key facts
- Built 1958
- Listed 62 days
Property features AI
Exterior
- Parking: On-street parking
- Utilities: Public water; Public sewer
- Home design: Interior townhouse/rowhouse; Fee simple ownership
- Construction: Brick construction; Slab foundation; Above-grade and below-grade structures; Built year per assessor
- Exterior features: Lot dimensions approximately 18 x 106
Interior
- Bedrooms: 3 bedrooms on the main level
- Bathrooms: 1 full bathroom (main level)
- Heating & cooling: Central heating; Electric heating fuel; Natural gas hot water
- Interior features: Two or more access exits
Neighborhood map
What this means for you Summary
Snapshot
- This is a 3-bed/1.0-bath townhouse listed at $250k.
Deal economics
- At list price, monthly cash flow is $309 ($4k/yr) — positive.
- The deal already cash-flows at list — no discount required.
- Meets the 1% rule at list price ($3k rent vs $250k).
- Recommended offer: $235k (6.0% below list) — sets the bar for market timing.
- Cap rate 8.1% vs local median 4.5% in Vincentown — top-decile yield for the area; either an underpriced asset or a hidden risk that comps aren't pricing in. Stress-test before assuming the spread holds.
Location & tenants
- Location reads: area grade D — affects rentability + tenant quality, not the cash-flow math above.
- Rancocas Valley Regional High School District (suburban): math 29% / reading 49% proficiency, ranked #236 of 472 in NJ (top 50%) — families likely to look elsewhere, expect single-tenant / working-renter base with shorter leases.
- Market conditions: Rents rising (+1.4%/yr); 134 active listings in the ZIP; 13 comparable units currently listed for rent nearby; rentals leasing fast (median 1d on market — plan ~1-2 weeks tenant-placement turnaround); solid renter incomes; 2,161 units permitted in Burlington County in 2024 (988 in 5+ unit buildings).
Forward outlook
- Local home prices are declining (-3.0%/yr); year-one equity from $2k of loan paydown is wiped out by about $8k of value loss. Plan a longer hold.
- Burlington County population projected to shrink 5% by 2050 — rents likely to lag national; underwrite the cash flow, not the appreciation.
Negotiation context
- It's been on market 62 days — a 6% lower offer ($235k) is reasonable based on typical stale-listing flexibility.
- 6 sale attempts since 25y ago; this cycle's ask is 6% above the opening price — seller raised mid-cycle; expect resistance to lowballs.
- Current owner paid $70k; list at $250k implies a 257% gain — meaningful room to come down on a strong offer.
Risks & watch-outs
- Watch-outs: flood insurance adds $66/mo; built in 1958 — expect roof / HVAC / electrical / plumbing capex.
- Climate carrying-cost: severe flood risk; major wind risk, 51% chance of damaging wind over 30y; extreme-heat days projected 7→15/yr by 2055 (HVAC capex compounding) — expect insurance premiums to compound above CPI over the hold.
Questions for the listing agent
- It's been on market 62 days. Have you received any prior offers? Is the seller open to a 6% concession, seller financing, or rate buy-down credit?
- Built in 1958 — when were the roof, HVAC, electrical panel, plumbing, and water heater last replaced?
- What's the actual annual flood-insurance premium (NFIP or private), and is the property in a SFHA with mandatory coverage?
- Why hasn't it sold? Are there any deal-killer items the seller is aware of (foundation, flood, title, zoning, code violations)?
- Is there a deadline driving the sale (1031 exchange, divorce, estate, relocation)? That informs how much negotiation room exists.
- The area grade is low — what's the realistic commute time and amenity access for the typical tenant pool here? Any planned neighborhood developments (good or bad) we should know about?
- What's the average days-on-market for RENTAL listings here right now (not sales)? A rising rental-DOM trend means longer vacancies and softer asking-rent achievability than the comps imply.
- What's the recent tenant-quality profile in this submarket — average credit score on applications, eviction rate, late-payment / NSF rate, and stable-employment percentage? A property-management company in the area should have these aggregated.
- How much new for-sale + rental construction is in the pipeline within 1–3 miles? Heavy new supply typically softens prices + rents 12–24 months out; constrained supply supports both.
Investment metrics
- 1% rule
- 1.04% ✓
- Cap rate
- 8.10%
- Cash-on-cash
- 6.44%
- DSCR
- 1.29
- GRM
- 8.0
CMA / ARV
- ARV (on-the-fly)
- $213,840
- Comps found
- 12
Show comp detail 12 sales within ~0.75 mi
| Address | Dist | Beds/Ba | Sqft | Sold | Price | $/sf | Match |
|---|---|---|---|---|---|---|---|
| 122 Brown St | 0.03mi | 3/1.0 | 1,080 (0%) | 2mo | $215,000 | $199 | 97 |
| 144 Grant St | 0.06mi | 3/1.0 | 1,080 (0%) | 3mo | $67,150 | $62 | 94 |
| 112 Rancocas Rd | 0.07mi | 3/1.0 | 1,218 (+13%) | 5mo | $270,000 | $222 | 71 |
| 23 W Monroe St | 0.41mi | 3/1.0 | 1,160 (+7%) | 4mo | $225,000 | $194 | 65 |
| 17 W Monroe St | 0.42mi | 3/1.0 | 1,168 (+8%) | 7mo | $215,000 | $184 | 61 |
| 137 Risdon St | 0.65mi | 3/1.5 | 1,088 (+1%) | 8mo | $210,000 | $193 | 60 |
| 58 E Monroe St | 0.53mi | 3/1.0 | 1,162 (+8%) | 7mo | $229,900 | $198 | 56 |
| 22 Brainerd St | 0.38mi | 3/1.5 | 1,237 (+14%) | 0mo | $250,000 | $202 | 56 |
| 51 White St | 0.44mi | 3/1.0 | 1,198 (+11%) | 8mo | $230,000 | $192 | 55 |
| 43 Church St | 0.46mi | 2/1.0 (-1) | 1,176 (+9%) | 7mo | $200,000 | $170 | 53 |
| 7 Regency Dr | 0.67mi | 2/1.5 (-1) | 1,008 (-7%) | 9mo | $282,000 | $280 | 43 |
| 113 Risdon St | 0.66mi | 2/1.0 (-1) | 1,176 (+9%) | 8mo | $260,000 | $221 | 42 |
Match score weights: distance 35% · size 25% · config 20% · recency 20%. Top-matched comps best support the ARV.
Projected returns pro-forma
-3.0% appreciation · 1.42% rent growth · sell at horizon
- IRR
- -9.9%
- Equity multiple
- 0.65×
- Total profit
- $-24,810
- Equity at exit
- $37,276
- IRR
- -2.8%
- Equity multiple
- 0.83×
- Total profit
- $-12,156
- Equity at exit
- $21,615
Cash invested: $70,000 (down + closing). Projections, not guarantees.
Landlord ↔ Tenant lean methodology
- Overall (STATE)
- 21 Tenant-Leaning
- State New Jersey
- 21 Tenant-Leaning · D+6
- County
- — inherits STATE
- City
- — inherits STATE
ZIP-level market 08060
- Home prices YoY
- -34.5%
- Rents YoY
- 1.4%
- Active inventory
- 134
- Price-to-rent
- 8.0×
Monthly cashflow live
- Estimated rent
- $2,590 high interval (Pro) →
- Mortgage (P&I)
- −$1,311
- Tax from tax record
- −$255 /mo · $3,058/yr
- Insurance
- −$104
- Flood insurance flood zone
- −$66 /mo · $798/yr
- HOA
- −$0
- Vacancy / Maint / Mgmt
- −$544
- Net cashflow
- $309
Break-even live
UW: 25.0% down · 7.5% · 30yr · 1.5% tax · 5.0% vac · 8.0% maint · 8.0% mgmt
Financing live
Cash to close
- Down payment
- $62,500
- Closing costs
- $7,500
- Reserves months
- —
- Total cash needed
- —
Loan-product check · same deal, 3 products live
Conventional
25% down · 7.5% · 30yr
- Down + closing
- —
- Monthly P&I
- —
- Monthly cashflow
- —
- DSCR
- —
- Eligible?
- —
Personal DTI + credit; lowest rate.
DSCR
20% down · 8.5% · 30yr
- Down + closing
- —
- Monthly P&I
- —
- Monthly cashflow
- —
- DSCR
- —
- Eligible?
- —
No personal income docs; deal must DSCR.
Hard money
10% down · 12.0% · 12mo
- Down + closing
- —
- Monthly P&I
- —
- Monthly cashflow
- —
- DSCR
- —
- Eligible?
- —
Short-term bridge; refi at stabilization.
Rent comps 13 comps
| Address | Beds | Baths | Sqft | Rent | $/sqft | DOM | Units | Dist |
|---|---|---|---|---|---|---|---|---|
| 144 Washington St Unit C Mt Holly, NJ | 3.0 | 1.0 | 1450 | $2,370 | $1.63 | 15d | 1 | 0.25mi |
| 105 Broad St Unit 1 Mt Holly, NJ | 3.0 | 1.0 | 1100 | $2,200 | $2.00 | 1d | 1 | 0.46mi |
| 102 Ridgway St Unit 1 Mt Holly, NJ | 3.0 | 2.5 | 850 | $2,200 | $2.59 | 1d | 1 | 0.46mi |
| 302 Barrington Ct Mt Holly, NJ | 1.0–3.0 | 1.0–2.5 | 1226 | $2,959 | $2.41 | 1d | 9 | 0.47mi |
| 64 Regency Dr Mt Holly, NJ | 1.0–3.0 | 1.0–2.0 | 1066 | $2,800 | $2.63 | 1d | 1 | 0.57mi |
| 1 Kirby Ct Mt Holly, NJ | 1.0–3.0 | 1.0–2.5 | 1349 | $3,125 | $2.32 | 1d | 12 | 0.59mi |
| 209 Mill St Mount Holly, NJ | 3.0 | 1.5 | 1274 | $2,400 | $1.88 | 1d | 1 | 0.59mi |
| 209 Front St Mount Holly, NJ | 4.0 | 2.5 | 1500 | $4,950 | $3.30 | 1d | 1 | 0.89mi |
| 533 Garden St Mount Holly, NJ | 1.0–2.0 | 1.0 | 750 | $2,185 | $2.91 | 1d | 8 | 0.99mi |
| 1401 Windmill Way Lumberton, NJ | 1.0–2.0 | 1.0–2.0 | 947 | $2,315 | $2.44 | 1d | 29 | 1.30mi |
| 3a Hunter Cir Eastampton Township, NJ | 1.0–2.0 | 1.0–1.5 | 865 | $2,255 | $2.61 | 1d | 25 | 1.33mi |
| A1 Bentley Rd Mount Holly, NJ | 1.0–2.0 | 1.0 | 922 | $2,075 | $2.25 | 1d | 24 | 1.36mi |
| 5 Mulberry Ct Lumberton, NJ | 3.0 | 1.5 | 1244 | $2,200 | $1.77 | 1d | 1 | 1.47mi |
Listing history 26 events
-
2026-06-18days on market $250,000 Active 62 DOM
-
2026-06-17days on market $250,000 Active 61 DOM
-
2026-06-16days on market $250,000 Active 60 DOM
-
2026-06-15days on market $250,000 Active 59 DOM
-
2026-06-13days on market $250,000 Active 57 DOM
-
2026-06-13remarks 699-char remark
-
2026-06-13pricestatusdays on market $250,000 Active 56 DOM
-
2026-05-11status Pending
-
2026-03-19$235,000 Active
-
2026-03-17historical $235,000
-
2019-12-10soldstatus $70,000
-
2019-11-25soldstatus $70,000 Closed 289-char remark
Show marketing remark (289 chars)
This 3 BR, 1 BA row home is priced for a quick sale. It features updated kitchen and bath, and has been freshly painted with new carpet and laminate flooring. Ideal location--within walking from downtown and public transportation. So don't snooze on it. Instead; schedule a showing today!
-
2019-11-08status Pending 289-char remark
Show marketing remark (289 chars)
This 3 BR, 1 BA row home is priced for a quick sale. It features updated kitchen and bath, and has been freshly painted with new carpet and laminate flooring. Ideal location--within walking from downtown and public transportation. So don't snooze on it. Instead; schedule a showing today!
-
2019-10-17$84,999 Active 289-char remark
Show marketing remark (289 chars)
This 3 BR, 1 BA row home is priced for a quick sale. It features updated kitchen and bath, and has been freshly painted with new carpet and laminate flooring. Ideal location--within walking from downtown and public transportation. So don't snooze on it. Instead; schedule a showing today!
-
2017-09-18soldstatus $36,000 337-char remark
Show marketing remark (337 chars)
This three bedroom, bath and a half, brick town home is waiting for your finishing touches. Home is centrally located in the heart of Mount Holly convenient to County Buildings, Hospital, public transportation, shopping and all major arteries. No HOA fees add to the affordability of this home. This is a Fannie Mae Homepath Opportunity!
-
2017-09-18soldstatus $36,000 Sold
Show marketing remark (337 chars)
This three bedroom, bath and a half, brick town home is waiting for your finishing touches. Home is centrally located in the heart of Mount Holly convenient to County Buildings, Hospital, public transportation, shopping and all major arteries. No HOA fees add to the affordability of this home. This is a Fannie Mae Homepath Opportunity!
-
2017-08-16status Under Contract
-
2017-07-21$36,900 Active
-
2006-11-20soldstatus $91,000
-
2006-11-11historical
-
2006-10-31soldstatus $91,000
-
2006-09-22historical
-
2006-07-20$91,000
-
2006-04-08$89,000
-
2001-09-30historical
-
2001-01-09$59,900
ⓘ Source: listings_history table (triggers on properties + properties_extension) + one-shot
backfill from property_details.listing_events for pre-trigger history.
Tax reassessment forecast NJ · Partial reset (capped growth)
- Current annual tax
- $3,058 · $255/mo
- Projected year-2 tax
- $4,642 · $387/mo
- Expected delta
- +$1,583/yr (+$132/mo · 51.8%)
ⓘ Screening estimate from a state-policy table — verify with the county assessor before closing.
Climate risk First Street
- Flood 9/10 Extreme FEMA zone X (shaded) · 99% chance over 30 yrs
- Wildfire 2/10 Low
- Heat 7/10 Severe 7 d/yr ≥104°F today · 15 d/yr by 30 yrs out
- Wind 6/10 Major 51% chance of damaging wind over 30 yrs
- Air quality 4/10 Moderate 5 unhealthy d/yr today · 7 by 30 yrs out
Nearby sold comps map
Loading sold comps map…
Walkable amenities ~0.75 mi
Loading nearby amenities…
Taxation est. · year 1
- Rental income
- $31,078
- − Mortgage interest
- −$14,004
- − Property taxes
- −$3,058
- − Insurance
- −$2,048
- − Repairs & maintenance
- −$2,486
- − Management
- −$2,486
- − Depreciation
- −$7,273
- Taxable loss
- −$277
- Est. tax savings @ 24.0%
- +$66
- After-tax cash flow
- $3,780/yr
For passive investors: Depreciation is non-cash, so a rental often shows a tax loss while cash-flowing — sheltering income. Rental losses are passive: they offset passive income freely, and up to $25,000/yr can offset ordinary (W-2) income if you actively participate and your MAGI is under $100k (phasing out to $0 by $150k); unused losses carry forward. On sale, claimed depreciation is recaptured at up to 25%, and gains may owe capital-gains tax (a 1031 exchange can defer both). Figures are a year-1 estimate at your 24.0% rate — not tax advice; consult a CPA.
Schools (NCES district)
- District
- Rancocas Valley Regional High School District
- NCES district ID
- 3413620
- Math proficiency
- 29% ▼ -18.00%
- Reading proficiency
- 49% ▼ -4.00%
- Median HH income
- $58,992
- Composite
- 34.45/100
- National rank
- #5195
- State rank
- #236 of 472 in NJ
Livability — Vincentown
No livability data for this city. (Only ~50 U.S. cities are tracked.)
Census & demographics
- County
- Burlington County · 323,710 people
- Metro
- Philadelphia-Camden-Wilmington, PA-NJ-DE-MD
- Population (ZIP)
- 25,835
- Household income
- $109,292
- Rent vs Own
- Severe rent burden
- 562.0
Population outlook (Burlington County) Hauer SSP2
- Today (2025)
- 453,425 people
- By 2030
- 452,359 · -0.2%
- By 2040
- 445,033 · -1.9%
- By 2050
- 431,760 · -4.8%
- By 2075
- 406,277 · -10.4%
- By 2100
- 364,732 · -19.6%
Race, ethnicity, and origin ACS 2023
- Neighborhood character
- Diverse neighborhood (Simpson 0.68)
- Race & ethnicity
- White 49% Black 25% Two or more races 15% Hispanic / Latino 13% Asian 4%
- Hispanic origin (detail)
- Mexican 2% Puerto Rican 7%
- Common ancestry
- Romanian 4% Lithuanian 2% Italian 1%
- Foreign-born
- 11% · Canada, Dominican Republic, China
- Languages at home
- 87% English-only · Spanish 7% Other Indo-European 2% French/Haitian/Cajun 1%
Political lean MEDSL · Burlington
- 2024 margin
- D (+16.6) · D 57.6% · R 41.0% · Other 1.3%
- 2008→2024 swing
- -2.0pp toward R · 2008: 18.6pp · 2024: 16.6pp
- All cycles
- 2024: D+16.6 2020: D+19.5 2016: D+14.8 2012: D+18.7 2008: D+18.6
Not yet ingested
- Civics
- —
Market trends
- HPI YoY
- ▼ -156.50%
- Current HPI
- 296.564
- Rent YoY
- ▲ 1.42%
- Metro
- Philadelphia-Camden-Wilmington, PA-NJ-DE-MD
- State GDP YoY
- ▲ 2.05%
- F500 in state
- 34
Industry mix (Fortune 500 HQ in NJ)
| Industry | F500 HQs | Revenue |
|---|---|---|
| Consumer Goods | 3 | $31B |
|
||
| Pharmaceuticals | 2 | $153B |
|
||
| Technology | 2 | $21B |
|
||
| Insurance | 2 | $20B |
|
||
| Healthcare | 2 | $19B |
|
||
| Financial Services | 1 | $70B |
|
||
Price history
+292.3% since first listed19 events — show timeline
- 2026-05-11 Pending — BRIGHT MLS
- 2026-03-19 Listed $235,000 BRIGHT MLS
- 2026-03-17 Coming Soon $235,000 BRIGHT MLS
- 2019-12-10 Sold (Public Records) $70,000 Public Records
- 2019-11-25 Sold (MLS) $70,000 BRIGHT MLS
- 2019-11-08 Pending — BRIGHT MLS
- 2019-10-17 Listed $84,999 BRIGHT MLS
- 2017-09-18 Sold (MLS) $36,000 TREND
- 2017-09-18 Sold (MLS) $36,000 BRIGHT MLS
- 2017-08-16 Pending — TREND
- 2017-07-21 Listed $36,900 TREND
- 2006-11-20 Sold (Public Records) $91,000 Public Records
- 2006-11-11 Listing Removed — BRIGHT MLS
- 2006-10-31 Sold (MLS) $91,000 BRIGHT MLS
- 2006-09-22 Listing Removed — BRIGHT MLS
- 2006-07-20 Listed $91,000 BRIGHT MLS
- 2006-04-08 Listed $89,000 BRIGHT MLS
- 2001-09-30 Listing Removed — BRIGHT MLS
- 2001-01-09 Listed $59,900 BRIGHT MLS
Property tax history
+2.3%/yrLatest (2025): $3,058 · +6.6% YoY. Source: county tax records.
Cash-flow waterfall
monthlySold comps — $/sqft
last 12 mo · ≤1 miLoading sold comps…